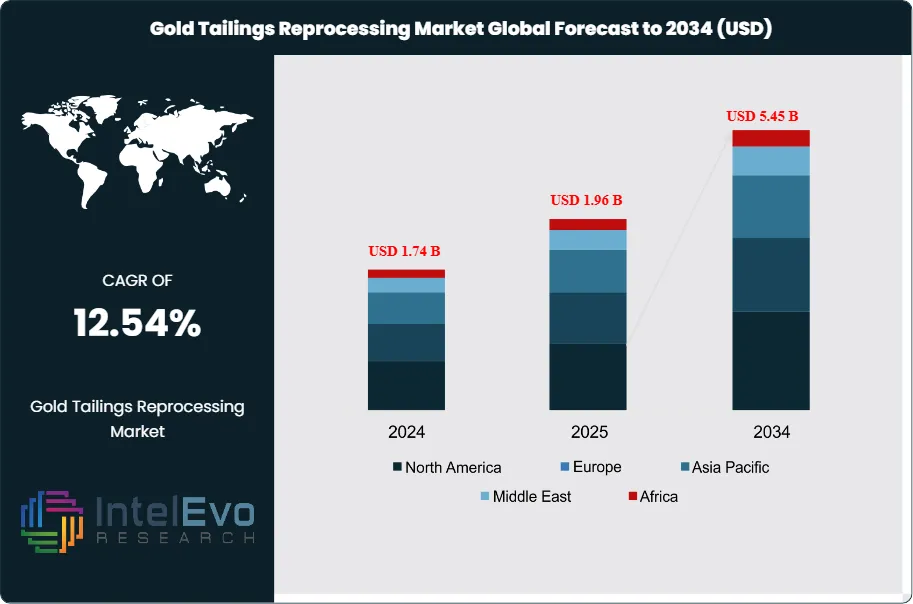
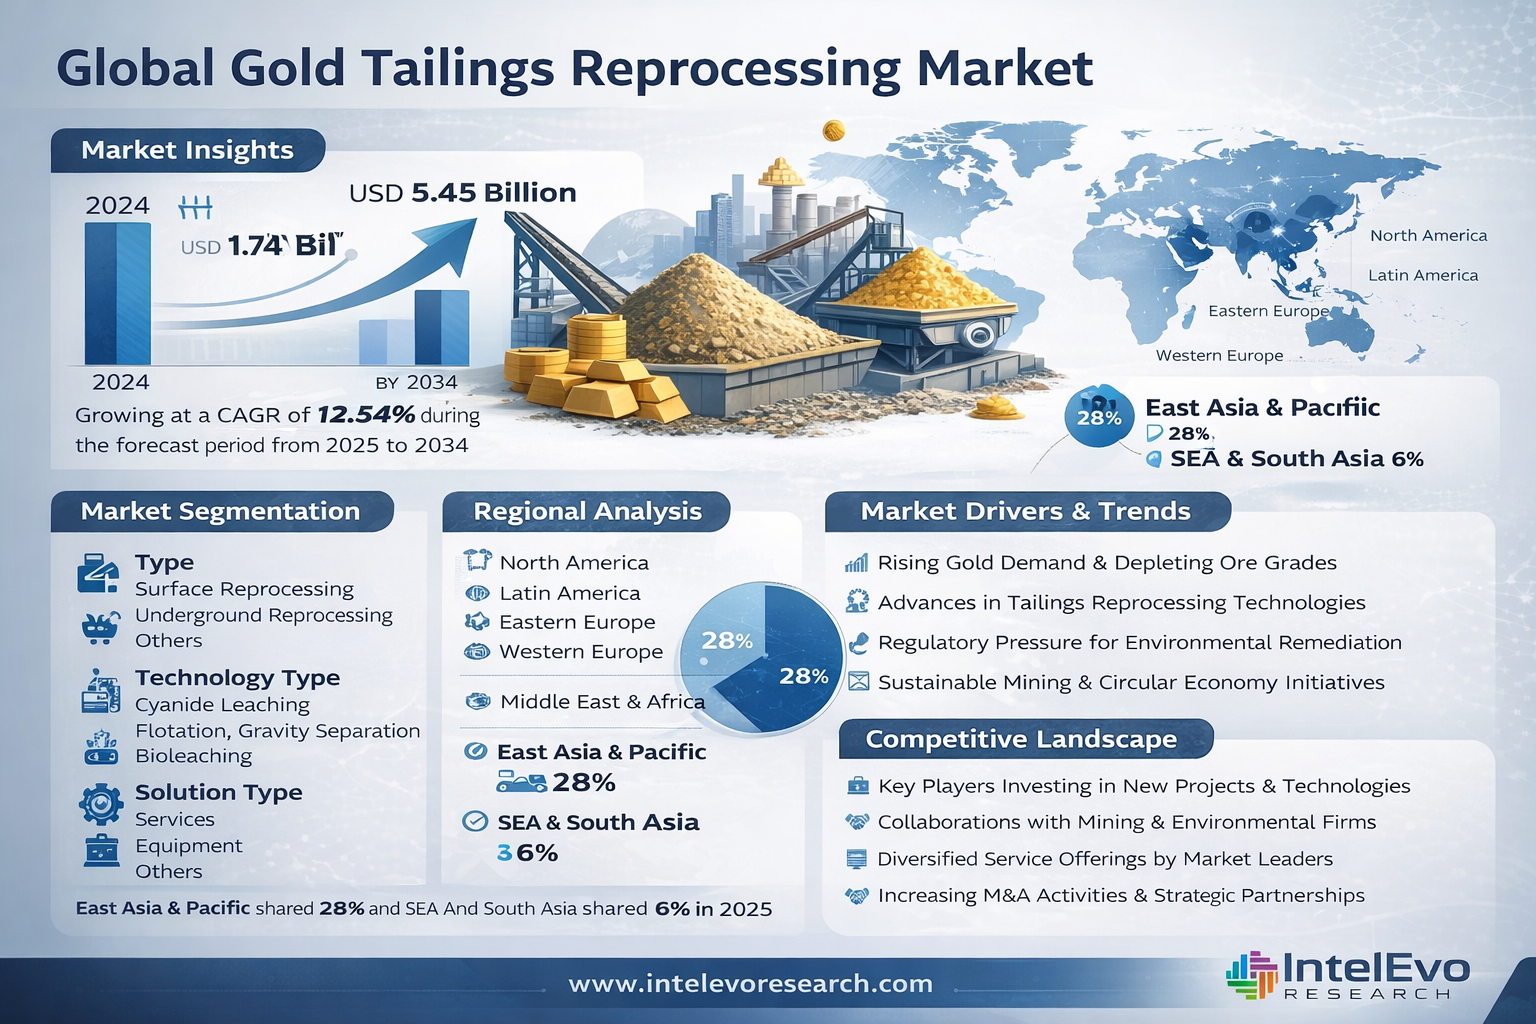
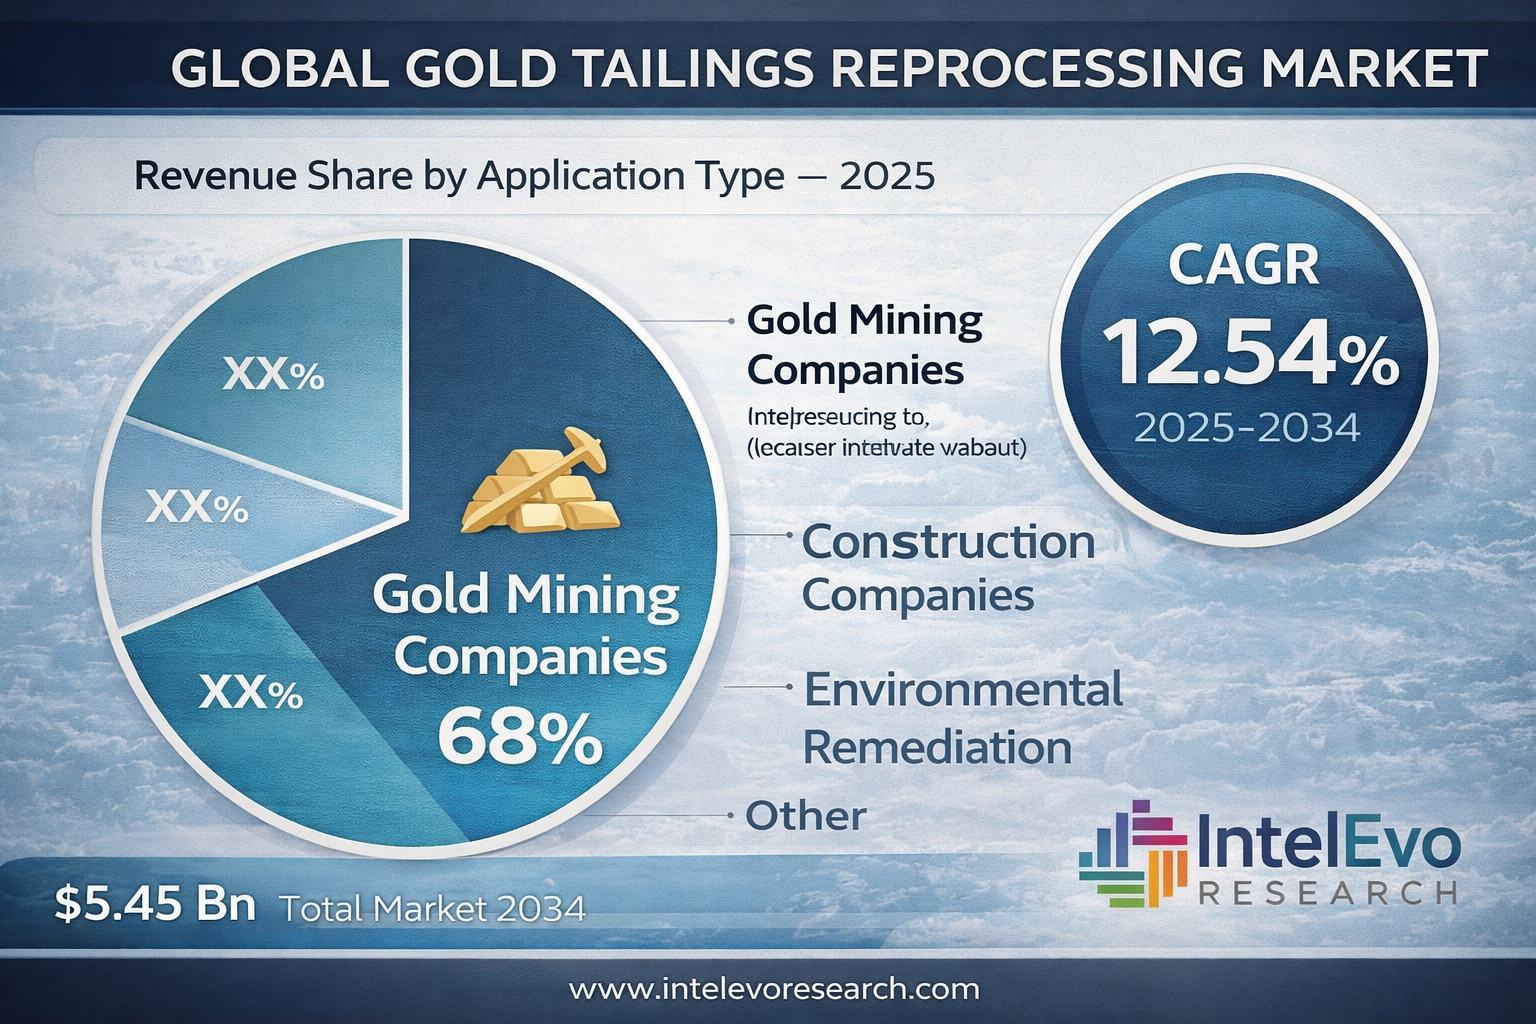
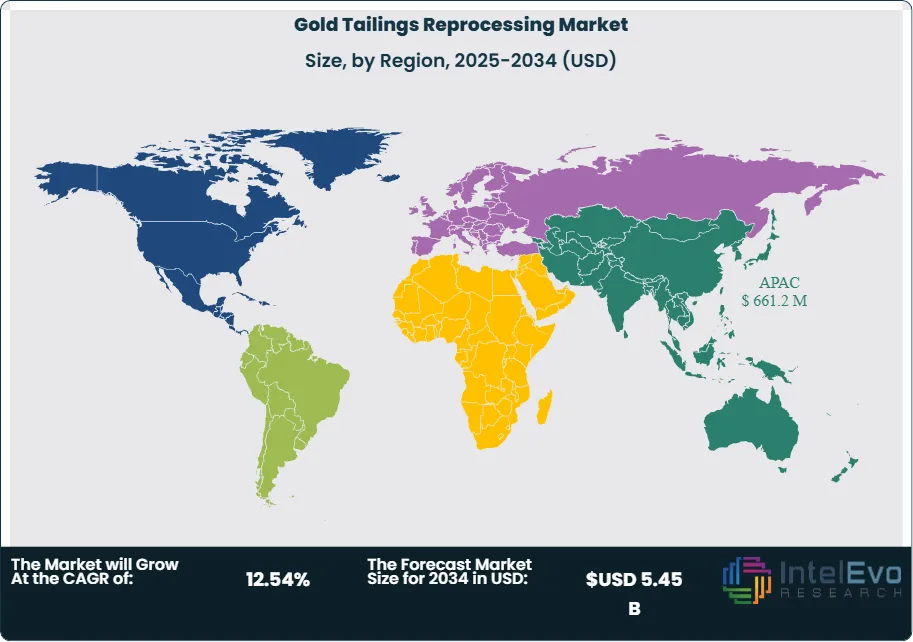
The Gold Tailings Reprocessing Market is growing as mining companies and governments look for sustainable ways to extract valuable minerals from old mining waste. The market was valued at USD 1.74 billion in 2024 and is expected to reach around USD 5.45 billion by 2034, with a Compound Annual Growth Rate (CAGR) of 12.54% during the period from 2025 to 2034. Gold tailings reprocessing involves extracting leftover gold and other valuable elements from mining waste from past operations. This process uses technologies such as bioleaching, flotation, and cyanide recovery.
Tailings reprocessing is increasingly seen as both an economic opportunity and an environmental necessity. The market includes various solutions, from traditional gravity separation and chemical leaching to more modern methods like microbial and hydrometallurgical processes. Innovations in extraction technologies, stricter environmental regulations, and rising gold prices are driving increased interest in tailings repositories around the world.
Key growth factors include the need for environmental cleanup, improved recovery rates from technological advancements, and the financial benefit of accessing valuable metals without developing new mines. With growing pressures related to Environmental, Social, and Governance (ESG) issues, tailings reprocessing has become a vital sustainability strategy for mining companies—especially in areas where past mining practices have created environmental problems.
COVID-19 Impact: The COVID-19 pandemic initially disrupted mining operations due to supply chain issues, labor shortages, and shutdowns. However, as commodity prices rose and economic recovery programs focused on green remediation projects, gold tailings reprocessing gained renewed attention. Following the pandemic, many governments prioritized environmental restoration and job creation, making tailings projects both economically viable and necessary from an environmental standpoint.
Regional Conflicts and Trade Tensions: Trade tensions and geopolitical instability, especially in countries with intensive mining activities, can affect access to equipment, reagents, and technical partnerships. However, these tensions are also prompting countries to maximize the value of their domestic mineral resources, leading to increased investment in tailings projects. National policies that support resource security and critical mineral recovery further enhance the market's potential.
Key Takeaways
MarketGrowth: The Global Gold Tailings Reprocessing Market is expected to grow to USD 5.43 Billion by 2034, driven by increasing gold demand, environmental remediation needs, and advancements in extraction technologies.
ProductTypeDominance: Cyanide-based reprocessing techniques continue to dominate due to high gold recovery efficiency, though environmental alternatives are gaining traction.
Technology Dominance: Bioleaching and hydrometallurgical technologies are the fastest-growing segments as companies seek more sustainable and less toxic extraction processes.
ApplicationDominance: Reprocessing of legacy tailings from abandoned mines accounts for the largest market share, driven by both gold recovery potential and environmental liabilities.
End-UserDominance: Mining companies remain the dominant end-user segment, with increased interest from governments and environmental agencies.
DistributionChannelDominance: Direct project ownership and partnerships between mining firms and tech providers remain the most common model for project execution and funding.
Driver: The dual benefit of recovering valuable metals and remediating environmental hazards is a key driver of investment in tailings reprocessing.
Restraint: High upfront costs and uncertain metal content in older tailings remain significant risks, especially for smaller mining companies.
Opportunity: Recovery of critical minerals such as rare earths, lithium, and vanadium from old tailings represents a major untapped opportunity.
Trend: Integrated tailings valorization projects that include renewable energy and community development are an emerging trend in sustainable mining.
RegionalAnalysis: South Africa, Australia, and Latin America are leading due to their vast historical mining activities, while North America is expected to grow fastest due to strong regulatory and ESG-driven initiatives.
Product Type:
The Global Gold Tailings Reprocessing Market mainly produces reprocessed gold, obtained from previously discarded waste materials. In addition to gold, this segment also targets the recovery of other valuable minerals, such as silver, copper, and industrial minerals like mica, which were often missed in earlier mining operations. The end result of reprocessing also includes cleaner tailings, turned into a more stable and less dangerous form, often suitable for safe disposal or even reuse in construction materials. This varied product range showcases the economic and environmental advantages of tailings reprocessing.
Technology:
The Technology segment in gold tailings reprocessing is diverse, reflecting the different characteristics of tailings. Gravity Separation Technology is commonly used for coarser or free-milling gold particles, using equipment like shaking tables and spiral concentrators. Flotation Technology effectively targets sulfide-associated gold or fine gold particles, employing flotation cells and reagents. Cyanidation (Leaching) Technology, especially Carbon-In-Leach (CIL) or Carbon-In-Pulp (CIP), remains a reliable method for dissolving gold, though it needs strict environmental controls due to cyanide toxicity. New technologies like Bioleaching and Bacterial Oxidation provide low-cost, environmentally friendly options for difficult gold ores, using microorganisms to break down sulfide minerals. Supporting equipment such as dewatering screens, thickeners, conveyors, and pumps are also essential parts of a complete reprocessing plant.
Application:
The main application of gold tailings reprocessing is recovering leftover gold that was not extracted during initial mining, driven by better technologies and favorable gold prices. Additionally, there is a growing focus on extracting other valuable minerals that were once seen as too expensive or difficult to recover. A crucial application is environmental remediation, where reprocessing helps neutralize or isolate harmful components in old tailings, reducing their ecological impact and associated risks. This supports sustainable mining practices and can turn waste sites into safer environments.
Region:
Regions with extensive historical gold mining activities and large tailings dams are key markets for gold tailings reprocessing. The Asia-Pacific region, particularly China and Australia, is significant due to its large mining output and increasing focus on waste management. North America (U.S., Canada) and Latin America (e.g., Peru, Mexico, Chile) also hold considerable reprocessing potential given their long mining histories and large tailings inventories. Africa, especially countries with significant gold reserves like South Africa and Ghana, shows a growing market as they aim to maximize resource recovery and tackle environmental issues.
Type (Surface Reprocessing, Underground Reprocessing, Others) Technology Type (Cyanide Leaching, Flotation, Gravity Separation, Bioleaching, Others) Solution Type (Service, Equipment, Others) Application Type (Glod Mining Companies, Construction Companies, Environmental Remediation, Others)
Research Methodology
Primary Research- 100 Interviews of Stakeholders
Secondary Research
Desk Research
Regional scope
North America (United States, Canada, Mexico)
Latin America (Brazil, Argentina, Columbia)
East Asia And Pacific (China, Japan, South Korea, Australia, Cambodia, Fiji, Indonesia)
Sea And South Asia (India, Singapore, Thailand, Taiwan, Malaysia)
Eastern Europe (Poland, Russia, Czech Republic, Romania)
Western Europe (Germany, U.K., France, Spain, Itlay)
Middle East & Africa (GCC Countries, Egypt, Nigeria, South Africa, Israel)
Competitive Landscape
AngloGold Ashanti, Barrick Gold Corporation, Gold Fields Limited, Kinross Gold Corporation, Newmont Corporation, Pan African Resources PLC, Sibanye-Stillwater Limited, BHP Group Ltd, Rio Tinto., Shandong Xinhai Mining Technology & Equipment Inv, DRD Gold, 1911 Gold Corporation, Metso, Fraser Alexander (Pty) Ltd, Polymetal International Plc, EnviroGold, BacTech, SGS SA
Customization Scope
Customization for segments, region/country-level will be provided. Moreover, additional customization can be done based on the requirements.
Pricing and Purchase Options
Avail customized purchase options to meet your exact research needs. We have three licenses to opt for: Single User License, Multi-User License (Up to 5 Users), Corporate Use License (Unlimited User and Printable PDF).
TABLE OF CONTENTS
1. EXECUTIVE SUMMARY
1.1. MARKET SNAPSHOT
1.2. KEY FINDINGS & INSIGHTS
1.3. ANALYST RECOMMENDATIONS
1.4. FUTURE OUTLOOK
2. RESEARCH METHODOLOGY
2.1. MARKET DEFINITION & SCOPE
2.2. RESEARCH OBJECTIVES: PRIMARY & SECONDARY DATA SOURCES
2.3. DATA COLLECTION SOURCES
2.3.1. COVERAGE OF 100+ PRIMARY RESEARCH/CONSULTATION CALLS WITH INDUSTRY STAKEHOLDERS
FIGURE 17 NORTH AMERICA GOLD TAILINGS REPROCESSING CURRENT AND FUTURE TYPE ANALYSIS, 2025–2034, (USD MILLION)
FIGURE 18 NORTH AMERICA GOLD TAILINGS REPROCESSING CURRENT AND FUTURE END USER ANALYSIS, 2025–2034, (USD MILLION)
FIGURE 19 MARKET SHARE BY COUNTRY
FIGURE 20 LATIN AMERICA GOLD TAILINGS REPROCESSING CURRENT AND FUTURE TYPE ANALYSIS, 2025–2034, (USD MILLION)
FIGURE 21 LATIN AMERICA GOLD TAILINGS REPROCESSING CURRENT AND FUTURE END USER ANALYSIS, 2025–2034, (USD MILLION)
FIGURE 22 MARKET SHARE BY COUNTRY
FIGURE 23 EASTERN EUROPE GOLD TAILINGS REPROCESSING CURRENT AND FUTURE TYPE ANALYSIS, 2025–2034, (USD MILLION)
FIGURE 24 EASTERN EUROPE GOLD TAILINGS REPROCESSING CURRENT AND FUTURE END USER ANALYSIS, 2025–2034, (USD MILLION)
FIGURE 25 MARKET SHARE BY COUNTRY
FIGURE 26 WESTERN EUROPE GOLD TAILINGS REPROCESSING CURRENT AND FUTURE TYPE ANALYSIS, 2025–2034, (USD MILLION)
FIGURE 27 WESTERN EUROPE GOLD TAILINGS REPROCESSING CURRENT AND FUTURE END USER ANALYSIS, 2025–2034, (USD MILLION)
FIGURE 28 MARKET SHARE BY COUNTRY
FIGURE 29 EAST ASIA AND PACIFIC GOLD TAILINGS REPROCESSING CURRENT AND FUTURE TYPE ANALYSIS, 2025–2034, (USD MILLION)
FIGURE 30 EAST ASIA AND PACIFIC GOLD TAILINGS REPROCESSING CURRENT AND FUTURE END USER ANALYSIS, 2025–2034, (USD MILLION)
FIGURE 31 MARKET SHARE BY COUNTRY
FIGURE 32 SEA AND SOUTH ASIA GOLD TAILINGS REPROCESSING CURRENT AND FUTURE TYPE ANALYSIS, 2025–2034, (USD MILLION)
FIGURE 33 SEA AND SOUTH ASIA GOLD TAILINGS REPROCESSING CURRENT AND FUTURE END USER ANALYSIS, 2025–2034, (USD MILLION)
FIGURE 34 MARKET SHARE BY COUNTRY
FIGURE 35 MIDDLE EAST AND AFRICA GOLD TAILINGS REPROCESSING CURRENT AND FUTURE TYPE ANALYSIS, 2025–2034, (USD MILLION)
FIGURE 36 MIDDLE EAST AND AFRICA GOLD TAILINGS REPROCESSING CURRENT AND FUTURE END USER ANALYSIS, 2025–2034, (USD MILLION)
FIGURE 37 NORTH AMERICA GOLD TAILINGS REPROCESSING CURRENT AND FUTURE MARKET VOLUME SHARE REGIONAL ANALYSIS, 2025–2034, (USD MILLION)
FIGURE 38 U.S. GOLD TAILINGS REPROCESSING CURRENT AND FUTURE TYPE ANALYSIS, 2025–2034, (USD MILLION)
FIGURE 39 U.S. GOLD TAILINGS REPROCESSING CURRENT AND FUTURE END USER ANALYSIS, 2025–2034, (USD MILLION)
FIGURE 40 CANADA GOLD TAILINGS REPROCESSING CURRENT AND FUTURE TYPE ANALYSIS, 2025–2034, (USD MILLION)
FIGURE 41 CANADA GOLD TAILINGS REPROCESSING CURRENT AND FUTURE END USER ANALYSIS, 2025–2034, (USD MILLION)
FIGURE 42 LATIN AMERICA GOLD TAILINGS REPROCESSING CURRENT AND FUTURE MARKET VOLUME SHARE REGIONAL ANALYSIS, 2025–2034, (USD MILLION)
FIGURE 43 MEXICO GOLD TAILINGS REPROCESSING CURRENT AND FUTURE TYPE ANALYSIS, 2025–2034, (USD MILLION)
FIGURE 44 MEXICO GOLD TAILINGS REPROCESSING CURRENT AND FUTURE END USER ANALYSIS, 2025–2034, (USD MILLION)
FIGURE 45 BRAZIL GOLD TAILINGS REPROCESSING CURRENT AND FUTURE TYPE ANALYSIS, 2025–2034, (USD MILLION)
FIGURE 46 BRAZIL GOLD TAILINGS REPROCESSING CURRENT AND FUTURE END USER ANALYSIS, 2025–2034, (USD MILLION)
FIGURE 47 ARGENTINA GOLD TAILINGS REPROCESSING CURRENT AND FUTURE TYPE ANALYSIS, 2025–2034, (USD MILLION)
FIGURE 48 ARGENTINA GOLD TAILINGS REPROCESSING CURRENT AND FUTURE END USER ANALYSIS, 2025–2034, (USD MILLION)
FIGURE 49 COLUMBIA GOLD TAILINGS REPROCESSING CURRENT AND FUTURE TYPE ANALYSIS, 2025–2034, (USD MILLION)
FIGURE 50 COLUMBIA GOLD TAILINGS REPROCESSING CURRENT AND FUTURE END USER ANALYSIS, 2025–2034, (USD MILLION)
FIGURE 51 REST OF LATIN AMERICA GOLD TAILINGS REPROCESSING CURRENT AND FUTURE TYPE ANALYSIS, 2025–2034, (USD MILLION)
FIGURE 52 REST OF LATIN AMERICA GOLD TAILINGS REPROCESSING CURRENT AND FUTURE END USER ANALYSIS, 2025–2034, (USD MILLION)
FIGURE 53 EASTERN EUROPE GOLD TAILINGS REPROCESSING CURRENT AND FUTURE MARKET VOLUME SHARE REGIONAL ANALYSIS, 2025–2034, (USD MILLION)
FIGURE 54 POLAND GOLD TAILINGS REPROCESSING CURRENT AND FUTURE TYPE ANALYSIS, 2025–2034, (USD MILLION)
FIGURE 55 POLAND GOLD TAILINGS REPROCESSING CURRENT AND FUTURE END USER ANALYSIS, 2025–2034, (USD MILLION)
FIGURE 56 RUSSIA GOLD TAILINGS REPROCESSING CURRENT AND FUTURE TYPE ANALYSIS, 2025–2034, (USD MILLION)
FIGURE 57 RUSSIA GOLD TAILINGS REPROCESSING CURRENT AND FUTURE END USER ANALYSIS, 2025–2034, (USD MILLION)
FIGURE 58 CZECH REPUBLIC GOLD TAILINGS REPROCESSING CURRENT AND FUTURE TYPE ANALYSIS, 2025–2034, (USD MILLION)
FIGURE 59 CZECH REPUBLIC GOLD TAILINGS REPROCESSING CURRENT AND FUTURE END USER ANALYSIS, 2025–2034, (USD MILLION)
FIGURE 60 ROMANIA GOLD TAILINGS REPROCESSING CURRENT AND FUTURE TYPE ANALYSIS, 2025–2034, (USD MILLION)
FIGURE 61 ROMANIA GOLD TAILINGS REPROCESSING CURRENT AND FUTURE END USER ANALYSIS, 2025–2034, (USD MILLION)
FIGURE 62 REST OF EASTERN EUROPE GOLD TAILINGS REPROCESSING CURRENT AND FUTURE TYPE ANALYSIS, 2025–2034, (USD MILLION)
FIGURE 63 REST OF EASTERN EUROPE GOLD TAILINGS REPROCESSING CURRENT AND FUTURE END USER ANALYSIS, 2025–2034, (USD MILLION)
FIGURE 64 WESTERN EUROPE GOLD TAILINGS REPROCESSING CURRENT AND FUTURE MARKET VOLUME SHARE REGIONAL ANALYSIS, 2025–2034, (USD MILLION)
FIGURE 65 GERMANY GOLD TAILINGS REPROCESSING CURRENT AND FUTURE TYPE ANALYSIS, 2025–2034, (USD MILLION)
FIGURE 66 GERMANY GOLD TAILINGS REPROCESSING CURRENT AND FUTURE END USER ANALYSIS, 2025–2034, (USD MILLION)
FIGURE 67 FRANCE GOLD TAILINGS REPROCESSING CURRENT AND FUTURE TYPE ANALYSIS, 2025–2034, (USD MILLION)
FIGURE 68 FRANCE GOLD TAILINGS REPROCESSING CURRENT AND FUTURE END USER ANALYSIS, 2025–2034, (USD MILLION)
FIGURE 69 UK GOLD TAILINGS REPROCESSING CURRENT AND FUTURE TYPE ANALYSIS, 2025–2034, (USD MILLION)
FIGURE 70 UK GOLD TAILINGS REPROCESSING CURRENT AND FUTURE END USER ANALYSIS, 2025–2034, (USD MILLION)
FIGURE 71 SPAIN GOLD TAILINGS REPROCESSING CURRENT AND FUTURE TYPE ANALYSIS, 2025–2034, (USD MILLION)
FIGURE 72 SPAIN GOLD TAILINGS REPROCESSING CURRENT AND FUTURE END USER ANALYSIS, 2025–2034, (USD MILLION)
FIGURE 73 ITALY GOLD TAILINGS REPROCESSING CURRENT AND FUTURE TYPE ANALYSIS, 2025–2034, (USD MILLION)
FIGURE 74 ITALY GOLD TAILINGS REPROCESSING CURRENT AND FUTURE END USER ANALYSIS, 2025–2034, (USD MILLION)
FIGURE 75 REST OF WESTERN EUROPE GOLD TAILINGS REPROCESSING CURRENT AND FUTURE TYPE ANALYSIS, 2025–2034, (USD MILLION)
FIGURE 76 REST OF WESTERN EUROPE GOLD TAILINGS REPROCESSING CURRENT AND FUTURE END USER ANALYSIS, 2025–2034, (USD MILLION)
FIGURE 77 EAST ASIA AND PACIFIC GOLD TAILINGS REPROCESSING CURRENT AND FUTURE MARKET VOLUME SHARE REGIONAL ANALYSIS, 2025–2034, (USD MILLION)
FIGURE 78 CHINA GOLD TAILINGS REPROCESSING CURRENT AND FUTURE TYPE ANALYSIS, 2025–2034, (USD MILLION)
FIGURE 79 CHINA GOLD TAILINGS REPROCESSING CURRENT AND FUTURE END USER ANALYSIS, 2025–2034, (USD MILLION)
FIGURE 80 JAPAN GOLD TAILINGS REPROCESSING CURRENT AND FUTURE TYPE ANALYSIS, 2025–2034, (USD MILLION)
FIGURE 81 JAPAN GOLD TAILINGS REPROCESSING CURRENT AND FUTURE END USER ANALYSIS, 2025–2034, (USD MILLION)
FIGURE 82 AUSTRALIA GOLD TAILINGS REPROCESSING CURRENT AND FUTURE TYPE ANALYSIS, 2025–2034, (USD MILLION)
FIGURE 83 AUSTRALIA GOLD TAILINGS REPROCESSING CURRENT AND FUTURE END USER ANALYSIS, 2025–2034, (USD MILLION)
FIGURE 84 CAMBODIA GOLD TAILINGS REPROCESSING CURRENT AND FUTURE TYPE ANALYSIS, 2025–2034, (USD MILLION)
FIGURE 85 CAMBODIA GOLD TAILINGS REPROCESSING CURRENT AND FUTURE END USER ANALYSIS, 2025–2034, (USD MILLION)
FIGURE 86 FIJI GOLD TAILINGS REPROCESSING CURRENT AND FUTURE TYPE ANALYSIS, 2025–2034, (USD MILLION)
FIGURE 87 FIJI GOLD TAILINGS REPROCESSING CURRENT AND FUTURE END USER ANALYSIS, 2025–2034, (USD MILLION)
FIGURE 88 INDONESIA GOLD TAILINGS REPROCESSING CURRENT AND FUTURE TYPE ANALYSIS, 2025–2034, (USD MILLION)
FIGURE 89 INDONESIA GOLD TAILINGS REPROCESSING CURRENT AND FUTURE END USER ANALYSIS, 2025–2034, (USD MILLION)
FIGURE 90 SOUTH KOREA GOLD TAILINGS REPROCESSING CURRENT AND FUTURE TYPE ANALYSIS, 2025–2034, (USD MILLION)
FIGURE 91 SOUTH KOREA GOLD TAILINGS REPROCESSING CURRENT AND FUTURE END USER ANALYSIS, 2025–2034, (USD MILLION)
FIGURE 92 REST OF EAST ASIA AND PACIFIC GOLD TAILINGS REPROCESSING CURRENT AND FUTURE TYPE ANALYSIS, 2025–2034, (USD MILLION)
FIGURE 93 REST OF EAST ASIA AND PACIFIC GOLD TAILINGS REPROCESSING CURRENT AND FUTURE END USER ANALYSIS, 2025–2034, (USD MILLION)
FIGURE 94 SEA AND SOUTH ASIA GOLD TAILINGS REPROCESSING CURRENT AND FUTURE MARKET VOLUME SHARE REGIONAL ANALYSIS, 2025–2034, (USD MILLION)
FIGURE 95 BANGLADESH GOLD TAILINGS REPROCESSING CURRENT AND FUTURE TYPE ANALYSIS, 2025–2034, (USD MILLION)
FIGURE 96 BANGLADESH GOLD TAILINGS REPROCESSING CURRENT AND FUTURE END USER ANALYSIS, 2025–2034, (USD MILLION)
FIGURE 97 NEW ZEALAND GOLD TAILINGS REPROCESSING CURRENT AND FUTURE TYPE ANALYSIS, 2025–2034, (USD MILLION)
FIGURE 98 NEW ZEALAND GOLD TAILINGS REPROCESSING CURRENT AND FUTURE END USER ANALYSIS, 2025–2034, (USD MILLION)
FIGURE 99 INDIA GOLD TAILINGS REPROCESSING CURRENT AND FUTURE TYPE ANALYSIS, 2025–2034, (USD MILLION)
FIGURE 100 INDIA GOLD TAILINGS REPROCESSING CURRENT AND FUTURE END USER ANALYSIS, 2025–2034, (USD MILLION)
FIGURE 101 SINGAPORE GOLD TAILINGS REPROCESSING CURRENT AND FUTURE TYPE ANALYSIS, 2025–2034, (USD MILLION)
FIGURE 102 SINGAPORE GOLD TAILINGS REPROCESSING CURRENT AND FUTURE END USER ANALYSIS, 2025–2034, (USD MILLION)
FIGURE 103 THAILAND GOLD TAILINGS REPROCESSING CURRENT AND FUTURE TYPE ANALYSIS, 2025–2034, (USD MILLION)
FIGURE 104 THAILAND GOLD TAILINGS REPROCESSING CURRENT AND FUTURE END USER ANALYSIS, 2025–2034, (USD MILLION)
FIGURE 105 TAIWAN GOLD TAILINGS REPROCESSING CURRENT AND FUTURE TYPE ANALYSIS, 2025–2034, (USD MILLION)
FIGURE 106 TAIWAN GOLD TAILINGS REPROCESSING CURRENT AND FUTURE END USER ANALYSIS, 2025–2034, (USD MILLION)
FIGURE 107 MALAYSIA GOLD TAILINGS REPROCESSING CURRENT AND FUTURE TYPE ANALYSIS, 2025–2034, (USD MILLION)
FIGURE 108 MALAYSIA GOLD TAILINGS REPROCESSING CURRENT AND FUTURE END USER ANALYSIS, 2025–2034, (USD MILLION)
FIGURE 109 REST OF SEA AND SOUTH ASIA GOLD TAILINGS REPROCESSING CURRENT AND FUTURE TYPE ANALYSIS, 2025–2034, (USD MILLION)
FIGURE 110 REST OF SEA AND SOUTH ASIA GOLD TAILINGS REPROCESSING CURRENT AND FUTURE END USER ANALYSIS, 2025–2034, (USD MILLION)
FIGURE 111 MIDDLE EAST AND AFRICA GOLD TAILINGS REPROCESSING CURRENT AND FUTURE MARKET VOLUME SHARE REGIONAL ANALYSIS, 2025–2034, (USD MILLION)
FIGURE 112 GCC COUNTRIES GOLD TAILINGS REPROCESSING CURRENT AND FUTURE TYPE ANALYSIS, 2025–2034, (USD MILLION)
FIGURE 113 GCC COUNTRIES GOLD TAILINGS REPROCESSING CURRENT AND FUTURE END USER ANALYSIS, 2025–2034, (USD MILLION)
FIGURE 114 SAUDI ARABIA GOLD TAILINGS REPROCESSING CURRENT AND FUTURE TYPE ANALYSIS, 2025–2034, (USD MILLION)
FIGURE 115 SAUDI ARABIA GOLD TAILINGS REPROCESSING CURRENT AND FUTURE END USER ANALYSIS, 2025–2034, (USD MILLION)
FIGURE 116 UAE GOLD TAILINGS REPROCESSING CURRENT AND FUTURE TYPE ANALYSIS, 2025–2034, (USD MILLION)
FIGURE 117 UAE GOLD TAILINGS REPROCESSING CURRENT AND FUTURE END USER ANALYSIS, 2025–2034, (USD MILLION)
FIGURE 118 BAHRAIN GOLD TAILINGS REPROCESSING CURRENT AND FUTURE TYPE ANALYSIS, 2025–2034, (USD MILLION)
FIGURE 119 BAHRAIN GOLD TAILINGS REPROCESSING CURRENT AND FUTURE END USER ANALYSIS, 2025–2034, (USD MILLION)
FIGURE 120 KUWAIT GOLD TAILINGS REPROCESSING CURRENT AND FUTURE TYPE ANALYSIS, 2025–2034, (USD MILLION)
FIGURE 121 KUWAIT GOLD TAILINGS REPROCESSING CURRENT AND FUTURE END USER ANALYSIS, 2025–2034, (USD MILLION)
FIGURE 122 OMAN GOLD TAILINGS REPROCESSING CURRENT AND FUTURE TYPE ANALYSIS, 2025–2034, (USD MILLION)
FIGURE 123 OMAN GOLD TAILINGS REPROCESSING CURRENT AND FUTURE END USER ANALYSIS, 2025–2034, (USD MILLION)
FIGURE 124 QATAR GOLD TAILINGS REPROCESSING CURRENT AND FUTURE TYPE ANALYSIS, 2025–2034, (USD MILLION)
FIGURE 125 QATAR GOLD TAILINGS REPROCESSING CURRENT AND FUTURE END USER ANALYSIS, 2025–2034, (USD MILLION)
FIGURE 126 EGYPT GOLD TAILINGS REPROCESSING CURRENT AND FUTURE TYPE ANALYSIS, 2025–2034, (USD MILLION)
FIGURE 127 EGYPT GOLD TAILINGS REPROCESSING CURRENT AND FUTURE END USER ANALYSIS, 2025–2034, (USD MILLION)
FIGURE 128 NIGERIA GOLD TAILINGS REPROCESSING CURRENT AND FUTURE TYPE ANALYSIS, 2025–2034, (USD MILLION)
FIGURE 129 NIGERIA GOLD TAILINGS REPROCESSING CURRENT AND FUTURE END USER ANALYSIS, 2025–2034, (USD MILLION)
FIGURE 130 SOUTH AFRICA GOLD TAILINGS REPROCESSING CURRENT AND FUTURE TYPE ANALYSIS, 2025–2034, (USD MILLION)
FIGURE 131 SOUTH AFRICA GOLD TAILINGS REPROCESSING CURRENT AND FUTURE END USER ANALYSIS, 2025–2034, (USD MILLION)
FIGURE 132 ISRAEL GOLD TAILINGS REPROCESSING CURRENT AND FUTURE TYPE ANALYSIS, 2025–2034, (USD MILLION)
FIGURE 133 ISRAEL GOLD TAILINGS REPROCESSING CURRENT AND FUTURE END USER ANALYSIS, 2025–2034, (USD MILLION)
FIGURE 134 REST OF MEA GOLD TAILINGS REPROCESSING CURRENT AND FUTURE TYPE ANALYSIS, 2025–2034, (USD MILLION)
FIGURE 135 REST OF MEA GOLD TAILINGS REPROCESSING CURRENT AND FUTURE END USER ANALYSIS, 2025–2034, (USD MILLION)
FIGURE 136 U. S. MARKET SHARE ANALYSIS BY TYPE (2024)
FIGURE 137 U. S. MARKET SHARE ANALYSIS BY END USER (2024)
FIGURE 138 CANADA MARKET SHARE ANALYSIS BY TYPE (2024)
FIGURE 139 CANADA MARKET SHARE ANALYSIS BY END USER (2024)
FIGURE 140 MEXICO MARKET SHARE ANALYSIS BY TYPE (2024)
FIGURE 141 MEXICO MARKET SHARE ANALYSIS BY END USER (2024)
FIGURE 142 CHINA MARKET SHARE ANALYSIS BY TYPE (2024)
FIGURE 143 CHINA MARKET SHARE ANALYSIS BY END USER (2024)
FIGURE 144 JAPAN MARKET SHARE ANALYSIS BY TYPE (2024)
FIGURE 145 JAPAN MARKET SHARE ANALYSIS BY END USER (2024)
FIGURE 146 INDIA MARKET SHARE ANALYSIS BY TYPE (2024)
FIGURE 147 INDIA MARKET SHARE ANALYSIS BY END USER (2024)
FIGURE 148 SOUTH KOREA MARKET SHARE ANALYSIS BY TYPE (2024)
FIGURE 149 SOUTH KOREA MARKET SHARE ANALYSIS BY END USER (2024)
FIGURE 150 SAUDI ARABIA MARKET SHARE ANALYSIS BY TYPE (2024)
FIGURE 151 SAUDI ARABIA MARKET SHARE ANALYSIS BY END USER (2024)
FIGURE 152 UAE MARKET SHARE ANALYSIS BY TYPE (2024)
FIGURE 153 UAE MARKET SHARE ANALYSIS BY END USER (2024)
FIGURE 154 EGYPT MARKET SHARE ANALYSIS BY TYPE (2024)
FIGURE 155 EGYPT MARKET SHARE ANALYSIS BY END USER (2024)
FIGURE 156 NIGERIA MARKET SHARE ANALYSIS BY TYPE (2024)
FIGURE 157 NIGERIA MARKET SHARE ANALYSIS BY END USER (2024)
FIGURE 158 SOUTH AFRICA MARKET SHARE ANALYSIS BY TYPE (2024)
FIGURE 159 SOUTH AFRICA MARKET SHARE ANALYSIS BY END USER (2024)
FIGURE 160 GERMANY MARKET SHARE ANALYSIS BY TYPE (2024)
FIGURE 161 GERMANY MARKET SHARE ANALYSIS BY END USER (2024)
FIGURE 162 FRANCE MARKET SHARE ANALYSIS BY TYPE (2024)
FIGURE 163 FRANCE MARKET SHARE ANALYSIS BY END USER (2024)
FIGURE 164 UK MARKET SHARE ANALYSIS BY TYPE (2024)
FIGURE 165 UK MARKET SHARE ANALYSIS BY END USER (2024)
FIGURE 166 SPAIN MARKET SHARE ANALYSIS BY TYPE (2024)
FIGURE 167 SPAIN MARKET SHARE ANALYSIS BY END USER (2024)
FIGURE 168 ITALY MARKET SHARE ANALYSIS BY TYPE (2024)
FIGURE 169 ITALY MARKET SHARE ANALYSIS BY END USER (2024)
FIGURE 170 BRAZIL MARKET SHARE ANALYSIS BY TYPE (2024)
FIGURE 171 BRAZIL MARKET SHARE ANALYSIS BY END USER (2024)
FIGURE 172 ARGENTINA MARKET SHARE ANALYSIS BY TYPE (2024)
FIGURE 173 ARGENTINA MARKET SHARE ANALYSIS BY END USER (2024)
FIGURE 174 COLUMBIA MARKET SHARE ANALYSIS BY TYPE (2024)
FIGURE 175 COLUMBIA MARKET SHARE ANALYSIS BY END USER (2024)
FIGURE 176 GLOBAL GOLD TAILINGS REPROCESSING CURRENT AND FUTURE MARKET KEY COUNTRY LEVEL ANALYSIS, 2024–2034, (USD MILLION)
FIGURE 177 FINANCIAL OVERVIEW:
Key Players Analysis
AngloGold Ashanti: A global gold mining company with operations mainly in Africa, Australia, and the Americas, AngloGold Ashanti focuses on responsible mining and evaluates opportunities to reprocess tailings for remaining gold and environmental closure.
Barrick Gold Corporation: A leading gold and copper producer, Barrick emphasizes responsible mining practices, which include assessing and implementing solutions for tailings management and potential reprocessing to extract remaining value.
Gold Fields Limited: A globally diversified gold producer, Gold Fields prioritizes sustainable mining practices, including exploring technologies and projects for tailings reprocessing to improve resource recovery and lessen environmental impact.
Kinross Gold Corporation: A senior gold mining company with operations in the Americas and West Africa, Kinross is dedicated to responsible environmental stewardship, evaluating and implementing modern tailings management and reprocessing solutions.
Newmont Corporation: As the world’s largest gold mining company, Newmont actively explores and executes tailings management and reprocessing strategies as part of its sustainability and resource optimization efforts across its global operations.
EnviroGold Global Limited: A clean technology company focused on repurposing mine waste to recover precious, critical, and strategic metals, emphasizing sustainable and environmentally responsible solutions for tailings reprocessing.
Key Market Players
AngloGold Ashanti
Barrick Gold Corporation
Gold Fields Limited
Kinross Gold Corporation
Newmont Corporation
Pan African Resources PLC
Sibanye-Stillwater Limited
BHP GROUP LTD
RIO TINTO.
SHANDONG XINHAI MINING TECHNOLOGY & EQUIPMENT INC
DRD GOLD
1911 GOLD CORPORATION
METSO
FRASER ALEXANDER (PTY) LTD
POLYMETAL INTERNATIONAL PLC
EnviroGold
BacTech
SGS SA
Drivers
Environmental liability management and ESG mandates:
As global environmental regulations tighten, mining firms face increasing pressure to manage the long-term impacts of tailings storage. Reprocessing provides a proactive way to meet environmental standards while recovering lost value.
Restraints
High capital expenditure and technical uncertainty:
The need for upfront investment in site-specific technology solutions, combined with variable ore grades in tailings, can make financial returns unpredictable, especially for junior miners.
Opportunities
Critical mineral recovery and circular mining initiatives:
With governments increasingly supporting the recovery of strategic minerals for green technology, tailings sites are being evaluated for rare earths, cobalt, and lithium. This creates new commercial opportunities.
Trends
Digital and AI-driven tailings evaluation:
Using AI, geospatial mapping, and remote sensing to assess tailings mineral content is changing how companies identify viable reprocessing projects and minimize exploration risk.
Recent Developments
May 2025 – DRDGold launched a USD 120 million expansion to its Far West Gold Recoveries project in South Africa, aiming to boost daily throughput by 35%.
April 2025 – EnviroGold Global announced successful pilot results using its patented EcoTail process at a legacy tailings site in Peru.
March 2025 – Gold Fields partnered with a renewable energy firm to power its new tailings retreatment facility in Ghana with 100% solar energy.
February 2025 – BacTech Environmental began construction of a bioleaching facility in Ecuador to extract gold and arsenic from legacy tailings while neutralizing toxicity.
January 2025 – SGS SA introduced a cloud-based tailings mineral analysis platform, using AI to improve economic modeling and risk assessment.

 Aerospace And Defence
 Agriculture
 Automotive And Transportation
 Banking And Finance
 Business
 Chemicals And Materials
 Consumer And Retail
 Electronics And Semiconductors
 Food And Beverages
 Machinery & Equipments
 Manufacturing And Construction
 Medical Devices
 Others
 Pharmaceuticals And Healthcare
 Power And Energy
 Sports
 Technology

 Technology (Cyanide Leaching, Flotation, Gravity Separation, Bioleaching, Others) Solution (Service, Equipment, Others) Application (Glod Mining Companies, Construction Companies, Environmental Remediation, Others) Industry Region & Key Players-Industry Segment Overview, Market Dynamics, Competitive Strategies, Trends & Forecast 2025-2034")
 Technology (Cyanide Leaching, Flotation, Gravity Separation, Bioleaching, Others) Solution (Service, Equipment, Others) Application (Glod Mining Companies, Construction Companies, Environmental Remediation, Others) Industry Region & Key Players-Industry Segment Overview, Market Dynamics, Competitive Strategies, Trends & Forecast 2025-2034")
 Technology (Cyanide Leaching, Flotation, Gravity Separation, Bioleaching, Others) Solution (Service, Equipment, Others) Application (Glod Mining Companies, Construction Companies, Environmental Remediation, Others) Industry Region & Key Players-Industry Segment Overview, Market Dynamics, Competitive Strategies, Trends & Forecast 2025-2034")
 Technology (Cyanide Leaching, Flotation, Gravity Separation, Bioleaching, Others) Solution (Service, Equipment, Others) Application (Glod Mining Companies, Construction Companies, Environmental Remediation, Others) Industry Region & Key Players-Industry Segment Overview, Market Dynamics, Competitive Strategies, Trends & Forecast 2025-2034")

