Global Golf Cart and NEV Market Size & Forecast 2024–2034 | 9.3% CAGR
Global Golf Cart and Neighborhood Electric Vehicle (NEV) Market Size, Share & Industry Analysis By Product Type (Golf Carts, Neighborhood Electric Vehicles), By Battery Type (Lead-Acid, Lithium-Ion), By Application (Golf Courses, Residential Communities, Commercial Use, Campuses & Parks), By End-User (Hospitality, Corporate Campuses, Municipal Fleets), Regional Outlook, Competitive Landscape, Market Trends & Forecast 2025–2034
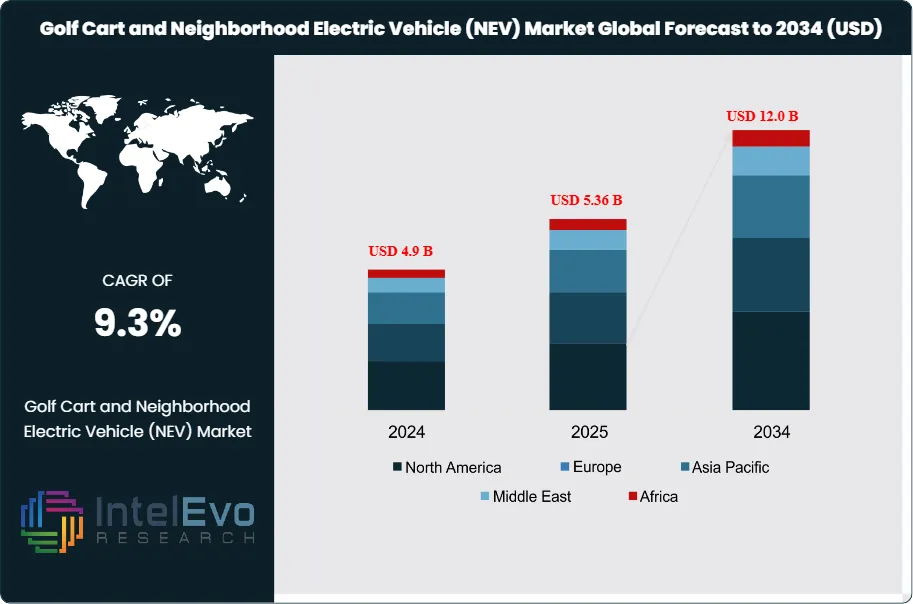
The Golf Cart and Neighborhood Electric Vehicle (NEV) Market was valued at USD 4.9 Billion in 2024 and is projected to reach approximately USD 12.0 Billion by 2034. The market is estimated to grow to around USD 5.36 Billion in 2025. Based on projected expansion from 2026 onward, the industry is expected to register a compound annual growth rate (CAGR) of approximately 9.3% during 2026–2034.
The market spans vehicle sales, fleet programs, parts, battery packs, charging hardware, and aftersales service. Golf carts continue to anchor volumes in golf, hospitality, and gated communities, while road-legal NEVs expand the addressable market through access to designated low-speed public roads and planned mobility zones.
Demand growth reflects a clear shift from single-use recreation to everyday utility. In mature retirement and master-planned communities, adoption has moved from convenience to default mobility, with more than 50,000 carts and low-speed vehicles operating in The Villages and residents using them for about 80% of local trips. Commercial buyers now drive a larger share of incremental demand through campus logistics, industrial transport, and last-mile delivery trials. Electric models already dominate the mix, with electric golf carts accounting for over 85% of sales in 2022, supported by 30–40% lower ownership costs versus gas alternatives and demand uplift of about 30% during periods of higher fuel prices.
On the supply side, scale players and specialist manufacturers compete through platform upgrades, premium features, and battery performance. Textron’s Specialized Vehicles business reported nearly USD 1.7 billion in revenue in 2022, while E-Z-GO production exceeded 143,000 units from 2021 to early 2023; Yamaha produced around 44,000 units and generated about USD 350 million in 2022. Product differentiation increasingly centers on road compliance, safety content, and comfort. Luxury and performance positioning also rises, illustrated by a road-legal cart developed with Garia that pairs a 10.24 kWh lithium-ion pack with up to 80 km range and region-specific top-speed limits.
Regulation shapes market access and risk. NEV and low-speed vehicle rules set speed caps, lighting, braking, and occupant protection requirements, but fragmented city and state policies create compliance complexity and liability exposure. Battery input costs, warranty reserves, and charging availability remain key downside risks. Technology offsets these pressures. Telematics, geofencing, and app-based fleet control accelerate digitization, while AI-enabled diagnostics and predictive maintenance reduce downtime for commercial fleets. North America is expected to retain roughly 45% of revenue, with investment hotspots in community mobility corridors and resort clusters; Europe benefits from low-emission zones; Asia-Pacific shows faster growth in industrial parks and tourism-led development.
Key Takeaways
Market Growth: The market expands from 4.5 billion USD, 2023 to 10.8 billion USD, 2033 and sustains 9.1% CAGR, 2024-2034.
SegmentDominance : Golf carts hold 56.0% share, 2024, supported by high utilization across golf and resort mobility.
Segment Dominance: Golf course applications account for 40.0% share, 2024, driven by routine on-course transport demand.
Driver: Demand rises as buyers prioritize low-emission, low-noise mobility, estimated: 85.0% electric share, 2024.
Restraint: Regulatory limits and road-access constraints cap deployment, estimated: 25.0 mph speed ceiling, 2024.
Opportunity: NEVs gain runway in last-mile delivery and short commutes as range improves, estimated: 80.0 km range, 2024.
Trend: Manufacturers push premium, connected features to lift ASPs, estimated: 10.1 inch infotainment display, 2024.
RegionalAnalysis: North America leads with 40.0% share, 2024, supported by strong recreational and residential adoption.
By Type
Golf carts remain the volume anchor in 2025, holding 56% market share in 2023 and sustaining leadership as courses, resorts, and private communities keep standardizing electric fleets. You see this segment win on simple economics. Operators target lower running costs and quieter operations, and electric models already represented over 85% of sales in 2022. Battery upgrades extend daily utilization and reduce charging downtime, which supports higher fleet turnover and steadier replacement demand.
Neighborhood Electric Vehicles accounted for 44% market share in 2023 and gain faster momentum into 2026 as more jurisdictions formalize low-speed corridors and signage. You see NEVs expand beyond community transport into campus shuttles and controlled last-mile delivery routes because they carry stronger safety content than traditional carts and can legally access select public roads. Market growth also tracks incentive programs for zero-emission mobility and improving lithium-ion pack performance, with premium road-legal models now advertising up to 80 km range on a single charge.
By Application
Golf courses led applications with 40% market share in 2023 and keep their lead through 2025 because cart fleets sit at the core of daily operations. You see course managers shift procurement toward electric platforms to cut fuel exposure and maintenance needs. Total cost of ownership remains a decisive metric, with electric platforms delivering 30% to 40% lower ownership costs versus gas alternatives in typical use profiles.
Residential areas captured 28% market share in 2023 and continue to expand as gated communities and retirement villages treat low-speed mobility as default transport for short trips. You see demand rise where residents rely on carts and NEVs for a high share of local journeys. Commercial use represented 22% market share in 2023, supported by hotels and resorts that prioritize fast guest movement and service logistics. The “others” segment held 10% in 2023 and grows through campuses, parks, and large properties that require frequent intra-site transport.
By End-Use
Residential building end-use gains share as developers design mobility-friendly communities with parking bays, charging points, and dedicated paths. You see this segment favor golf carts for local movement and NEVs where road-legal access applies. Higher electric adoption also supports lower noise and improves neighborhood acceptance in dense developments.
Commercial building end-use tracks hospitality, retail complexes, and institutional campuses that run daily shuttle loops and service operations. You see fleet buyers demand telematics, geofencing, and app-based access control to reduce misuse and improve utilization. Industrial building end-use expands in warehouses, ports, and large plants where low-speed vehicles handle site logistics. Safety compliance and uptime define purchasing, and predictive maintenance reduces stoppages as connected diagnostics becomes standard.
By Region
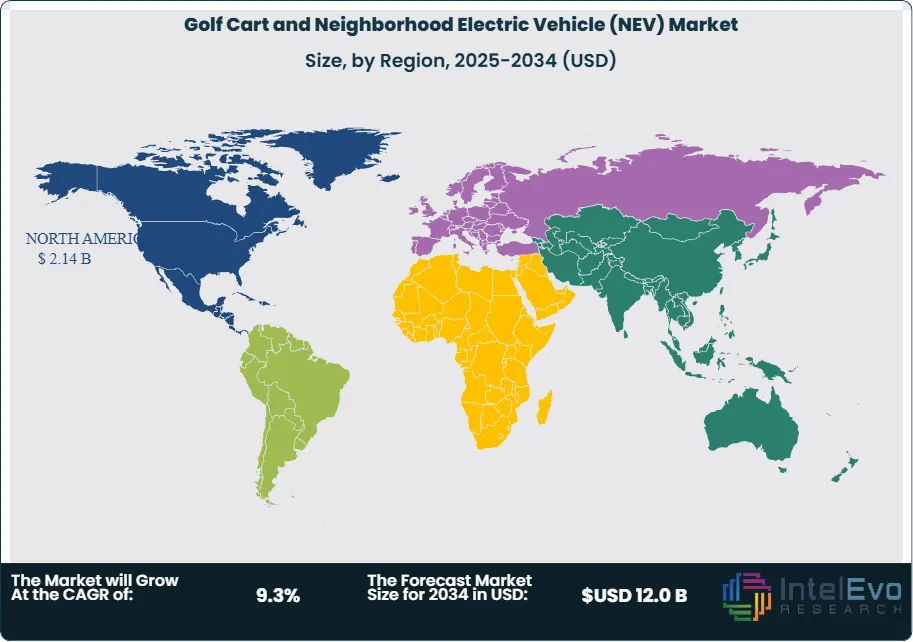
North America leads with about 40% market share in 2023 and remains the largest revenue pool in 2025 due to high golf participation, large retirement communities, and favorable low-speed vehicle rules in many states. You see the United States drive fleet replacements in resorts and master-planned communities, while corporate campuses sustain steady orders. Electrification stays high, supported by established dealer networks and service ecosystems.
Europe accelerates adoption where cities restrict combustion vehicles and promote small electric mobility in controlled zones, estimated: 25% market share, 2025. Asia Pacific shows faster unit growth as tourism assets expand and industrial parks scale internal transport, estimated: 23% market share, 2025. Latin America and the Middle East and Africa remain earlier-stage markets but gain traction in resorts and large commercial properties, estimated: 7% market share, 2025 and estimated: 5% market share, 2025. You should expect uneven policy enforcement and charging availability to shape near-term outcomes across these emerging regions.
By Product Type, Golf Carts, Neighborhood Electric Vehicles (NEVs), By Application, Golf Courses, Residential Areas, Commercial Use (hotels, resorts, etc.), Others (e.g., campuses, parks)
Research Methodology
Primary Research- 100 Interviews of Stakeholders
Secondary Research
Desk Research
Regional scope
North America (United States, Canada, Mexico)
Latin America (Brazil, Argentina, Columbia)
East Asia And Pacific (China, Japan, South Korea, Australia, Cambodia, Fiji, Indonesia)
Sea And South Asia (India, Singapore, Thailand, Taiwan, Malaysia)
Eastern Europe (Poland, Russia, Czech Republic, Romania)
Western Europe (Germany, U.K., France, Spain, Itlay)
Middle East & Africa (GCC Countries, Egypt, Nigeria, South Africa, Israel)
Competitive Landscape
STAR EV, Garia, Yamaha Golf-Car Company, American Custom Golf Cars, Polaris Industries, Bradshaw Electric Vehicles, E-Z-GO (Textron Inc.), Club Car (Ingersoll Rand), Other Key Players
Customization Scope
Customization for segments, region/country-level will be provided. Moreover, additional customization can be done based on the requirements.
Pricing and Purchase Options
Avail customized purchase options to meet your exact research needs. We have three licenses to opt for: Single User License, Multi-User License (Up to 5 Users), Corporate Use License (Unlimited User and Printable PDF).
TABLE OF CONTENTS
1. EXECUTIVE SUMMARY
1.1. MARKET SNAPSHOT
1.2. KEY FINDINGS & INSIGHTS
1.3. ANALYST RECOMMENDATIONS
1.4. FUTURE OUTLOOK
2. RESEARCH METHODOLOGY
2.1. MARKET DEFINITION & SCOPE
2.2. RESEARCH OBJECTIVES: PRIMARY & SECONDARY DATA SOURCES
2.3. DATA COLLECTION SOURCES
2.3.1. COVERAGE OF 100+ PRIMARY RESEARCH/CONSULTATION CALLS WITH INDUSTRY STAKEHOLDERS
FIGURE 17 NORTH AMERICA GOLF CART AND NEIGHBORHOOD ELECTRIC VEHICLE (NEV)CURRENT AND FUTURE TYPE ANALYSIS, 2025–2034, (USD MILLION)
FIGURE 18 NORTH AMERICA GOLF CART AND NEIGHBORHOOD ELECTRIC VEHICLE (NEV)CURRENT AND FUTURE END USER ANALYSIS, 2025–2034, (USD MILLION)
FIGURE 19 MARKET SHARE BY COUNTRY
FIGURE 20 LATIN AMERICA GOLF CART AND NEIGHBORHOOD ELECTRIC VEHICLE (NEV)CURRENT AND FUTURE TYPE ANALYSIS, 2025–2034, (USD MILLION)
FIGURE 21 LATIN AMERICA GOLF CART AND NEIGHBORHOOD ELECTRIC VEHICLE (NEV)CURRENT AND FUTURE END USER ANALYSIS, 2025–2034, (USD MILLION)
FIGURE 22 MARKET SHARE BY COUNTRY
FIGURE 23 EASTERN EUROPE GOLF CART AND NEIGHBORHOOD ELECTRIC VEHICLE (NEV)CURRENT AND FUTURE TYPE ANALYSIS, 2025–2034, (USD MILLION)
FIGURE 24 EASTERN EUROPE GOLF CART AND NEIGHBORHOOD ELECTRIC VEHICLE (NEV)CURRENT AND FUTURE END USER ANALYSIS, 2025–2034, (USD MILLION)
FIGURE 25 MARKET SHARE BY COUNTRY
FIGURE 26 WESTERN EUROPE GOLF CART AND NEIGHBORHOOD ELECTRIC VEHICLE (NEV)CURRENT AND FUTURE TYPE ANALYSIS, 2025–2034, (USD MILLION)
FIGURE 27 WESTERN EUROPE GOLF CART AND NEIGHBORHOOD ELECTRIC VEHICLE (NEV)CURRENT AND FUTURE END USER ANALYSIS, 2025–2034, (USD MILLION)
FIGURE 28 MARKET SHARE BY COUNTRY
FIGURE 29 EAST ASIA AND PACIFIC GOLF CART AND NEIGHBORHOOD ELECTRIC VEHICLE (NEV)CURRENT AND FUTURE TYPE ANALYSIS, 2025–2034, (USD MILLION)
FIGURE 30 EAST ASIA AND PACIFIC GOLF CART AND NEIGHBORHOOD ELECTRIC VEHICLE (NEV)CURRENT AND FUTURE END USER ANALYSIS, 2025–2034, (USD MILLION)
FIGURE 31 MARKET SHARE BY COUNTRY
FIGURE 32 SEA AND SOUTH ASIA GOLF CART AND NEIGHBORHOOD ELECTRIC VEHICLE (NEV)CURRENT AND FUTURE TYPE ANALYSIS, 2025–2034, (USD MILLION)
FIGURE 33 SEA AND SOUTH ASIA GOLF CART AND NEIGHBORHOOD ELECTRIC VEHICLE (NEV)CURRENT AND FUTURE END USER ANALYSIS, 2025–2034, (USD MILLION)
FIGURE 34 MARKET SHARE BY COUNTRY
FIGURE 35 MIDDLE EAST AND AFRICA GOLF CART AND NEIGHBORHOOD ELECTRIC VEHICLE (NEV)CURRENT AND FUTURE TYPE ANALYSIS, 2025–2034, (USD MILLION)
FIGURE 36 MIDDLE EAST AND AFRICA GOLF CART AND NEIGHBORHOOD ELECTRIC VEHICLE (NEV)CURRENT AND FUTURE END USER ANALYSIS, 2025–2034, (USD MILLION)
FIGURE 37 NORTH AMERICA GOLF CART AND NEIGHBORHOOD ELECTRIC VEHICLE (NEV)CURRENT AND FUTURE MARKET VOLUME SHARE REGIONAL ANALYSIS, 2025–2034, (USD MILLION)
FIGURE 38 U.S. GOLF CART AND NEIGHBORHOOD ELECTRIC VEHICLE (NEV)CURRENT AND FUTURE TYPE ANALYSIS, 2025–2034, (USD MILLION)
FIGURE 39 U.S. GOLF CART AND NEIGHBORHOOD ELECTRIC VEHICLE (NEV)CURRENT AND FUTURE END USER ANALYSIS, 2025–2034, (USD MILLION)
FIGURE 40 CANADA GOLF CART AND NEIGHBORHOOD ELECTRIC VEHICLE (NEV)CURRENT AND FUTURE TYPE ANALYSIS, 2025–2034, (USD MILLION)
FIGURE 41 CANADA GOLF CART AND NEIGHBORHOOD ELECTRIC VEHICLE (NEV)CURRENT AND FUTURE END USER ANALYSIS, 2025–2034, (USD MILLION)
FIGURE 42 LATIN AMERICA GOLF CART AND NEIGHBORHOOD ELECTRIC VEHICLE (NEV)CURRENT AND FUTURE MARKET VOLUME SHARE REGIONAL ANALYSIS, 2025–2034, (USD MILLION)
FIGURE 43 MEXICO GOLF CART AND NEIGHBORHOOD ELECTRIC VEHICLE (NEV)CURRENT AND FUTURE TYPE ANALYSIS, 2025–2034, (USD MILLION)
FIGURE 44 MEXICO GOLF CART AND NEIGHBORHOOD ELECTRIC VEHICLE (NEV)CURRENT AND FUTURE END USER ANALYSIS, 2025–2034, (USD MILLION)
FIGURE 45 BRAZIL GOLF CART AND NEIGHBORHOOD ELECTRIC VEHICLE (NEV)CURRENT AND FUTURE TYPE ANALYSIS, 2025–2034, (USD MILLION)
FIGURE 46 BRAZIL GOLF CART AND NEIGHBORHOOD ELECTRIC VEHICLE (NEV)CURRENT AND FUTURE END USER ANALYSIS, 2025–2034, (USD MILLION)
FIGURE 47 ARGENTINA GOLF CART AND NEIGHBORHOOD ELECTRIC VEHICLE (NEV)CURRENT AND FUTURE TYPE ANALYSIS, 2025–2034, (USD MILLION)
FIGURE 48 ARGENTINA GOLF CART AND NEIGHBORHOOD ELECTRIC VEHICLE (NEV)CURRENT AND FUTURE END USER ANALYSIS, 2025–2034, (USD MILLION)
FIGURE 49 COLUMBIA GOLF CART AND NEIGHBORHOOD ELECTRIC VEHICLE (NEV)CURRENT AND FUTURE TYPE ANALYSIS, 2025–2034, (USD MILLION)
FIGURE 50 COLUMBIA GOLF CART AND NEIGHBORHOOD ELECTRIC VEHICLE (NEV)CURRENT AND FUTURE END USER ANALYSIS, 2025–2034, (USD MILLION)
FIGURE 51 REST OF LATIN AMERICA GOLF CART AND NEIGHBORHOOD ELECTRIC VEHICLE (NEV)CURRENT AND FUTURE TYPE ANALYSIS, 2025–2034, (USD MILLION)
FIGURE 52 REST OF LATIN AMERICA GOLF CART AND NEIGHBORHOOD ELECTRIC VEHICLE (NEV)CURRENT AND FUTURE END USER ANALYSIS, 2025–2034, (USD MILLION)
FIGURE 53 EASTERN EUROPE GOLF CART AND NEIGHBORHOOD ELECTRIC VEHICLE (NEV)CURRENT AND FUTURE MARKET VOLUME SHARE REGIONAL ANALYSIS, 2025–2034, (USD MILLION)
FIGURE 54 POLAND GOLF CART AND NEIGHBORHOOD ELECTRIC VEHICLE (NEV)CURRENT AND FUTURE TYPE ANALYSIS, 2025–2034, (USD MILLION)
FIGURE 55 POLAND GOLF CART AND NEIGHBORHOOD ELECTRIC VEHICLE (NEV)CURRENT AND FUTURE END USER ANALYSIS, 2025–2034, (USD MILLION)
FIGURE 56 RUSSIA GOLF CART AND NEIGHBORHOOD ELECTRIC VEHICLE (NEV)CURRENT AND FUTURE TYPE ANALYSIS, 2025–2034, (USD MILLION)
FIGURE 57 RUSSIA GOLF CART AND NEIGHBORHOOD ELECTRIC VEHICLE (NEV)CURRENT AND FUTURE END USER ANALYSIS, 2025–2034, (USD MILLION)
FIGURE 58 CZECH REPUBLIC GOLF CART AND NEIGHBORHOOD ELECTRIC VEHICLE (NEV)CURRENT AND FUTURE TYPE ANALYSIS, 2025–2034, (USD MILLION)
FIGURE 59 CZECH REPUBLIC GOLF CART AND NEIGHBORHOOD ELECTRIC VEHICLE (NEV)CURRENT AND FUTURE END USER ANALYSIS, 2025–2034, (USD MILLION)
FIGURE 60 ROMANIA GOLF CART AND NEIGHBORHOOD ELECTRIC VEHICLE (NEV)CURRENT AND FUTURE TYPE ANALYSIS, 2025–2034, (USD MILLION)
FIGURE 61 ROMANIA GOLF CART AND NEIGHBORHOOD ELECTRIC VEHICLE (NEV)CURRENT AND FUTURE END USER ANALYSIS, 2025–2034, (USD MILLION)
FIGURE 62 REST OF EASTERN EUROPE GOLF CART AND NEIGHBORHOOD ELECTRIC VEHICLE (NEV)CURRENT AND FUTURE TYPE ANALYSIS, 2025–2034, (USD MILLION)
FIGURE 63 REST OF EASTERN EUROPE GOLF CART AND NEIGHBORHOOD ELECTRIC VEHICLE (NEV)CURRENT AND FUTURE END USER ANALYSIS, 2025–2034, (USD MILLION)
FIGURE 64 WESTERN EUROPE GOLF CART AND NEIGHBORHOOD ELECTRIC VEHICLE (NEV)CURRENT AND FUTURE MARKET VOLUME SHARE REGIONAL ANALYSIS, 2025–2034, (USD MILLION)
FIGURE 65 GERMANY GOLF CART AND NEIGHBORHOOD ELECTRIC VEHICLE (NEV)CURRENT AND FUTURE TYPE ANALYSIS, 2025–2034, (USD MILLION)
FIGURE 66 GERMANY GOLF CART AND NEIGHBORHOOD ELECTRIC VEHICLE (NEV)CURRENT AND FUTURE END USER ANALYSIS, 2025–2034, (USD MILLION)
FIGURE 67 FRANCE GOLF CART AND NEIGHBORHOOD ELECTRIC VEHICLE (NEV)CURRENT AND FUTURE TYPE ANALYSIS, 2025–2034, (USD MILLION)
FIGURE 68 FRANCE GOLF CART AND NEIGHBORHOOD ELECTRIC VEHICLE (NEV)CURRENT AND FUTURE END USER ANALYSIS, 2025–2034, (USD MILLION)
FIGURE 69 UK GOLF CART AND NEIGHBORHOOD ELECTRIC VEHICLE (NEV)CURRENT AND FUTURE TYPE ANALYSIS, 2025–2034, (USD MILLION)
FIGURE 70 UK GOLF CART AND NEIGHBORHOOD ELECTRIC VEHICLE (NEV)CURRENT AND FUTURE END USER ANALYSIS, 2025–2034, (USD MILLION)
FIGURE 71 SPAIN GOLF CART AND NEIGHBORHOOD ELECTRIC VEHICLE (NEV)CURRENT AND FUTURE TYPE ANALYSIS, 2025–2034, (USD MILLION)
FIGURE 72 SPAIN GOLF CART AND NEIGHBORHOOD ELECTRIC VEHICLE (NEV)CURRENT AND FUTURE END USER ANALYSIS, 2025–2034, (USD MILLION)
FIGURE 73 ITALY GOLF CART AND NEIGHBORHOOD ELECTRIC VEHICLE (NEV)CURRENT AND FUTURE TYPE ANALYSIS, 2025–2034, (USD MILLION)
FIGURE 74 ITALY GOLF CART AND NEIGHBORHOOD ELECTRIC VEHICLE (NEV)CURRENT AND FUTURE END USER ANALYSIS, 2025–2034, (USD MILLION)
FIGURE 75 REST OF WESTERN EUROPE GOLF CART AND NEIGHBORHOOD ELECTRIC VEHICLE (NEV)CURRENT AND FUTURE TYPE ANALYSIS, 2025–2034, (USD MILLION)
FIGURE 76 REST OF WESTERN EUROPE GOLF CART AND NEIGHBORHOOD ELECTRIC VEHICLE (NEV)CURRENT AND FUTURE END USER ANALYSIS, 2025–2034, (USD MILLION)
FIGURE 77 EAST ASIA AND PACIFIC GOLF CART AND NEIGHBORHOOD ELECTRIC VEHICLE (NEV)CURRENT AND FUTURE MARKET VOLUME SHARE REGIONAL ANALYSIS, 2025–2034, (USD MILLION)
FIGURE 78 CHINA GOLF CART AND NEIGHBORHOOD ELECTRIC VEHICLE (NEV)CURRENT AND FUTURE TYPE ANALYSIS, 2025–2034, (USD MILLION)
FIGURE 79 CHINA GOLF CART AND NEIGHBORHOOD ELECTRIC VEHICLE (NEV)CURRENT AND FUTURE END USER ANALYSIS, 2025–2034, (USD MILLION)
FIGURE 80 JAPAN GOLF CART AND NEIGHBORHOOD ELECTRIC VEHICLE (NEV)CURRENT AND FUTURE TYPE ANALYSIS, 2025–2034, (USD MILLION)
FIGURE 81 JAPAN GOLF CART AND NEIGHBORHOOD ELECTRIC VEHICLE (NEV)CURRENT AND FUTURE END USER ANALYSIS, 2025–2034, (USD MILLION)
FIGURE 82 AUSTRALIA GOLF CART AND NEIGHBORHOOD ELECTRIC VEHICLE (NEV)CURRENT AND FUTURE TYPE ANALYSIS, 2025–2034, (USD MILLION)
FIGURE 83 AUSTRALIA GOLF CART AND NEIGHBORHOOD ELECTRIC VEHICLE (NEV)CURRENT AND FUTURE END USER ANALYSIS, 2025–2034, (USD MILLION)
FIGURE 84 CAMBODIA GOLF CART AND NEIGHBORHOOD ELECTRIC VEHICLE (NEV)CURRENT AND FUTURE TYPE ANALYSIS, 2025–2034, (USD MILLION)
FIGURE 85 CAMBODIA GOLF CART AND NEIGHBORHOOD ELECTRIC VEHICLE (NEV)CURRENT AND FUTURE END USER ANALYSIS, 2025–2034, (USD MILLION)
FIGURE 86 FIJI GOLF CART AND NEIGHBORHOOD ELECTRIC VEHICLE (NEV)CURRENT AND FUTURE TYPE ANALYSIS, 2025–2034, (USD MILLION)
FIGURE 87 FIJI GOLF CART AND NEIGHBORHOOD ELECTRIC VEHICLE (NEV)CURRENT AND FUTURE END USER ANALYSIS, 2025–2034, (USD MILLION)
FIGURE 88 INDONESIA GOLF CART AND NEIGHBORHOOD ELECTRIC VEHICLE (NEV)CURRENT AND FUTURE TYPE ANALYSIS, 2025–2034, (USD MILLION)
FIGURE 89 INDONESIA GOLF CART AND NEIGHBORHOOD ELECTRIC VEHICLE (NEV)CURRENT AND FUTURE END USER ANALYSIS, 2025–2034, (USD MILLION)
FIGURE 90 SOUTH KOREA GOLF CART AND NEIGHBORHOOD ELECTRIC VEHICLE (NEV)CURRENT AND FUTURE TYPE ANALYSIS, 2025–2034, (USD MILLION)
FIGURE 91 SOUTH KOREA GOLF CART AND NEIGHBORHOOD ELECTRIC VEHICLE (NEV)CURRENT AND FUTURE END USER ANALYSIS, 2025–2034, (USD MILLION)
FIGURE 92 REST OF EAST ASIA AND PACIFIC GOLF CART AND NEIGHBORHOOD ELECTRIC VEHICLE (NEV)CURRENT AND FUTURE TYPE ANALYSIS, 2025–2034, (USD MILLION)
FIGURE 93 REST OF EAST ASIA AND PACIFIC GOLF CART AND NEIGHBORHOOD ELECTRIC VEHICLE (NEV)CURRENT AND FUTURE END USER ANALYSIS, 2025–2034, (USD MILLION)
FIGURE 94 SEA AND SOUTH ASIA GOLF CART AND NEIGHBORHOOD ELECTRIC VEHICLE (NEV)CURRENT AND FUTURE MARKET VOLUME SHARE REGIONAL ANALYSIS, 2025–2034, (USD MILLION)
FIGURE 95 BANGLADESH GOLF CART AND NEIGHBORHOOD ELECTRIC VEHICLE (NEV)CURRENT AND FUTURE TYPE ANALYSIS, 2025–2034, (USD MILLION)
FIGURE 96 BANGLADESH GOLF CART AND NEIGHBORHOOD ELECTRIC VEHICLE (NEV)CURRENT AND FUTURE END USER ANALYSIS, 2025–2034, (USD MILLION)
FIGURE 97 NEW ZEALAND GOLF CART AND NEIGHBORHOOD ELECTRIC VEHICLE (NEV)CURRENT AND FUTURE TYPE ANALYSIS, 2025–2034, (USD MILLION)
FIGURE 98 NEW ZEALAND GOLF CART AND NEIGHBORHOOD ELECTRIC VEHICLE (NEV)CURRENT AND FUTURE END USER ANALYSIS, 2025–2034, (USD MILLION)
FIGURE 99 INDIA GOLF CART AND NEIGHBORHOOD ELECTRIC VEHICLE (NEV)CURRENT AND FUTURE TYPE ANALYSIS, 2025–2034, (USD MILLION)
FIGURE 100 INDIA GOLF CART AND NEIGHBORHOOD ELECTRIC VEHICLE (NEV)CURRENT AND FUTURE END USER ANALYSIS, 2025–2034, (USD MILLION)
FIGURE 101 SINGAPORE GOLF CART AND NEIGHBORHOOD ELECTRIC VEHICLE (NEV)CURRENT AND FUTURE TYPE ANALYSIS, 2025–2034, (USD MILLION)
FIGURE 102 SINGAPORE GOLF CART AND NEIGHBORHOOD ELECTRIC VEHICLE (NEV)CURRENT AND FUTURE END USER ANALYSIS, 2025–2034, (USD MILLION)
FIGURE 103 THAILAND GOLF CART AND NEIGHBORHOOD ELECTRIC VEHICLE (NEV)CURRENT AND FUTURE TYPE ANALYSIS, 2025–2034, (USD MILLION)
FIGURE 104 THAILAND GOLF CART AND NEIGHBORHOOD ELECTRIC VEHICLE (NEV)CURRENT AND FUTURE END USER ANALYSIS, 2025–2034, (USD MILLION)
FIGURE 105 TAIWAN GOLF CART AND NEIGHBORHOOD ELECTRIC VEHICLE (NEV)CURRENT AND FUTURE TYPE ANALYSIS, 2025–2034, (USD MILLION)
FIGURE 106 TAIWAN GOLF CART AND NEIGHBORHOOD ELECTRIC VEHICLE (NEV)CURRENT AND FUTURE END USER ANALYSIS, 2025–2034, (USD MILLION)
FIGURE 107 MALAYSIA GOLF CART AND NEIGHBORHOOD ELECTRIC VEHICLE (NEV)CURRENT AND FUTURE TYPE ANALYSIS, 2025–2034, (USD MILLION)
FIGURE 108 MALAYSIA GOLF CART AND NEIGHBORHOOD ELECTRIC VEHICLE (NEV)CURRENT AND FUTURE END USER ANALYSIS, 2025–2034, (USD MILLION)
FIGURE 109 REST OF SEA AND SOUTH ASIA GOLF CART AND NEIGHBORHOOD ELECTRIC VEHICLE (NEV)CURRENT AND FUTURE TYPE ANALYSIS, 2025–2034, (USD MILLION)
FIGURE 110 REST OF SEA AND SOUTH ASIA GOLF CART AND NEIGHBORHOOD ELECTRIC VEHICLE (NEV)CURRENT AND FUTURE END USER ANALYSIS, 2025–2034, (USD MILLION)
FIGURE 111 MIDDLE EAST AND AFRICA GOLF CART AND NEIGHBORHOOD ELECTRIC VEHICLE (NEV)CURRENT AND FUTURE MARKET VOLUME SHARE REGIONAL ANALYSIS, 2025–2034, (USD MILLION)
FIGURE 112 GCC COUNTRIES GOLF CART AND NEIGHBORHOOD ELECTRIC VEHICLE (NEV)CURRENT AND FUTURE TYPE ANALYSIS, 2025–2034, (USD MILLION)
FIGURE 113 GCC COUNTRIES GOLF CART AND NEIGHBORHOOD ELECTRIC VEHICLE (NEV)CURRENT AND FUTURE END USER ANALYSIS, 2025–2034, (USD MILLION)
FIGURE 114 SAUDI ARABIA GOLF CART AND NEIGHBORHOOD ELECTRIC VEHICLE (NEV)CURRENT AND FUTURE TYPE ANALYSIS, 2025–2034, (USD MILLION)
FIGURE 115 SAUDI ARABIA GOLF CART AND NEIGHBORHOOD ELECTRIC VEHICLE (NEV)CURRENT AND FUTURE END USER ANALYSIS, 2025–2034, (USD MILLION)
FIGURE 116 UAE GOLF CART AND NEIGHBORHOOD ELECTRIC VEHICLE (NEV)CURRENT AND FUTURE TYPE ANALYSIS, 2025–2034, (USD MILLION)
FIGURE 117 UAE GOLF CART AND NEIGHBORHOOD ELECTRIC VEHICLE (NEV)CURRENT AND FUTURE END USER ANALYSIS, 2025–2034, (USD MILLION)
FIGURE 118 BAHRAIN GOLF CART AND NEIGHBORHOOD ELECTRIC VEHICLE (NEV)CURRENT AND FUTURE TYPE ANALYSIS, 2025–2034, (USD MILLION)
FIGURE 119 BAHRAIN GOLF CART AND NEIGHBORHOOD ELECTRIC VEHICLE (NEV)CURRENT AND FUTURE END USER ANALYSIS, 2025–2034, (USD MILLION)
FIGURE 120 KUWAIT GOLF CART AND NEIGHBORHOOD ELECTRIC VEHICLE (NEV)CURRENT AND FUTURE TYPE ANALYSIS, 2025–2034, (USD MILLION)
FIGURE 121 KUWAIT GOLF CART AND NEIGHBORHOOD ELECTRIC VEHICLE (NEV)CURRENT AND FUTURE END USER ANALYSIS, 2025–2034, (USD MILLION)
FIGURE 122 OMAN GOLF CART AND NEIGHBORHOOD ELECTRIC VEHICLE (NEV)CURRENT AND FUTURE TYPE ANALYSIS, 2025–2034, (USD MILLION)
FIGURE 123 OMAN GOLF CART AND NEIGHBORHOOD ELECTRIC VEHICLE (NEV)CURRENT AND FUTURE END USER ANALYSIS, 2025–2034, (USD MILLION)
FIGURE 124 QATAR GOLF CART AND NEIGHBORHOOD ELECTRIC VEHICLE (NEV)CURRENT AND FUTURE TYPE ANALYSIS, 2025–2034, (USD MILLION)
FIGURE 125 QATAR GOLF CART AND NEIGHBORHOOD ELECTRIC VEHICLE (NEV)CURRENT AND FUTURE END USER ANALYSIS, 2025–2034, (USD MILLION)
FIGURE 126 EGYPT GOLF CART AND NEIGHBORHOOD ELECTRIC VEHICLE (NEV)CURRENT AND FUTURE TYPE ANALYSIS, 2025–2034, (USD MILLION)
FIGURE 127 EGYPT GOLF CART AND NEIGHBORHOOD ELECTRIC VEHICLE (NEV)CURRENT AND FUTURE END USER ANALYSIS, 2025–2034, (USD MILLION)
FIGURE 128 NIGERIA GOLF CART AND NEIGHBORHOOD ELECTRIC VEHICLE (NEV)CURRENT AND FUTURE TYPE ANALYSIS, 2025–2034, (USD MILLION)
FIGURE 129 NIGERIA GOLF CART AND NEIGHBORHOOD ELECTRIC VEHICLE (NEV)CURRENT AND FUTURE END USER ANALYSIS, 2025–2034, (USD MILLION)
FIGURE 130 SOUTH AFRICA GOLF CART AND NEIGHBORHOOD ELECTRIC VEHICLE (NEV)CURRENT AND FUTURE TYPE ANALYSIS, 2025–2034, (USD MILLION)
FIGURE 131 SOUTH AFRICA GOLF CART AND NEIGHBORHOOD ELECTRIC VEHICLE (NEV)CURRENT AND FUTURE END USER ANALYSIS, 2025–2034, (USD MILLION)
FIGURE 132 ISRAEL GOLF CART AND NEIGHBORHOOD ELECTRIC VEHICLE (NEV)CURRENT AND FUTURE TYPE ANALYSIS, 2025–2034, (USD MILLION)
FIGURE 133 ISRAEL GOLF CART AND NEIGHBORHOOD ELECTRIC VEHICLE (NEV)CURRENT AND FUTURE END USER ANALYSIS, 2025–2034, (USD MILLION)
FIGURE 134 REST OF MEA GOLF CART AND NEIGHBORHOOD ELECTRIC VEHICLE (NEV)CURRENT AND FUTURE TYPE ANALYSIS, 2025–2034, (USD MILLION)
FIGURE 135 REST OF MEA GOLF CART AND NEIGHBORHOOD ELECTRIC VEHICLE (NEV)CURRENT AND FUTURE END USER ANALYSIS, 2025–2034, (USD MILLION)
FIGURE 136 U. S. MARKET SHARE ANALYSIS BY TYPE (2024)
FIGURE 137 U. S. MARKET SHARE ANALYSIS BY END USER (2024)
FIGURE 138 CANADA MARKET SHARE ANALYSIS BY TYPE (2024)
FIGURE 139 CANADA MARKET SHARE ANALYSIS BY END USER (2024)
FIGURE 140 MEXICO MARKET SHARE ANALYSIS BY TYPE (2024)
FIGURE 141 MEXICO MARKET SHARE ANALYSIS BY END USER (2024)
FIGURE 142 CHINA MARKET SHARE ANALYSIS BY TYPE (2024)
FIGURE 143 CHINA MARKET SHARE ANALYSIS BY END USER (2024)
FIGURE 144 JAPAN MARKET SHARE ANALYSIS BY TYPE (2024)
FIGURE 145 JAPAN MARKET SHARE ANALYSIS BY END USER (2024)
FIGURE 146 INDIA MARKET SHARE ANALYSIS BY TYPE (2024)
FIGURE 147 INDIA MARKET SHARE ANALYSIS BY END USER (2024)
FIGURE 148 SOUTH KOREA MARKET SHARE ANALYSIS BY TYPE (2024)
FIGURE 149 SOUTH KOREA MARKET SHARE ANALYSIS BY END USER (2024)
FIGURE 150 SAUDI ARABIA MARKET SHARE ANALYSIS BY TYPE (2024)
FIGURE 151 SAUDI ARABIA MARKET SHARE ANALYSIS BY END USER (2024)
FIGURE 152 UAE MARKET SHARE ANALYSIS BY TYPE (2024)
FIGURE 153 UAE MARKET SHARE ANALYSIS BY END USER (2024)
FIGURE 154 EGYPT MARKET SHARE ANALYSIS BY TYPE (2024)
FIGURE 155 EGYPT MARKET SHARE ANALYSIS BY END USER (2024)
FIGURE 156 NIGERIA MARKET SHARE ANALYSIS BY TYPE (2024)
FIGURE 157 NIGERIA MARKET SHARE ANALYSIS BY END USER (2024)
FIGURE 158 SOUTH AFRICA MARKET SHARE ANALYSIS BY TYPE (2024)
FIGURE 159 SOUTH AFRICA MARKET SHARE ANALYSIS BY END USER (2024)
FIGURE 160 GERMANY MARKET SHARE ANALYSIS BY TYPE (2024)
FIGURE 161 GERMANY MARKET SHARE ANALYSIS BY END USER (2024)
FIGURE 162 FRANCE MARKET SHARE ANALYSIS BY TYPE (2024)
FIGURE 163 FRANCE MARKET SHARE ANALYSIS BY END USER (2024)
FIGURE 164 UK MARKET SHARE ANALYSIS BY TYPE (2024)
FIGURE 165 UK MARKET SHARE ANALYSIS BY END USER (2024)
FIGURE 166 SPAIN MARKET SHARE ANALYSIS BY TYPE (2024)
FIGURE 167 SPAIN MARKET SHARE ANALYSIS BY END USER (2024)
FIGURE 168 ITALY MARKET SHARE ANALYSIS BY TYPE (2024)
FIGURE 169 ITALY MARKET SHARE ANALYSIS BY END USER (2024)
FIGURE 170 BRAZIL MARKET SHARE ANALYSIS BY TYPE (2024)
FIGURE 171 BRAZIL MARKET SHARE ANALYSIS BY END USER (2024)
FIGURE 172 ARGENTINA MARKET SHARE ANALYSIS BY TYPE (2024)
FIGURE 173 ARGENTINA MARKET SHARE ANALYSIS BY END USER (2024)
FIGURE 174 COLUMBIA MARKET SHARE ANALYSIS BY TYPE (2024)
FIGURE 175 COLUMBIA MARKET SHARE ANALYSIS BY END USER (2024)
FIGURE 176 GLOBAL GOLF CART AND NEIGHBORHOOD ELECTRIC VEHICLE (NEV)CURRENT AND FUTURE MARKET KEY COUNTRY LEVEL ANALYSIS, 2024–2034, (USD MILLION)
FIGURE 177 FINANCIAL OVERVIEW:
Key Player Analysis
E-Z-GO (Textron Inc.): E-Z-GO holds a leadership position in the global golf cart and NEV market through scale, dealer reach, and fleet penetration. As of 2025, the brand sits within Textron’s Specialized Vehicles segment, which generated close to USD 1.7 billion in revenue in its latest reported year. E-Z-GO maintains a strong presence across golf courses, resorts, planned communities, and industrial campuses, with electric models accounting for the majority of unit shipments. Production volumes exceeded 140,000 units over the 2021–2023 period, placing the brand among the highest-volume manufacturers globally.
Strategically, E-Z-GO continues to prioritize electrification, fleet telematics, and modular vehicle platforms. The company invests in lithium-ion battery integration, connected diagnostics, and configurable vehicle architectures to support both recreational and utility use cases. Its differentiators include deep relationships with golf course operators, a dense North American dealer network, and strong aftermarket and service capabilities. These factors support repeat fleet replacement cycles and stable margins as buyers focus on total cost of ownership and uptime.
Polaris Industries: Polaris Industries operates as a challenger in the golf cart and NEV space, applying its powersports engineering background to adjacent low-speed electric vehicles. In 2025, Polaris benefits from diversified revenue streams exceeding USD 9 billion across off-road and on-road segments, which support sustained investment in electric mobility platforms. The company targets commercial, recreational, and premium utility buyers seeking higher durability and performance within regulated low-speed environments.
Polaris emphasizes product differentiation through design, drivetrain reliability, and ruggedized components. Its strategic focus includes electrified platforms, selective partnerships, and manufacturing efficiencies drawn from its core off-road vehicle operations. Polaris also positions itself with customers that demand higher payload capacity and all-terrain capability than standard golf carts. This approach allows the company to capture share outside traditional golf applications and expand into industrial and mixed-use deployments.
Garia: Garia operates as a premium and niche player, focusing on luxury electric golf carts and road-legal NEVs. By 2025, the brand is recognized for high-end materials, automotive-grade interiors, and advanced onboard systems. Its vehicles often feature lithium-ion battery packs delivering up to 80 kilometers of range, integrated infotainment screens exceeding 10 inches, and enhanced safety equipment that meets regional low-speed road regulations.
Garia’s strategy centers on partnerships and limited-volume production aimed at affluent consumers, resorts, and private communities. Collaborations with automotive design houses and customization specialists strengthen brand visibility and pricing power. The company differentiates through craftsmanship, customization options, and dual-use capability for both course and street settings. While volumes remain lower than mass-market leaders, Garia captures higher average selling prices and benefits from demand growth in luxury residential developments and premium hospitality assets.
Market Key Players
STAR EV
Garia
Yamaha Golf-Car Company
American Custom Golf Cars
Polaris Industries
Bradshaw Electric Vehicles
E-Z-GO (Textron Inc.)
Club Car (Ingersoll Rand)
Other Key Players
Driver:
Rising Demand for Low-Emission Short-Distance Mobility
As of 2025, you see demand rise as governments, institutions, and consumers prioritize low-emission transport for short-distance mobility. Golf carts and NEVs align well with this shift because they address daily transport needs in gated communities, resorts, campuses, and controlled urban zones where full-sized vehicles add cost without functional benefit. Electric models now represent more than 85% of total unit sales, and the overall market continues to track a CAGR of about 9% through the early 2030s, reflecting sustained preference for electric platforms.
You also see cost discipline drive adoption. Electric golf carts and NEVs reduce operating expenses by roughly 30% to 40% versus gasoline alternatives due to lower maintenance and energy costs. Resorts, amusement parks, and corporate campuses increasingly standardize electric fleets to control lifecycle costs and meet internal sustainability targets. Regulatory acceptance of low-speed vehicles on designated public roads further strengthens demand by reducing compliance risk and expanding permitted use cases.
Restraint:
Speed and Range Limitations Restricting Broader Adoption
Despite growth momentum, you face structural limits tied to performance constraints. Most NEVs operate under speed caps of 25 to 35 mph and deliver real-world ranges between 50 and 100 kilometers per charge in 2025. These limits confine usage to short trips and restrict appeal for broader urban commuting, where higher speeds and route flexibility remain essential.
Charging Dependency and Fleet Downtime Concerns
Charging dependency also weighs on adoption. High-utilization fleets require predictable uptime, yet recharge cycles still introduce downtime, especially in locations with limited charging density. Range anxiety persists for institutional buyers evaluating multi-shift operations. These factors narrow addressable demand to controlled environments and slow expansion into open urban networks, shaping cautious procurement decisions.
Urban expansion across Asia Pacific, Latin America, and parts of the Middle East creates a clear growth path. You see city planners and private developers adopt low-speed electric transport to manage congestion, improve local mobility, and control emissions. Emerging regions collectively account for an estimated 35% of incremental demand growth by 2030 as new residential clusters and tourism assets come online.
Policy Incentives Strengthening Fleet Procurement
Policy support reinforces this opportunity. Incentives such as tax relief, reduced registration fees, and infrastructure funding lower entry barriers for fleet buyers. Manufacturers that localize production and tailor specifications to regional regulations position themselves to capture share as emerging markets integrate NEVs into urban mobility plans.
Trend:
Lithium-Ion Advancements Enhancing Range and Lifecycle
Technology progress reshapes competitive positioning in 2025. Lithium-ion batteries now deliver up to 80 kilometers of range with shorter charging cycles, extending daily operating windows for commercial fleets. Battery lifecycles exceed 2,000 charge cycles, improving total cost predictability for high-usage buyers.
You also see rapid uptake of connected systems. Fleet operators deploy telematics, geofencing, and predictive maintenance tools to reduce downtime and misuse. Digital dashboards support asset tracking and service scheduling across large fleets. These advances expand viable applications and strengthen the role of NEVs and golf carts as dependable mobility assets rather than niche vehicles.
Recent Developments
Dec 2024 – Textron Inc. (E-Z-GO): Textron announced a USD 120 million capacity expansion at its U.S. manufacturing facilities to scale lithium-ion golf cart and NEV production, targeting a 20% increase in annual output by late 2025. This move strengthens E-Z-GO’s ability to meet rising fleet demand from golf courses, resorts, and planned communities while protecting market share in North America.
Feb 2025 – Polaris Industries: Polaris introduced a new low-speed electric vehicle platform for commercial and mixed-use applications, featuring modular battery packs and connected fleet monitoring. Initial deployments covered over 3,000 units across campuses and industrial sites. The launch expands Polaris’ footprint beyond recreational vehicles and deepens exposure to recurring fleet replacement cycles.
Apr 2025 – Club Car: Club Car entered a multi-year partnership with a global hospitality group valued at over USD 75 million to supply electric carts and NEVs across more than 150 resort properties worldwide. The agreement positions Club Car as a preferred supplier in premium hospitality and improves long-term revenue visibility through service and parts contracts.
Jul 2025 – Garia: Garia launched an updated road-legal NEV lineup in Europe and the United States, offering up to 80 km driving range and advanced infotainment features. Early orders exceeded 1,200 units within three months. The update reinforces Garia’s position in the luxury segment and supports margin expansion through higher average selling prices.
Sep 2025 – Yamaha Motor Co.: Yamaha expanded its electric golf cart production in Asia-Pacific with a new assembly line in Southeast Asia, expected to add 15,000 units of annual capacity. This expansion improves regional supply responsiveness and supports growth in emerging tourism and residential developments.