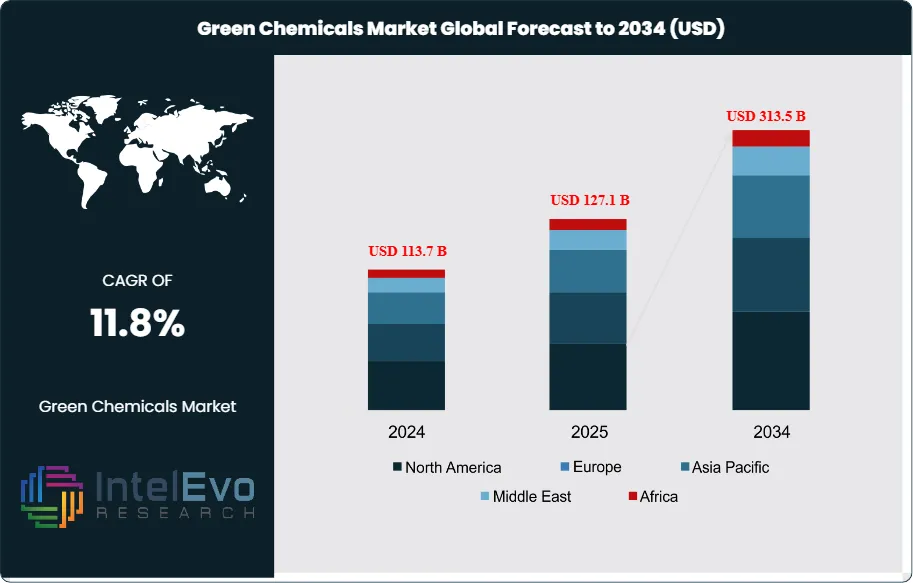
The Green Chemicals Market is estimated at USD 113.7 Billion in 2024 and is on track to reach roughly USD 313.5 Billion by 2034, implying a compound annual growth rate of 11.8% over 2024–2034. Growth is underpinned by a steady shift from petrochemical to bio-based and low-carbon inputs across packaging, textiles, agriculture, coatings, and consumer goods. Following feedstock price volatility in 2022, cost curves improved in 2023–2024 as renewable power availability rose and biobased feedstock supply stabilized, supporting margin recovery and reinvestment. Asia Pacific now accounts for an estimated 42–45% of global demand, Europe ~30–32% on the back of stringent sustainability regulations, and North America ~22–24% with accelerating corporate procurement of low-carbon materials. Over the forecast horizon, absolute growth is expected to be led by Asia, while Europe sustains premium pricing and faster adoption in specialty formulations.
Demand-side drivers include brand owner net-zero commitments, extended producer responsibility (EPR) for packaging, and end-market shifts toward low-VOC, non-toxic chemistries; more than 70% of large FMCG and apparel companies have announced Scope 3 targets, favoring green surfactants, solvents, and additives. On the supply side, scale in fermentation, catalysis, and electrified processing is narrowing the green premium; several key pathways—lactic acid to PLA, vegetable-oil-based polyols, and bio-ethanol to ethylene derivatives—are approaching cost parity at oil prices above USD 70–80/bbl. Regulatory momentum—from REACH and EU Green Deal provisions to emerging carbon disclosure rules—further embeds adoption, though risks persist around biomass availability, certification fragmentation, and capex intensity for first-of-a-kind plants.
Technological innovation is reshaping competitiveness. Synthetic biology and precision fermentation are lifting titers and yields by 10–25% versus prior generations; AI-assisted formulation design and digital twins are compressing development cycles by several months; and advanced recycling/CCU routes are opening drop-in options for solvents and monomers. Investment hotspots include bio-surfactants and specialty additives (projected CAGRs of ~13–16%), biopolymers such as PLA/PHA (~15%+), and high-performance, low-VOC coatings (~11–13%). India exemplifies the opportunity: green chemical concentrates for packaging, textiles, agriculture, and coatings are expanding within a chemical sector that contributes ~7% to GDP, employs 5+ million people, and is projected to grow from USD 220 billion (2022) to ~USD 300 billion by 2030. For investors, near-term value lies in platform technologies with multi-molecule optionality, regional feedstock integration in Asia, and specialty niches in Europe where regulatory tailwinds support premium margins.
Key Takeaways
Market Growth: The global Green Chemicals market is projected to expand from USD 113.7 billion in 2024 to USD 313.5 billion by 2034, reflecting a 11.8% CAGR; growth is propelled by regulatory pressure, brand-owner Scope 3 targets, and substitution of petrochemical inputs across packaging, textiles, agriculture, and coatings.
Segment Dominance – Feedstock Source: Plant-based routes lead with 76.1% share, supported by mature sugar/starch and vegetable-oil supply chains and improving process yields that are narrowing the green premium to low-double digits in scaled assets.
Segment Dominance – Product Type: Biopolymers command 39.2% share, driven by rapid adoption of PLA/PHA and bio-PE in rigid and flexible packaging; procurement programs at FMCG and retail brands are shifting volumes toward compostable and bio-attributed materials.
Segment Dominance – End Use: Chemicals & materials account for 37.3% of demand as green solvents, surfactants, polyols, and additives integrate into adhesives, coatings, and intermediates where drop-in compatibility and compliance premiums sustain uptake.
Driver: Corporate decarbonization is accelerating demand—over two-thirds of large FMCG/apparel companies now disclose Scope 3 reduction plans—while EPR and product-carbon-labeling rules are boosting adoption in packaging and specialty chemicals.
Restraint: Cost and scale remain hurdles: green formulations often carry a 10–25% price premium versus fossil incumbents, and first-of-a-kind facilities face 20–40% higher capex and multi-year ramp-up risks tied to biomass availability and certification.
Opportunity: Fastest growth is expected in biopolymers and biosurfactants (≈13–16% CAGR through 2034); India emerges as a manufacturing and demand hotspot as its chemicals sector scales from USD 220B (2022) to ~USD 300B (2030) with policy support for sustainable inputs.
Trend: Process innovation—synthetic biology, precision fermentation, and electrified/reactive distillation—has lifted titers and yields by ~10–20% and, alongside AI-assisted formulation and digital twins, is shortening commercialization cycles by several months; leaders include BASF, Braskem (bio-PE), Corbion/NatureWorks (PLA), and Evonik (biosurfactants).
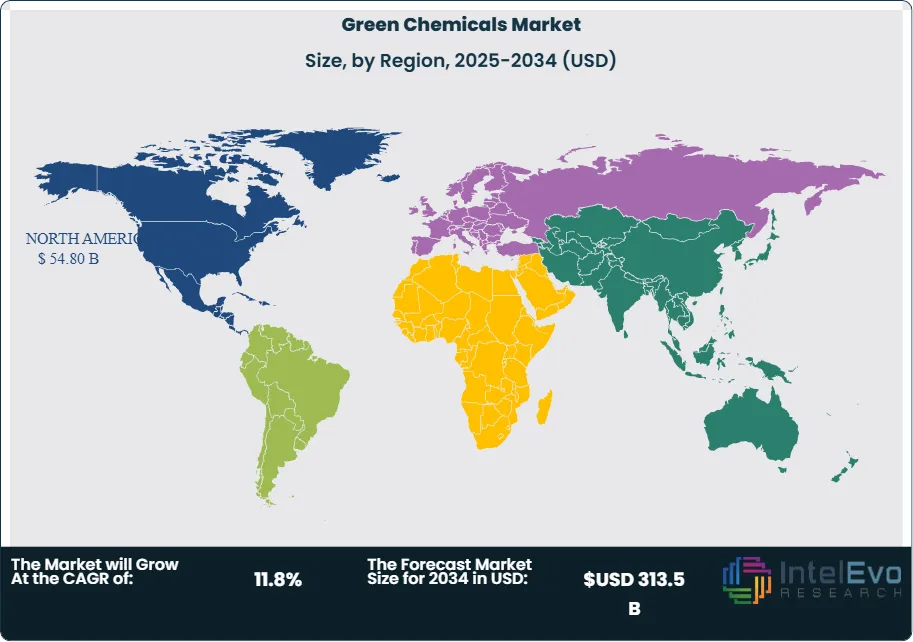
Regional Analysis: North America led in 2024 with 48.2% share (~USD 53.8B), buoyed by corporate procurement and incentives; Asia Pacific is the fastest-growing region (~12–14% CAGR) on capacity build-outs and feedstock proximity, while Europe sustains premium pricing under Green Deal and REACH-driven substitution.
Type Analysis
Biopolymers remain the anchor of product demand, accounting for an estimated ~39.2% of global green-chemicals revenues in 2024 and poised to outpace the broader market through 2030–2034 as packaging, consumer goods, and automotive interiors prioritize compostable and bio-attributed materials. PLA, PHA, bio-PE, and starch blends are gaining share on the back of brand-owner targets and extended producer responsibility (EPR) rules; leaders such as NatureWorks/Corbion (PLA), Braskem (bio-PE), and Danimer (PHA) are expanding capacity and downstream partnerships. Bio-alcohols (e.g., bio-ethanol, bio-butanol) and platform chemicals (lactic, succinic, itaconic acids) are benefiting from drop-in compatibility with existing value chains, supporting cost-down trajectories as plants scale. Bio-organic acids and bio-ketones occupy smaller, specialty niches but command pricing power in high-purity food, pharma, and coatings applications.
From a feedstock lens, plant-based routes dominate with ~76.1% share in 2024, reflecting mature supply chains for sugars, starches, and vegetable oils; microorganisms are gaining traction in precision fermentation where yield gains of 10–20% are being reported, improving unit economics. Looking into 2025+, we expect biopolymers to post low-to-mid-teens CAGR, while bio-alcohols and platform chemicals expand at high single to low double digits as carbon-intensity thresholds and product-carbon disclosure requirements tighten across major markets.
Application Analysis
Packaging is the largest application, absorbing an estimated ~40–45% of biopolymer and bio-derived inputs as retailers and FMCG players accelerate transitions to compostable films, bio-PE bottles, and recyclable, low-VOC coatings. Adoption is reinforced by single-use plastic restrictions and recycled-content mandates, with procurement programs increasingly specifying bio-attributed or mass-balanced content. Coatings, adhesives, and sealants represent another sizable pool of demand, supported by green solvents, bio-based polyols, and low-toxicity additives that meet indoor-air-quality and product-safety standards.
Beyond consumer packaging, agriculture (bio-stimulants, biodegradable mulch), textiles and apparel (bio-based fibers/finishes), and personal care (biosurfactants, bio-emollients) are scaling from pilot to commercial volumes, collectively expected to grow at ~12–15% CAGR through the next decade. Electronics and transportation are emerging use cases, where drop-in bio-solvents and engineered biopolymers enable decarbonization without redesigning production assets—an important lever for cost-effective compliance.
End-Use Analysis
The chemical sector is the leading end-use, representing ~37.3% of market demand in 2024 as producers reformulate solvents, surfactants, resins, and intermediates to reduce Scope 1–3 emissions and align with customer specifications. Multinationals are leveraging mass-balance certification and green-attributed feedstocks to deliver low-carbon grades in adhesives, coatings, and performance materials, often at a modest premium where regulatory or brand-value benefits justify the switch.
Food & beverages and packaging are the fastest adopters of biopolymers and bio-alcohols, aided by safety certifications and rapid LCA verification cycles; pharmaceuticals and personal care are expanding use of high-purity bio-based inputs for excipients, actives, and mild surfactants. Automotive and transportation are integrating bio-polyols and bio-based composites in interiors and lightweighting, while building & construction is shifting to low-VOC coatings and bio-asphalt modifiers—together pointing to broadening end-use diversity and resilience of demand.
Regional Analysis
North America led in 2024 with ~48.2% share (≈USD 53.8 billion), underpinned by corporate procurement of low-carbon materials, incentives that improve after-tax project returns, and deep downstream markets in packaging and specialty chemicals. Europe remains a price-premium market due to REACH, Green Deal initiatives, and product-carbon disclosures that push rapid substitution in high-value niches; leaders such as BASF and Evonik are scaling biosurfactants and green intermediates in partnership with consumer brands.
Asia Pacific is the fastest-growing region (often cited at ~12–14% CAGR through 2034), supported by feedstock proximity, biorefinery build-outs, and expanding demand in China, India, and Southeast Asia. India, in particular, is emerging as a manufacturing and consumption hub: its chemicals sector (projected to rise from ~USD 220B in 2022 to ~USD 300B by 2030) provides scale for green concentrates in packaging, textiles, agriculture, and coatings. Latin America leverages sugarcane ethanol platforms (notably Brazil) for bio-ethylene and downstream derivatives, while the Middle East & Africa are early-stage but strategically investing in bio-based and CCU routes to diversify away from fossil incumbency and meet export-market standards.
By Product Type (Biopolymers, Bio-alcohols, Bio-organic Acids, Bio-ketones, Platform Chemicals, Others), By Source (Plant-Based, Animal-Based, Microorganisms), By End-Use (Chemical, Food & Beverages, Pharmaceuticals, Automotive & Transportation, Paints & Coatings, Packaging, Building & Construction, Textiles & Apparel, Electronics & Consumer Goods, Personal Care & Cosmetics)
Research Methodology
Primary Research- 100 Interviews of Stakeholders
Secondary Research
Desk Research
Regional scope
North America (United States, Canada, Mexico)
Latin America (Brazil, Argentina, Columbia)
East Asia And Pacific (China, Japan, South Korea, Australia, Cambodia, Fiji, Indonesia)
Sea And South Asia (India, Singapore, Thailand, Taiwan, Malaysia)
Eastern Europe (Poland, Russia, Czech Republic, Romania)
Western Europe (Germany, U.K., France, Spain, Itlay)
Middle East & Africa (GCC Countries, Egypt, Nigeria, South Africa, Israel)
Competitive Landscape
Novozymes A/S, Toray Industries, Inc., Braskem, Corbion N.V., Valero Energy Corporation, Amyris, Inc., BASF SE, DSM, DuPont, Mitsubishi Chemical Group Corporation, BioAmber, Inc., Archer Daniels Midland, Green Plains Inc., Evonik Industries AG, PTT Global Chemical, SABIC, POET, LLC, Cargill, Incorporated, Arkema, Other Key Players
Customization Scope
Customization for segments, region/country-level will be provided. Moreover, additional customization can be done based on the requirements.
Pricing and Purchase Options
Avail customized purchase options to meet your exact research needs. We have three licenses to opt for: Single User License, Multi-User License (Up to 5 Users), Corporate Use License (Unlimited User and Printable PDF).
TABLE OF CONTENTS
1. EXECUTIVE SUMMARY
1.1. MARKET SNAPSHOT
1.2. KEY FINDINGS & INSIGHTS
1.3. ANALYST RECOMMENDATIONS
1.4. FUTURE OUTLOOK
2. RESEARCH METHODOLOGY
2.1. MARKET DEFINITION & SCOPE
2.2. RESEARCH OBJECTIVES: PRIMARY & SECONDARY DATA SOURCES
2.3. DATA COLLECTION SOURCES
2.3.1. COVERAGE OF 100+ PRIMARY RESEARCH/CONSULTATION CALLS WITH INDUSTRY STAKEHOLDERS
FIGURE 17 NORTH AMERICA GREEN CHEMICALS SYSTEM CURRENT AND FUTURE TYPE ANALYSIS, 2025–2034, (USD MILLION)
FIGURE 18 NORTH AMERICA GREEN CHEMICALS SYSTEM CURRENT AND FUTURE END USER ANALYSIS, 2025–2034, (USD MILLION)
FIGURE 19 MARKET SHARE BY COUNTRY
FIGURE 20 LATIN AMERICA GREEN CHEMICALS SYSTEM CURRENT AND FUTURE TYPE ANALYSIS, 2025–2034, (USD MILLION)
FIGURE 21 LATIN AMERICA GREEN CHEMICALS SYSTEM CURRENT AND FUTURE END USER ANALYSIS, 2025–2034, (USD MILLION)
FIGURE 22 MARKET SHARE BY COUNTRY
FIGURE 23 EASTERN EUROPE GREEN CHEMICALS SYSTEM CURRENT AND FUTURE TYPE ANALYSIS, 2025–2034, (USD MILLION)
FIGURE 24 EASTERN EUROPE GREEN CHEMICALS SYSTEM CURRENT AND FUTURE END USER ANALYSIS, 2025–2034, (USD MILLION)
FIGURE 25 MARKET SHARE BY COUNTRY
FIGURE 26 WESTERN EUROPE GREEN CHEMICALS SYSTEM CURRENT AND FUTURE TYPE ANALYSIS, 2025–2034, (USD MILLION)
FIGURE 27 WESTERN EUROPE GREEN CHEMICALS SYSTEM CURRENT AND FUTURE END USER ANALYSIS, 2025–2034, (USD MILLION)
FIGURE 28 MARKET SHARE BY COUNTRY
FIGURE 29 EAST ASIA AND PACIFIC GREEN CHEMICALS SYSTEM CURRENT AND FUTURE TYPE ANALYSIS, 2025–2034, (USD MILLION)
FIGURE 30 EAST ASIA AND PACIFIC GREEN CHEMICALS SYSTEM CURRENT AND FUTURE END USER ANALYSIS, 2025–2034, (USD MILLION)
FIGURE 31 MARKET SHARE BY COUNTRY
FIGURE 32 SEA AND SOUTH ASIA GREEN CHEMICALS SYSTEM CURRENT AND FUTURE TYPE ANALYSIS, 2025–2034, (USD MILLION)
FIGURE 33 SEA AND SOUTH ASIA GREEN CHEMICALS SYSTEM CURRENT AND FUTURE END USER ANALYSIS, 2025–2034, (USD MILLION)
FIGURE 34 MARKET SHARE BY COUNTRY
FIGURE 35 MIDDLE EAST AND AFRICA GREEN CHEMICALS SYSTEM CURRENT AND FUTURE TYPE ANALYSIS, 2025–2034, (USD MILLION)
FIGURE 36 MIDDLE EAST AND AFRICA GREEN CHEMICALS SYSTEM CURRENT AND FUTURE END USER ANALYSIS, 2025–2034, (USD MILLION)
FIGURE 37 NORTH AMERICA GREEN CHEMICALS SYSTEM CURRENT AND FUTURE MARKET VOLUME SHARE REGIONAL ANALYSIS, 2025–2034, (USD MILLION)
FIGURE 38 U.S. GREEN CHEMICALS SYSTEM CURRENT AND FUTURE TYPE ANALYSIS, 2025–2034, (USD MILLION)
FIGURE 39 U.S. GREEN CHEMICALS SYSTEM CURRENT AND FUTURE END USER ANALYSIS, 2025–2034, (USD MILLION)
FIGURE 40 CANADA GREEN CHEMICALS SYSTEM CURRENT AND FUTURE TYPE ANALYSIS, 2025–2034, (USD MILLION)
FIGURE 41 CANADA GREEN CHEMICALS SYSTEM CURRENT AND FUTURE END USER ANALYSIS, 2025–2034, (USD MILLION)
FIGURE 42 LATIN AMERICA GREEN CHEMICALS SYSTEM CURRENT AND FUTURE MARKET VOLUME SHARE REGIONAL ANALYSIS, 2025–2034, (USD MILLION)
FIGURE 43 MEXICO GREEN CHEMICALS SYSTEM CURRENT AND FUTURE TYPE ANALYSIS, 2025–2034, (USD MILLION)
FIGURE 44 MEXICO GREEN CHEMICALS SYSTEM CURRENT AND FUTURE END USER ANALYSIS, 2025–2034, (USD MILLION)
FIGURE 45 BRAZIL GREEN CHEMICALS SYSTEM CURRENT AND FUTURE TYPE ANALYSIS, 2025–2034, (USD MILLION)
FIGURE 46 BRAZIL GREEN CHEMICALS SYSTEM CURRENT AND FUTURE END USER ANALYSIS, 2025–2034, (USD MILLION)
FIGURE 47 ARGENTINA GREEN CHEMICALS SYSTEM CURRENT AND FUTURE TYPE ANALYSIS, 2025–2034, (USD MILLION)
FIGURE 48 ARGENTINA GREEN CHEMICALS SYSTEM CURRENT AND FUTURE END USER ANALYSIS, 2025–2034, (USD MILLION)
FIGURE 49 COLUMBIA GREEN CHEMICALS SYSTEM CURRENT AND FUTURE TYPE ANALYSIS, 2025–2034, (USD MILLION)
FIGURE 50 COLUMBIA GREEN CHEMICALS SYSTEM CURRENT AND FUTURE END USER ANALYSIS, 2025–2034, (USD MILLION)
FIGURE 51 REST OF LATIN AMERICA GREEN CHEMICALS SYSTEM CURRENT AND FUTURE TYPE ANALYSIS, 2025–2034, (USD MILLION)
FIGURE 52 REST OF LATIN AMERICA GREEN CHEMICALS SYSTEM CURRENT AND FUTURE END USER ANALYSIS, 2025–2034, (USD MILLION)
FIGURE 53 EASTERN EUROPE GREEN CHEMICALS SYSTEM CURRENT AND FUTURE MARKET VOLUME SHARE REGIONAL ANALYSIS, 2025–2034, (USD MILLION)
FIGURE 54 POLAND GREEN CHEMICALS SYSTEM CURRENT AND FUTURE TYPE ANALYSIS, 2025–2034, (USD MILLION)
FIGURE 55 POLAND GREEN CHEMICALS SYSTEM CURRENT AND FUTURE END USER ANALYSIS, 2025–2034, (USD MILLION)
FIGURE 56 RUSSIA GREEN CHEMICALS SYSTEM CURRENT AND FUTURE TYPE ANALYSIS, 2025–2034, (USD MILLION)
FIGURE 57 RUSSIA GREEN CHEMICALS SYSTEM CURRENT AND FUTURE END USER ANALYSIS, 2025–2034, (USD MILLION)
FIGURE 58 CZECH REPUBLIC GREEN CHEMICALS SYSTEM CURRENT AND FUTURE TYPE ANALYSIS, 2025–2034, (USD MILLION)
FIGURE 59 CZECH REPUBLIC GREEN CHEMICALS SYSTEM CURRENT AND FUTURE END USER ANALYSIS, 2025–2034, (USD MILLION)
FIGURE 60 ROMANIA GREEN CHEMICALS SYSTEM CURRENT AND FUTURE TYPE ANALYSIS, 2025–2034, (USD MILLION)
FIGURE 61 ROMANIA GREEN CHEMICALS SYSTEM CURRENT AND FUTURE END USER ANALYSIS, 2025–2034, (USD MILLION)
FIGURE 62 REST OF EASTERN EUROPE GREEN CHEMICALS SYSTEM CURRENT AND FUTURE TYPE ANALYSIS, 2025–2034, (USD MILLION)
FIGURE 63 REST OF EASTERN EUROPE GREEN CHEMICALS SYSTEM CURRENT AND FUTURE END USER ANALYSIS, 2025–2034, (USD MILLION)
FIGURE 64 WESTERN EUROPE GREEN CHEMICALS SYSTEM CURRENT AND FUTURE MARKET VOLUME SHARE REGIONAL ANALYSIS, 2025–2034, (USD MILLION)
FIGURE 65 GERMANY GREEN CHEMICALS SYSTEM CURRENT AND FUTURE TYPE ANALYSIS, 2025–2034, (USD MILLION)
FIGURE 66 GERMANY GREEN CHEMICALS SYSTEM CURRENT AND FUTURE END USER ANALYSIS, 2025–2034, (USD MILLION)
FIGURE 67 FRANCE GREEN CHEMICALS SYSTEM CURRENT AND FUTURE TYPE ANALYSIS, 2025–2034, (USD MILLION)
FIGURE 68 FRANCE GREEN CHEMICALS SYSTEM CURRENT AND FUTURE END USER ANALYSIS, 2025–2034, (USD MILLION)
FIGURE 69 UK GREEN CHEMICALS SYSTEM CURRENT AND FUTURE TYPE ANALYSIS, 2025–2034, (USD MILLION)
FIGURE 70 UK GREEN CHEMICALS SYSTEM CURRENT AND FUTURE END USER ANALYSIS, 2025–2034, (USD MILLION)
FIGURE 71 SPAIN GREEN CHEMICALS SYSTEM CURRENT AND FUTURE TYPE ANALYSIS, 2025–2034, (USD MILLION)
FIGURE 72 SPAIN GREEN CHEMICALS SYSTEM CURRENT AND FUTURE END USER ANALYSIS, 2025–2034, (USD MILLION)
FIGURE 73 ITALY GREEN CHEMICALS SYSTEM CURRENT AND FUTURE TYPE ANALYSIS, 2025–2034, (USD MILLION)
FIGURE 74 ITALY GREEN CHEMICALS SYSTEM CURRENT AND FUTURE END USER ANALYSIS, 2025–2034, (USD MILLION)
FIGURE 75 REST OF WESTERN EUROPE GREEN CHEMICALS SYSTEM CURRENT AND FUTURE TYPE ANALYSIS, 2025–2034, (USD MILLION)
FIGURE 76 REST OF WESTERN EUROPE GREEN CHEMICALS SYSTEM CURRENT AND FUTURE END USER ANALYSIS, 2025–2034, (USD MILLION)
FIGURE 77 EAST ASIA AND PACIFIC GREEN CHEMICALS SYSTEM CURRENT AND FUTURE MARKET VOLUME SHARE REGIONAL ANALYSIS, 2025–2034, (USD MILLION)
FIGURE 78 CHINA GREEN CHEMICALS SYSTEM CURRENT AND FUTURE TYPE ANALYSIS, 2025–2034, (USD MILLION)
FIGURE 79 CHINA GREEN CHEMICALS SYSTEM CURRENT AND FUTURE END USER ANALYSIS, 2025–2034, (USD MILLION)
FIGURE 80 JAPAN GREEN CHEMICALS SYSTEM CURRENT AND FUTURE TYPE ANALYSIS, 2025–2034, (USD MILLION)
FIGURE 81 JAPAN GREEN CHEMICALS SYSTEM CURRENT AND FUTURE END USER ANALYSIS, 2025–2034, (USD MILLION)
FIGURE 82 AUSTRALIA GREEN CHEMICALS SYSTEM CURRENT AND FUTURE TYPE ANALYSIS, 2025–2034, (USD MILLION)
FIGURE 83 AUSTRALIA GREEN CHEMICALS SYSTEM CURRENT AND FUTURE END USER ANALYSIS, 2025–2034, (USD MILLION)
FIGURE 84 CAMBODIA GREEN CHEMICALS SYSTEM CURRENT AND FUTURE TYPE ANALYSIS, 2025–2034, (USD MILLION)
FIGURE 85 CAMBODIA GREEN CHEMICALS SYSTEM CURRENT AND FUTURE END USER ANALYSIS, 2025–2034, (USD MILLION)
FIGURE 86 FIJI GREEN CHEMICALS SYSTEM CURRENT AND FUTURE TYPE ANALYSIS, 2025–2034, (USD MILLION)
FIGURE 87 FIJI GREEN CHEMICALS SYSTEM CURRENT AND FUTURE END USER ANALYSIS, 2025–2034, (USD MILLION)
FIGURE 88 INDONESIA GREEN CHEMICALS SYSTEM CURRENT AND FUTURE TYPE ANALYSIS, 2025–2034, (USD MILLION)
FIGURE 89 INDONESIA GREEN CHEMICALS SYSTEM CURRENT AND FUTURE END USER ANALYSIS, 2025–2034, (USD MILLION)
FIGURE 90 SOUTH KOREA GREEN CHEMICALS SYSTEM CURRENT AND FUTURE TYPE ANALYSIS, 2025–2034, (USD MILLION)
FIGURE 91 SOUTH KOREA GREEN CHEMICALS SYSTEM CURRENT AND FUTURE END USER ANALYSIS, 2025–2034, (USD MILLION)
FIGURE 92 REST OF EAST ASIA AND PACIFIC GREEN CHEMICALS SYSTEM CURRENT AND FUTURE TYPE ANALYSIS, 2025–2034, (USD MILLION)
FIGURE 93 REST OF EAST ASIA AND PACIFIC GREEN CHEMICALS SYSTEM CURRENT AND FUTURE END USER ANALYSIS, 2025–2034, (USD MILLION)
FIGURE 94 SEA AND SOUTH ASIA GREEN CHEMICALS SYSTEM CURRENT AND FUTURE MARKET VOLUME SHARE REGIONAL ANALYSIS, 2025–2034, (USD MILLION)
FIGURE 95 BANGLADESH GREEN CHEMICALS SYSTEM CURRENT AND FUTURE TYPE ANALYSIS, 2025–2034, (USD MILLION)
FIGURE 96 BANGLADESH GREEN CHEMICALS SYSTEM CURRENT AND FUTURE END USER ANALYSIS, 2025–2034, (USD MILLION)
FIGURE 97 NEW ZEALAND GREEN CHEMICALS SYSTEM CURRENT AND FUTURE TYPE ANALYSIS, 2025–2034, (USD MILLION)
FIGURE 98 NEW ZEALAND GREEN CHEMICALS SYSTEM CURRENT AND FUTURE END USER ANALYSIS, 2025–2034, (USD MILLION)
FIGURE 99 INDIA GREEN CHEMICALS SYSTEM CURRENT AND FUTURE TYPE ANALYSIS, 2025–2034, (USD MILLION)
FIGURE 100 INDIA GREEN CHEMICALS SYSTEM CURRENT AND FUTURE END USER ANALYSIS, 2025–2034, (USD MILLION)
FIGURE 101 SINGAPORE GREEN CHEMICALS SYSTEM CURRENT AND FUTURE TYPE ANALYSIS, 2025–2034, (USD MILLION)
FIGURE 102 SINGAPORE GREEN CHEMICALS SYSTEM CURRENT AND FUTURE END USER ANALYSIS, 2025–2034, (USD MILLION)
FIGURE 103 THAILAND GREEN CHEMICALS SYSTEM CURRENT AND FUTURE TYPE ANALYSIS, 2025–2034, (USD MILLION)
FIGURE 104 THAILAND GREEN CHEMICALS SYSTEM CURRENT AND FUTURE END USER ANALYSIS, 2025–2034, (USD MILLION)
FIGURE 105 TAIWAN GREEN CHEMICALS SYSTEM CURRENT AND FUTURE TYPE ANALYSIS, 2025–2034, (USD MILLION)
FIGURE 106 TAIWAN GREEN CHEMICALS SYSTEM CURRENT AND FUTURE END USER ANALYSIS, 2025–2034, (USD MILLION)
FIGURE 107 MALAYSIA GREEN CHEMICALS SYSTEM CURRENT AND FUTURE TYPE ANALYSIS, 2025–2034, (USD MILLION)
FIGURE 108 MALAYSIA GREEN CHEMICALS SYSTEM CURRENT AND FUTURE END USER ANALYSIS, 2025–2034, (USD MILLION)
FIGURE 109 REST OF SEA AND SOUTH ASIA GREEN CHEMICALS SYSTEM CURRENT AND FUTURE TYPE ANALYSIS, 2025–2034, (USD MILLION)
FIGURE 110 REST OF SEA AND SOUTH ASIA GREEN CHEMICALS SYSTEM CURRENT AND FUTURE END USER ANALYSIS, 2025–2034, (USD MILLION)
FIGURE 111 MIDDLE EAST AND AFRICA GREEN CHEMICALS SYSTEM CURRENT AND FUTURE MARKET VOLUME SHARE REGIONAL ANALYSIS, 2025–2034, (USD MILLION)
FIGURE 112 GCC COUNTRIES GREEN CHEMICALS SYSTEM CURRENT AND FUTURE TYPE ANALYSIS, 2025–2034, (USD MILLION)
FIGURE 113 GCC COUNTRIES GREEN CHEMICALS SYSTEM CURRENT AND FUTURE END USER ANALYSIS, 2025–2034, (USD MILLION)
FIGURE 114 SAUDI ARABIA GREEN CHEMICALS SYSTEM CURRENT AND FUTURE TYPE ANALYSIS, 2025–2034, (USD MILLION)
FIGURE 115 SAUDI ARABIA GREEN CHEMICALS SYSTEM CURRENT AND FUTURE END USER ANALYSIS, 2025–2034, (USD MILLION)
FIGURE 116 UAE GREEN CHEMICALS SYSTEM CURRENT AND FUTURE TYPE ANALYSIS, 2025–2034, (USD MILLION)
FIGURE 117 UAE GREEN CHEMICALS SYSTEM CURRENT AND FUTURE END USER ANALYSIS, 2025–2034, (USD MILLION)
FIGURE 118 BAHRAIN GREEN CHEMICALS SYSTEM CURRENT AND FUTURE TYPE ANALYSIS, 2025–2034, (USD MILLION)
FIGURE 119 BAHRAIN GREEN CHEMICALS SYSTEM CURRENT AND FUTURE END USER ANALYSIS, 2025–2034, (USD MILLION)
FIGURE 120 KUWAIT GREEN CHEMICALS SYSTEM CURRENT AND FUTURE TYPE ANALYSIS, 2025–2034, (USD MILLION)
FIGURE 121 KUWAIT GREEN CHEMICALS SYSTEM CURRENT AND FUTURE END USER ANALYSIS, 2025–2034, (USD MILLION)
FIGURE 122 OMAN GREEN CHEMICALS SYSTEM CURRENT AND FUTURE TYPE ANALYSIS, 2025–2034, (USD MILLION)
FIGURE 123 OMAN GREEN CHEMICALS SYSTEM CURRENT AND FUTURE END USER ANALYSIS, 2025–2034, (USD MILLION)
FIGURE 124 QATAR GREEN CHEMICALS SYSTEM CURRENT AND FUTURE TYPE ANALYSIS, 2025–2034, (USD MILLION)
FIGURE 125 QATAR GREEN CHEMICALS SYSTEM CURRENT AND FUTURE END USER ANALYSIS, 2025–2034, (USD MILLION)
FIGURE 126 EGYPT GREEN CHEMICALS SYSTEM CURRENT AND FUTURE TYPE ANALYSIS, 2025–2034, (USD MILLION)
FIGURE 127 EGYPT GREEN CHEMICALS SYSTEM CURRENT AND FUTURE END USER ANALYSIS, 2025–2034, (USD MILLION)
FIGURE 128 NIGERIA GREEN CHEMICALS SYSTEM CURRENT AND FUTURE TYPE ANALYSIS, 2025–2034, (USD MILLION)
FIGURE 129 NIGERIA GREEN CHEMICALS SYSTEM CURRENT AND FUTURE END USER ANALYSIS, 2025–2034, (USD MILLION)
FIGURE 130 SOUTH AFRICA GREEN CHEMICALS SYSTEM CURRENT AND FUTURE TYPE ANALYSIS, 2025–2034, (USD MILLION)
FIGURE 131 SOUTH AFRICA GREEN CHEMICALS SYSTEM CURRENT AND FUTURE END USER ANALYSIS, 2025–2034, (USD MILLION)
FIGURE 132 ISRAEL GREEN CHEMICALS SYSTEM CURRENT AND FUTURE TYPE ANALYSIS, 2025–2034, (USD MILLION)
FIGURE 133 ISRAEL GREEN CHEMICALS SYSTEM CURRENT AND FUTURE END USER ANALYSIS, 2025–2034, (USD MILLION)
FIGURE 134 REST OF MEA GREEN CHEMICALS SYSTEM CURRENT AND FUTURE TYPE ANALYSIS, 2025–2034, (USD MILLION)
FIGURE 135 REST OF MEA GREEN CHEMICALS SYSTEM CURRENT AND FUTURE END USER ANALYSIS, 2025–2034, (USD MILLION)
FIGURE 136 U. S. MARKET SHARE ANALYSIS BY TYPE (2024)
FIGURE 137 U. S. MARKET SHARE ANALYSIS BY END USER (2024)
FIGURE 138 CANADA MARKET SHARE ANALYSIS BY TYPE (2024)
FIGURE 139 CANADA MARKET SHARE ANALYSIS BY END USER (2024)
FIGURE 140 MEXICO MARKET SHARE ANALYSIS BY TYPE (2024)
FIGURE 141 MEXICO MARKET SHARE ANALYSIS BY END USER (2024)
FIGURE 142 CHINA MARKET SHARE ANALYSIS BY TYPE (2024)
FIGURE 143 CHINA MARKET SHARE ANALYSIS BY END USER (2024)
FIGURE 144 JAPAN MARKET SHARE ANALYSIS BY TYPE (2024)
FIGURE 145 JAPAN MARKET SHARE ANALYSIS BY END USER (2024)
FIGURE 146 INDIA MARKET SHARE ANALYSIS BY TYPE (2024)
FIGURE 147 INDIA MARKET SHARE ANALYSIS BY END USER (2024)
FIGURE 148 SOUTH KOREA MARKET SHARE ANALYSIS BY TYPE (2024)
FIGURE 149 SOUTH KOREA MARKET SHARE ANALYSIS BY END USER (2024)
FIGURE 150 SAUDI ARABIA MARKET SHARE ANALYSIS BY TYPE (2024)
FIGURE 151 SAUDI ARABIA MARKET SHARE ANALYSIS BY END USER (2024)
FIGURE 152 UAE MARKET SHARE ANALYSIS BY TYPE (2024)
FIGURE 153 UAE MARKET SHARE ANALYSIS BY END USER (2024)
FIGURE 154 EGYPT MARKET SHARE ANALYSIS BY TYPE (2024)
FIGURE 155 EGYPT MARKET SHARE ANALYSIS BY END USER (2024)
FIGURE 156 NIGERIA MARKET SHARE ANALYSIS BY TYPE (2024)
FIGURE 157 NIGERIA MARKET SHARE ANALYSIS BY END USER (2024)
FIGURE 158 SOUTH AFRICA MARKET SHARE ANALYSIS BY TYPE (2024)
FIGURE 159 SOUTH AFRICA MARKET SHARE ANALYSIS BY END USER (2024)
FIGURE 160 GERMANY MARKET SHARE ANALYSIS BY TYPE (2024)
FIGURE 161 GERMANY MARKET SHARE ANALYSIS BY END USER (2024)
FIGURE 162 FRANCE MARKET SHARE ANALYSIS BY TYPE (2024)
FIGURE 163 FRANCE MARKET SHARE ANALYSIS BY END USER (2024)
FIGURE 164 UK MARKET SHARE ANALYSIS BY TYPE (2024)
FIGURE 165 UK MARKET SHARE ANALYSIS BY END USER (2024)
FIGURE 166 SPAIN MARKET SHARE ANALYSIS BY TYPE (2024)
FIGURE 167 SPAIN MARKET SHARE ANALYSIS BY END USER (2024)
FIGURE 168 ITALY MARKET SHARE ANALYSIS BY TYPE (2024)
FIGURE 169 ITALY MARKET SHARE ANALYSIS BY END USER (2024)
FIGURE 170 BRAZIL MARKET SHARE ANALYSIS BY TYPE (2024)
FIGURE 171 BRAZIL MARKET SHARE ANALYSIS BY END USER (2024)
FIGURE 172 ARGENTINA MARKET SHARE ANALYSIS BY TYPE (2024)
FIGURE 173 ARGENTINA MARKET SHARE ANALYSIS BY END USER (2024)
FIGURE 174 COLUMBIA MARKET SHARE ANALYSIS BY TYPE (2024)
FIGURE 175 COLUMBIA MARKET SHARE ANALYSIS BY END USER (2024)
FIGURE 176 GLOBAL GREEN CHEMICALS SYSTEM CURRENT AND FUTURE MARKET KEY COUNTRY LEVEL ANALYSIS, 2024–2034, (USD MILLION)
FIGURE 177 FINANCIAL OVERVIEW:
Key Player Analysis
BASF SE: BASF anchors the market with a broad portfolio of mass-balance and circular-feedstock grades spanning coatings, plastics, and performance intermediates. The company’s Biomass Balance and ChemCycling® programs attribute renewable or recycled raw materials to drop-in products without process redesign—an approach that shortens customer transition timelines and helps meet product-carbon-footprint targets across automotive, packaging, and construction value chains. Strategically, BASF’s scale and Verbund integration enable consistent feedstock availability and certification at volume, reinforcing preferred-supplier status for multinationals pursuing Scope 3 reductions.
BASF’s 2025+ priorities emphasize expanded mass-balance offerings and deeper customer co-development in circular solutions, leveraging renewable power and standardized PCF reporting to reduce lifecycle emissions and unlock premium pricing in regulated markets (EU/UK). For buyers, BASF’s differentiator is system-level decarbonization—certified inputs, transparent accounting, and global manufacturing redundancy—lowering compliance risk while maintaining incumbent performance and supply reliability.
Braskem: Braskem operates the world’s largest bio-ethylene platform, expanding Triunfo capacity by 37% to275,000 t/y in 2025, which feeds I’m green™ bio-based PE grades used in packaging and consumer goods. The Triunfo complex also houses significant fossil ethylene and polyolefin capacity, offering flexibility to balance bio- and fossil-based output as markets evolve. This scale—combined with logistics upgrades and product launches (e.g., bio-HDPE for nonwovens)—supports resilient margins and growing penetration in hygiene, films, and rigid packaging.
Strategically, Braskem is pairing capacity growth with offtake partnerships and application development (e.g., nonwovens, bi-component fibers), while strengthening global logistics to de-risk supply. The company’s differentiators include proven ethanol-to-ethylene technology, a decade-plus field record for I’m green™ PE, and the ability to scale grades rapidly for brand owners pursuing Scope 3 targets ahead of 2030 packaging mandates.
Arkema: Arkema has built a high-margin moat around Rilsan® PA11, a 100% bio-based polyamide derived from castor oil, used in high-performance applications (automotive lines, sports, electronics, and 3D printing). The company lifted global PA11 capacity by ~50% with the Singapore complex start-up and, in 2025, committed further capex for a new transparent polyamide line on the same platform—tightening its grip on premium niches where durability, lightweighting, and lower carbon intensity command price premiums.
Arkema’s green-financing framework supports continued investment in castor-based polymers and specialty chemistries, while downstream collaborations accelerate material qualification in regulated end markets. Differentiators include traceable plant-oil feedstocks, global certification coverage, and application engineering that reduces switching costs for OEMs.
Evonik Industries AG: Evonik commissioned the world’s first industrial-scale rhamnolipids plant in Slovakia, moving biosurfactants from pilot to commercial volumes for home & personal care and cleaning applications. Rhamnolipids are fully biodegradable glycolipids with strong performance and aquatic compatibility, enabling formulators to meet eco-label criteria without sacrificing efficacy—an advantage as retailers and consumer brands tighten sustainability specifications in 2025+.
Evonik’s strategy blends biotech scale-up, application labs, and brand-owner partnerships to accelerate adoption, with the new capacity positioning the company to capture share as biosurfactant adoption rises. Differentiation stems from first-mover production at industrial scale, robust IP around fermentation and purification, and a specialty-chemicals commercial model that supports premium pricing and rapid formulation support across global customers.
Market Key Players
Novozymes A/S
Toray Industries, Inc.
Braskem
Corbion N.V.
Valero Energy Corporation
Amyris, Inc.
BASF SE
DSM
DuPont
Mitsubishi Chemical Group Corporation
BioAmber, Inc.
Archer Daniels Midland
Green Plains Inc.
Evonik Industries AG
PTT Global Chemical
SABIC
POET, LLC
Cargill, Incorporated
Arkema
Other Key Players
Driver:
Policy-Driven Decarbonization Accelerating Green Chemical Demand
As of 2025, policy-led decarbonization is translating directly into demand for low-carbon chemistries. India’s policy stack—National Chemical Policy direction, Production-Linked Incentive (PLI) mechanisms, and fast-rising renewable power—has become a material growth catalyst. Installed renewable capacity reached ~220 GW by March 2025 (including ~106 GW solar and ~50 GW wind), lowering electricity intensity and enabling greener feedstocks (bio-ethanol, biomethane, and early green hydrogen) for solvents, intermediates, and polymers. These measures de-risk capital projects, improve plant load factors, and compress the green premium, supporting double-digit growth in bio-based routes. Strategically, producers that align with compliance markets and brand-owner Scope 3 goals are gaining preferred-supplier status and locking in multi-year offtake.
Restraint:
High Costs and Feedstock Constraints Limiting Market Scalability
Cost and supply constraints remain the primary friction points. First-of-a-kind and scale-up biorefineries typically carry 20–40% higher capex than fossil incumbents, while bio-attributed products often price at a 10–25% premium, limiting penetration in price-sensitive applications. Feedstock logistics—collection, preprocessing, and year-round availability of agri-residues and oils—are uneven, inflating delivered costs and causing batch-to-batch variability. As certification and traceability requirements expand in 2025+, smaller producers face compliance overheads that erode margins. The strategic implication is consolidation toward players with integrated feedstock chains, mass-balance certification, and the balance sheet to absorb longer ramp-up curves.
Opportunity:
Biopolymers and Biosurfactants Creating High-Growth Investment Opportunities
A policy-enabled manufacturing build-out creates headroom for scale economics in high-growth niches. Biopolymers (PLA/PHA, bio-PE) and biosurfactants are set to outpace the broader market with projected mid-teens CAGRs through 2030, propelled by packaging EPR mandates and retailer procurement standards. Within India, PCPIR-linked infrastructure and PLI incentives can catalyze integrated clusters for fermentation, catalysis, and downstream compounding; under a base-case scenario, India’s green-chemicals revenues could reach USD 18–22 billion by 2030 at ~14–16% CAGR, with export-oriented grades (food-contact polymers, pharma-grade acids) capturing premium pricing. Strategically, investors should prioritize platform technologies with multi-molecule optionality and proximity to renewable power and feedstock basins.
Trend:
Energy-Transition Programs and Digital Innovation Reshaping Commercialization
Government-backed energy transition spending is accelerating commercialization timelines. India has earmarked large-scale investment for renewables, green hydrogen, and grid upgrades, complementing PLI support for chemical manufacturing; combined, these measures are shifting projects from pilot to bankable scale. Parallel initiatives—Centers of Excellence and Plastic Parks—are channeling R&D into precision fermentation, advanced catalysis, and low-VOC formulations, while digital twins and AI-assisted formulation are cutting development cycles by months. The result in 2025 is a market tilting toward drop-in, certified low-carbon grades supplied under mass-balance models, with early movers (e.g., biopolymer producers and biosurfactant leaders partnering with FMCG and packaging majors) securing advantaged offtake and pricing power.
Recent Developments
Dec 2024 – BASF SE: Expanded ISCC PLUS and REDcert² certifications at the Lemförde, Germany site to produce biomass-balanced thermoplastic polyurethanes, adding to a broader mass-balance portfolio across thermoplastics and PU systems. This strengthens BASF’s ability to supply certified low-carbon materials at scale for automotive, footwear, and industrial customers.
Feb 2025 – BASF SE: Introduced ISCC PLUS–certified biomass-balanced and Ccycled® plasticizers from Pasadena, Texas, and Cornwall, Ontario, adding North American production of lower-PCF grades for flexible PVC applications. The move deepens regional availability of certified alternatives and accelerates mass-balance adoption in building materials, wire & cable, and consumer goods.
Mar 2025 – Evonik Industries AG: Signed an exclusive U.S. distribution agreement with Sea-Land Chemical to expand market access for biosurfactants—including rhamnolipids produced at its industrial-scale Slovakia facility. The partnership broadens Evonik’s channel coverage in North America and supports faster penetration of biodegradable surfactants in home & personal care.
Apr 2025 – Braskem: Announced with Fitesa the use of I’m green™ bio-based polyethylene in nonwovens for hygiene and bi-component fiber applications, targeting high-volume spunbond lines; the program complements Braskem’s expanded green ethylene capacity. The collaboration accelerates substitution in hygiene substrates and positions Braskem to capture premium demand for bio-attributed polymers.
Jul 2025 – Arkema: Committed ~USD 20 million to build a new Rilsan® Clear (transparent bio-based polyamide) unit on its Singapore platform, following a 50% global PA11 capacity increase; start-up is slated for Q1 2026. The investment consolidates Arkema’s specialty leadership in high-performance, bio-based polymers for EVs, electronics, sports, and 3D printing across Asia.
Sep 2025 – BASF, AkzoNobel & Arkema: Launched a cross-value-chain initiative to lower the carbon footprint of architectural powder coatings, with BASF supplying zero-PCF neopentyl glycol (NPG) to Arkema and a joint case study on decarbonization pathways. The collaboration standardizes low-carbon inputs for high-volume coatings and could set a template for broader industry transitions.