Global Hardware-in-the-Loop Market Size, Share & Analysis By Loop Type (Open Loop HIL, Closed Loop HIL), By End-User (Automobile, Aerospace and Defense, Electronic Power, Scientific Research and Education), Industry Regions & Key Players – Simulation & Testing Trends & Forecast 2025–2034
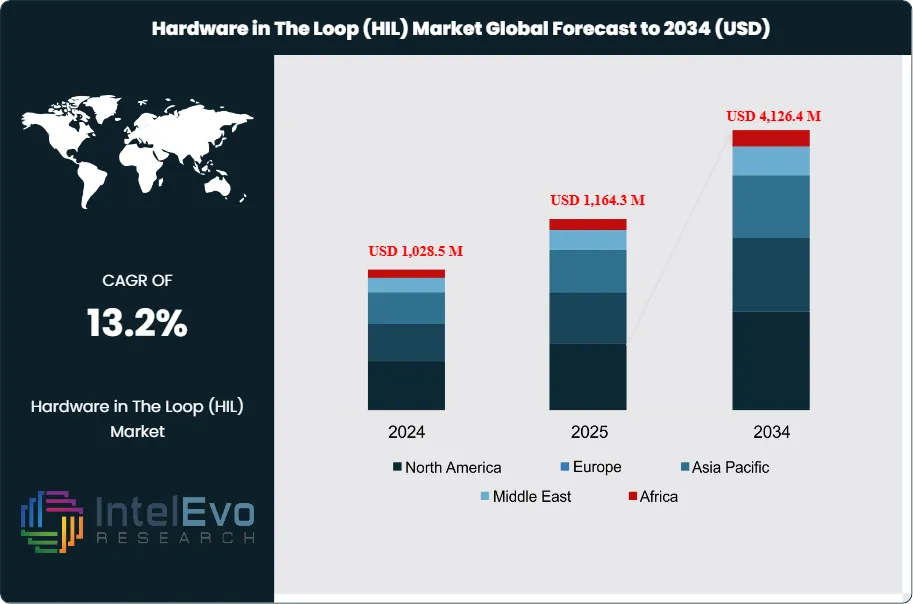
The Hardware-in-the-Loop (HIL) Market is valued at approximately USD 1,028.5 million in 2024 and is projected to reach nearly USD 4,126.4 million by 2034, expanding at a strong CAGR of about 13.2% from 2025–2034. This surge is driven by the rising complexity of autonomous vehicles, EV powertrains, aerospace control systems, and high-speed power electronics—all requiring real-time simulation and precision validation before deployment. As industries accelerate digital twins, model-based design, and safety-critical testing, HIL is becoming indispensable for reducing development cycles and ensuring compliance. With 4th-generation HIL platforms supporting SiC/GaN converters and ultra-fast motor drives, the market is gaining significant visibility across automotive, aerospace, robotics, and energy innovation ecosystems.
This strong growth trajectory reflects the escalating complexity of embedded systems across critical sectors such as automotive, aerospace, defense, energy, and industrial automation. As next-generation systems demand higher reliability, faster development cycles, and rigorous safety validation, the use of HIL testing has become indispensable. By simulating real-world conditions with high fidelity, HIL enables engineers to validate hardware components against dynamic digital models—enhancing development efficiency, reducing time-to-market, and mitigating risks in safety-critical environments.
Historically, HIL testing has been concentrated in automotive applications, particularly for electronic control unit (ECU) validation in autonomous and electric vehicles. However, its adoption is now expanding rapidly across aerospace flight control systems, defense simulation programs, and renewable energy grid integration, each requiring precise, real-time system behavior modeling. These cross-industry demands are fueling innovation in simulation tools, with vendors focusing on increased computing power, real-time responsiveness, and scalable architectures that can support complex, multi-domain testing scenarios.
From a technological standpoint, the market is being reshaped by advances in model-based design, AI-enhanced simulation algorithms, and cloud-enabled testing environments, which allow distributed teams to collaborate and validate hardware remotely. As simulation fidelity and hardware-software integration continue to improve, HIL is becoming a central pillar in the systems engineering lifecycle, especially for projects where failure is not an option.
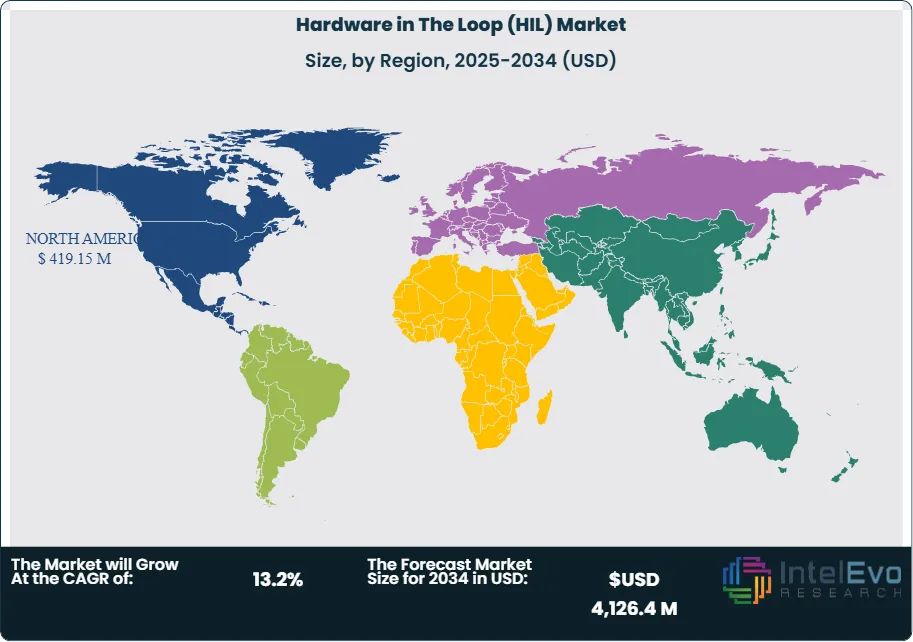
Regionally, North America and Europe remain the frontrunners due to high R&D investment and mature automotive and aerospace industries. However, Asia Pacific is emerging as a significant growth hotspot, driven by China, Japan, and India’s focus on electric mobility, industrial automation, and defense modernization. This regional expansion, coupled with increasing demand for virtual validation and system reliability, is expected to accelerate market penetration over the coming years.
Overall, the HIL market is entering a transformative phase, marked by digitalization, domain convergence, and growing reliance on intelligent, simulation-driven development workflows.
Key Takeaways
Market Growth: The global Hardware-in-the-Loop (HIL) market was valued at USD 1,028.5 million and is projected to reach approximately USD 4,126.4 million by 2034, expanding at a CAGR of 13.2%. Growth is primarily driven by the increasing complexity of embedded systems across automotive, aerospace, and energy sectors, alongside growing demand for real-time testing environments.
Loop Type: Closed-loop HIL systems held the largest share of the market in 2023 at 53.0%, owing to their superior reliability, error detection accuracy, and ability to simulate real-time feedback mechanisms critical for safety-critical applications.
End Use: The automotive sector remains the dominant end-user segment with a 54.5% market share, fueled by rapid integration of HIL platforms to validate Electronic Control Units (ECUs), ADAS features, and vehicle electrification systems in compliance with industry regulations.
Driver: The rising adoption of HIL testing in autonomous vehicle development and collision avoidance systems is a key driver, enabling real-time validation of complex control systems before deployment and reducing safety risks.
Restraint: High implementation costs and the complexity of building accurate simulation models remain a major constraint. Advanced HIL setups require specialized hardware and skilled engineering talent, limiting adoption among smaller players and budget-constrained sectors.
Opportunity: Emerging applications in power electronics and industrial automation present strong growth potential. Sectors such as renewable energy systems and robotics are increasingly relying on HIL testing to validate high-performance controllers and meet safety certification requirements.
Trend: The transition to 4th generation HIL frameworks is reshaping the industry, with focus areas including motor drive testing, electric propulsion systems, and high-fidelity digital twins. Key players are investing in cloud-based simulation platforms and AI-enhanced test automation to meet next-gen system demands.
Regional Analysis: North America leads the global HIL market, supported by robust investment in autonomous vehicle R&D and aerospace innovation, particularly in the United States and Canada. Europe follows closely, while Asia Pacific is emerging as a high-growth region driven by EV adoption, industrial digitization, and government-led testing mandates.
Loop Type Analysis
The Hardware-in-the-Loop (HIL) market is segmented into open-loop and closed-loop systems, with closed-loop HIL maintaining a leading position in 2025, accounting for an estimated over 53% of total revenue share. This dominance is attributed to the system’s ability to deliver high precision, real-time responsiveness, and enhanced stability by incorporating continuous feedback mechanisms. Closed-loop configurations allow for constant communication between the controller and the system under test, making them ideal for complex and safety-critical applications such as automotive ECU validation, flight control systems, and advanced robotics. These capabilities enable engineers to identify faults and correct system behavior dynamically, reducing the risk of failure in real-world deployment.
Meanwhile, open-loop HIL systems are gaining traction due to their simplified design, lower cost, and ease of implementation—particularly attractive in applications where feedback is non-essential or system response is relatively predictable. While open-loop systems do not incorporate feedback from the Device Under Test (DUT), they offer a cost-effective solution for functional testing of components such as onboard units, where control validation is time-based or event-triggered. As industries pursue scalable and budget-conscious solutions, especially in early-stage product validation or academic research environments, the demand for open-loop HIL is expected to rise steadily through the forecast period.
End-User Analysis
In terms of end-user adoption, the automotive sector remains the dominant segment, commanding over 54% of the global HIL market share in 2025. The widespread integration of HIL systems within vehicle development cycles is driven by the increasing complexity of modern vehicles, particularly with the growth of Advanced Driver Assistance Systems (ADAS), electric powertrains, and autonomous driving features. HIL testing provides automakers with a cost-efficient, risk-reducing solution to validate complex control systems in real-time simulations, significantly accelerating time-to-market and regulatory compliance.
The aerospace and defense sector is also witnessing notable growth, as manufacturers face mounting pressure to reduce development timelines and enhance system reliability. HIL systems are increasingly deployed to simulate high-stakes scenarios for avionics, UAVs, and advanced defense equipment, minimizing reliance on costly physical prototypes. This trend is supported by rising global defense budgets and rapid innovation in aerospace technology. Additionally, sectors such as electronic power systems and scientific research institutions are embracing HIL platforms to validate high-performance controllers and conduct safe, repeatable tests of mission-critical systems—broadening the market’s use cases and reinforcing its long-term relevance.
Regional Analysis
North America continues to lead the global Hardware-in-the-Loop market in 2025, accounting for approximately 35–36% of total market revenue, driven by robust demand in the region’s mature automotive and aerospace sectors. The United States, home to some of the world’s largest OEMs and Tier 1 suppliers, remains a hotspot for innovation in HIL technologies, particularly as companies accelerate development of autonomous vehicles and next-gen aerospace platforms. Government support for defense R&D and smart manufacturing initiatives further strengthens North America's dominant position in this space.
Europe ranks as the second-largest regional market, supported by strong investments in automotive electrification, industrial automation, and ICT infrastructure. The region’s emphasis on sustainability and safety compliance is accelerating the adoption of HIL systems for testing power electronics and grid-integrated devices. Meanwhile, Asia Pacific is emerging as a high-growth region, led by countries such as China, Japan, and India, where expanding EV production, industrial digitization, and defense modernization programs are driving new HIL use cases. With manufacturing hubs investing in smart validation technologies and government policies encouraging local innovation, Asia Pacific is expected to register one of the fastest CAGRs through 2032, making it a critical area for future investment.
By Loop Type (Open Loop HIL, Closed Loop HIL), By End-User (Automobile, Aerospace and Defense, Electronic Power, Scientific Research and Education, Other End-User)
Research Methodology
Primary Research- 100 Interviews of Stakeholders
Secondary Research
Desk Research
Regional scope
North America (United States, Canada, Mexico)
Latin America (Brazil, Argentina, Columbia)
East Asia And Pacific (China, Japan, South Korea, Australia, Cambodia, Fiji, Indonesia)
Sea And South Asia (India, Singapore, Thailand, Taiwan, Malaysia)
Eastern Europe (Poland, Russia, Czech Republic, Romania)
Western Europe (Germany, U.K., France, Spain, Itlay)
Middle East & Africa (GCC Countries, Egypt, Nigeria, South Africa, Israel)
Customization for segments, region/country-level will be provided. Moreover, additional customization can be done based on the requirements.
Pricing and Purchase Options
Avail customized purchase options to meet your exact research needs. We have three licenses to opt for: Single User License, Multi-User License (Up to 5 Users), Corporate Use License (Unlimited User and Printable PDF).
TABLE OF CONTENTS
1. EXECUTIVE SUMMARY
1.1. MARKET SNAPSHOT
1.2. KEY FINDINGS & INSIGHTS
1.3. ANALYST RECOMMENDATIONS
1.4. FUTURE OUTLOOK
2. RESEARCH METHODOLOGY
2.1. MARKET DEFINITION & SCOPE
2.2. RESEARCH OBJECTIVES: PRIMARY & SECONDARY DATA SOURCES
2.3. DATA COLLECTION SOURCES
2.3.1. COVERAGE OF 100+ PRIMARY RESEARCH/CONSULTATION CALLS WITH INDUSTRY STAKEHOLDERS
FIGURE 17 NORTH AMERICA FACILITY MANAGEMENT CURRENT AND FUTURE TYPE ANALYSIS, 2025–2034, (USD MILLION)
FIGURE 18 NORTH AMERICA FACILITY MANAGEMENT CURRENT AND FUTURE END USER ANALYSIS, 2025–2034, (USD MILLION)
FIGURE 19 MARKET SHARE BY COUNTRY
FIGURE 20 LATIN AMERICA FACILITY MANAGEMENT CURRENT AND FUTURE TYPE ANALYSIS, 2025–2034, (USD MILLION)
FIGURE 21 LATIN AMERICA FACILITY MANAGEMENT CURRENT AND FUTURE END USER ANALYSIS, 2025–2034, (USD MILLION)
FIGURE 22 MARKET SHARE BY COUNTRY
FIGURE 23 EASTERN EUROPE FACILITY MANAGEMENT CURRENT AND FUTURE TYPE ANALYSIS, 2025–2034, (USD MILLION)
FIGURE 24 EASTERN EUROPE FACILITY MANAGEMENT CURRENT AND FUTURE END USER ANALYSIS, 2025–2034, (USD MILLION)
FIGURE 25 MARKET SHARE BY COUNTRY
FIGURE 26 WESTERN EUROPE FACILITY MANAGEMENT CURRENT AND FUTURE TYPE ANALYSIS, 2025–2034, (USD MILLION)
FIGURE 27 WESTERN EUROPE FACILITY MANAGEMENT CURRENT AND FUTURE END USER ANALYSIS, 2025–2034, (USD MILLION)
FIGURE 28 MARKET SHARE BY COUNTRY
FIGURE 29 EAST ASIA AND PACIFIC FACILITY MANAGEMENT CURRENT AND FUTURE TYPE ANALYSIS, 2025–2034, (USD MILLION)
FIGURE 30 EAST ASIA AND PACIFIC FACILITY MANAGEMENT CURRENT AND FUTURE END USER ANALYSIS, 2025–2034, (USD MILLION)
FIGURE 31 MARKET SHARE BY COUNTRY
FIGURE 32 SEA AND SOUTH ASIA FACILITY MANAGEMENT CURRENT AND FUTURE TYPE ANALYSIS, 2025–2034, (USD MILLION)
FIGURE 33 SEA AND SOUTH ASIA FACILITY MANAGEMENT CURRENT AND FUTURE END USER ANALYSIS, 2025–2034, (USD MILLION)
FIGURE 34 MARKET SHARE BY COUNTRY
FIGURE 35 MIDDLE EAST AND AFRICA FACILITY MANAGEMENT CURRENT AND FUTURE TYPE ANALYSIS, 2025–2034, (USD MILLION)
FIGURE 36 MIDDLE EAST AND AFRICA FACILITY MANAGEMENT CURRENT AND FUTURE END USER ANALYSIS, 2025–2034, (USD MILLION)
FIGURE 37 NORTH AMERICA FACILITY MANAGEMENT CURRENT AND FUTURE MARKET VOLUME SHARE REGIONAL ANALYSIS, 2025–2034, (USD MILLION)
FIGURE 38 U.S. FACILITY MANAGEMENT CURRENT AND FUTURE TYPE ANALYSIS, 2025–2034, (USD MILLION)
FIGURE 39 U.S. FACILITY MANAGEMENT CURRENT AND FUTURE END USER ANALYSIS, 2025–2034, (USD MILLION)
FIGURE 40 CANADA FACILITY MANAGEMENT CURRENT AND FUTURE TYPE ANALYSIS, 2025–2034, (USD MILLION)
FIGURE 41 CANADA FACILITY MANAGEMENT CURRENT AND FUTURE END USER ANALYSIS, 2025–2034, (USD MILLION)
FIGURE 42 LATIN AMERICA FACILITY MANAGEMENT CURRENT AND FUTURE MARKET VOLUME SHARE REGIONAL ANALYSIS, 2025–2034, (USD MILLION)
FIGURE 43 MEXICO FACILITY MANAGEMENT CURRENT AND FUTURE TYPE ANALYSIS, 2025–2034, (USD MILLION)
FIGURE 44 MEXICO FACILITY MANAGEMENT CURRENT AND FUTURE END USER ANALYSIS, 2025–2034, (USD MILLION)
FIGURE 45 BRAZIL FACILITY MANAGEMENT CURRENT AND FUTURE TYPE ANALYSIS, 2025–2034, (USD MILLION)
FIGURE 46 BRAZIL FACILITY MANAGEMENT CURRENT AND FUTURE END USER ANALYSIS, 2025–2034, (USD MILLION)
FIGURE 47 ARGENTINA FACILITY MANAGEMENT CURRENT AND FUTURE TYPE ANALYSIS, 2025–2034, (USD MILLION)
FIGURE 48 ARGENTINA FACILITY MANAGEMENT CURRENT AND FUTURE END USER ANALYSIS, 2025–2034, (USD MILLION)
FIGURE 49 COLUMBIA FACILITY MANAGEMENT CURRENT AND FUTURE TYPE ANALYSIS, 2025–2034, (USD MILLION)
FIGURE 50 COLUMBIA FACILITY MANAGEMENT CURRENT AND FUTURE END USER ANALYSIS, 2025–2034, (USD MILLION)
FIGURE 51 REST OF LATIN AMERICA FACILITY MANAGEMENT CURRENT AND FUTURE TYPE ANALYSIS, 2025–2034, (USD MILLION)
FIGURE 52 REST OF LATIN AMERICA FACILITY MANAGEMENT CURRENT AND FUTURE END USER ANALYSIS, 2025–2034, (USD MILLION)
FIGURE 53 EASTERN EUROPE FACILITY MANAGEMENT CURRENT AND FUTURE MARKET VOLUME SHARE REGIONAL ANALYSIS, 2025–2034, (USD MILLION)
FIGURE 54 POLAND FACILITY MANAGEMENT CURRENT AND FUTURE TYPE ANALYSIS, 2025–2034, (USD MILLION)
FIGURE 55 POLAND FACILITY MANAGEMENT CURRENT AND FUTURE END USER ANALYSIS, 2025–2034, (USD MILLION)
FIGURE 56 RUSSIA FACILITY MANAGEMENT CURRENT AND FUTURE TYPE ANALYSIS, 2025–2034, (USD MILLION)
FIGURE 57 RUSSIA FACILITY MANAGEMENT CURRENT AND FUTURE END USER ANALYSIS, 2025–2034, (USD MILLION)
FIGURE 58 CZECH REPUBLIC FACILITY MANAGEMENT CURRENT AND FUTURE TYPE ANALYSIS, 2025–2034, (USD MILLION)
FIGURE 59 CZECH REPUBLIC FACILITY MANAGEMENT CURRENT AND FUTURE END USER ANALYSIS, 2025–2034, (USD MILLION)
FIGURE 60 ROMANIA FACILITY MANAGEMENT CURRENT AND FUTURE TYPE ANALYSIS, 2025–2034, (USD MILLION)
FIGURE 61 ROMANIA FACILITY MANAGEMENT CURRENT AND FUTURE END USER ANALYSIS, 2025–2034, (USD MILLION)
FIGURE 62 REST OF EASTERN EUROPE FACILITY MANAGEMENT CURRENT AND FUTURE TYPE ANALYSIS, 2025–2034, (USD MILLION)
FIGURE 63 REST OF EASTERN EUROPE FACILITY MANAGEMENT CURRENT AND FUTURE END USER ANALYSIS, 2025–2034, (USD MILLION)
FIGURE 64 WESTERN EUROPE FACILITY MANAGEMENT CURRENT AND FUTURE MARKET VOLUME SHARE REGIONAL ANALYSIS, 2025–2034, (USD MILLION)
FIGURE 65 GERMANY FACILITY MANAGEMENT CURRENT AND FUTURE TYPE ANALYSIS, 2025–2034, (USD MILLION)
FIGURE 66 GERMANY FACILITY MANAGEMENT CURRENT AND FUTURE END USER ANALYSIS, 2025–2034, (USD MILLION)
FIGURE 67 FRANCE FACILITY MANAGEMENT CURRENT AND FUTURE TYPE ANALYSIS, 2025–2034, (USD MILLION)
FIGURE 68 FRANCE FACILITY MANAGEMENT CURRENT AND FUTURE END USER ANALYSIS, 2025–2034, (USD MILLION)
FIGURE 69 UK FACILITY MANAGEMENT CURRENT AND FUTURE TYPE ANALYSIS, 2025–2034, (USD MILLION)
FIGURE 70 UK FACILITY MANAGEMENT CURRENT AND FUTURE END USER ANALYSIS, 2025–2034, (USD MILLION)
FIGURE 71 SPAIN FACILITY MANAGEMENT CURRENT AND FUTURE TYPE ANALYSIS, 2025–2034, (USD MILLION)
FIGURE 72 SPAIN FACILITY MANAGEMENT CURRENT AND FUTURE END USER ANALYSIS, 2025–2034, (USD MILLION)
FIGURE 73 ITALY FACILITY MANAGEMENT CURRENT AND FUTURE TYPE ANALYSIS, 2025–2034, (USD MILLION)
FIGURE 74 ITALY FACILITY MANAGEMENT CURRENT AND FUTURE END USER ANALYSIS, 2025–2034, (USD MILLION)
FIGURE 75 REST OF WESTERN EUROPE FACILITY MANAGEMENT CURRENT AND FUTURE TYPE ANALYSIS, 2025–2034, (USD MILLION)
FIGURE 76 REST OF WESTERN EUROPE FACILITY MANAGEMENT CURRENT AND FUTURE END USER ANALYSIS, 2025–2034, (USD MILLION)
FIGURE 77 EAST ASIA AND PACIFIC FACILITY MANAGEMENT CURRENT AND FUTURE MARKET VOLUME SHARE REGIONAL ANALYSIS, 2025–2034, (USD MILLION)
FIGURE 78 CHINA FACILITY MANAGEMENT CURRENT AND FUTURE TYPE ANALYSIS, 2025–2034, (USD MILLION)
FIGURE 79 CHINA FACILITY MANAGEMENT CURRENT AND FUTURE END USER ANALYSIS, 2025–2034, (USD MILLION)
FIGURE 80 JAPAN FACILITY MANAGEMENT CURRENT AND FUTURE TYPE ANALYSIS, 2025–2034, (USD MILLION)
FIGURE 81 JAPAN FACILITY MANAGEMENT CURRENT AND FUTURE END USER ANALYSIS, 2025–2034, (USD MILLION)
FIGURE 82 AUSTRALIA FACILITY MANAGEMENT CURRENT AND FUTURE TYPE ANALYSIS, 2025–2034, (USD MILLION)
FIGURE 83 AUSTRALIA FACILITY MANAGEMENT CURRENT AND FUTURE END USER ANALYSIS, 2025–2034, (USD MILLION)
FIGURE 84 CAMBODIA FACILITY MANAGEMENT CURRENT AND FUTURE TYPE ANALYSIS, 2025–2034, (USD MILLION)
FIGURE 85 CAMBODIA FACILITY MANAGEMENT CURRENT AND FUTURE END USER ANALYSIS, 2025–2034, (USD MILLION)
FIGURE 86 FIJI FACILITY MANAGEMENT CURRENT AND FUTURE TYPE ANALYSIS, 2025–2034, (USD MILLION)
FIGURE 87 FIJI FACILITY MANAGEMENT CURRENT AND FUTURE END USER ANALYSIS, 2025–2034, (USD MILLION)
FIGURE 88 INDONESIA FACILITY MANAGEMENT CURRENT AND FUTURE TYPE ANALYSIS, 2025–2034, (USD MILLION)
FIGURE 89 INDONESIA FACILITY MANAGEMENT CURRENT AND FUTURE END USER ANALYSIS, 2025–2034, (USD MILLION)
FIGURE 90 SOUTH KOREA FACILITY MANAGEMENT CURRENT AND FUTURE TYPE ANALYSIS, 2025–2034, (USD MILLION)
FIGURE 91 SOUTH KOREA FACILITY MANAGEMENT CURRENT AND FUTURE END USER ANALYSIS, 2025–2034, (USD MILLION)
FIGURE 92 REST OF EAST ASIA AND PACIFIC FACILITY MANAGEMENT CURRENT AND FUTURE TYPE ANALYSIS, 2025–2034, (USD MILLION)
FIGURE 93 REST OF EAST ASIA AND PACIFIC FACILITY MANAGEMENT CURRENT AND FUTURE END USER ANALYSIS, 2025–2034, (USD MILLION)
FIGURE 94 SEA AND SOUTH ASIA FACILITY MANAGEMENT CURRENT AND FUTURE MARKET VOLUME SHARE REGIONAL ANALYSIS, 2025–2034, (USD MILLION)
FIGURE 95 BANGLADESH FACILITY MANAGEMENT CURRENT AND FUTURE TYPE ANALYSIS, 2025–2034, (USD MILLION)
FIGURE 96 BANGLADESH FACILITY MANAGEMENT CURRENT AND FUTURE END USER ANALYSIS, 2025–2034, (USD MILLION)
FIGURE 97 NEW ZEALAND FACILITY MANAGEMENT CURRENT AND FUTURE TYPE ANALYSIS, 2025–2034, (USD MILLION)
FIGURE 98 NEW ZEALAND FACILITY MANAGEMENT CURRENT AND FUTURE END USER ANALYSIS, 2025–2034, (USD MILLION)
FIGURE 99 INDIA FACILITY MANAGEMENT CURRENT AND FUTURE TYPE ANALYSIS, 2025–2034, (USD MILLION)
FIGURE 100 INDIA FACILITY MANAGEMENT CURRENT AND FUTURE END USER ANALYSIS, 2025–2034, (USD MILLION)
FIGURE 101 SINGAPORE FACILITY MANAGEMENT CURRENT AND FUTURE TYPE ANALYSIS, 2025–2034, (USD MILLION)
FIGURE 102 SINGAPORE FACILITY MANAGEMENT CURRENT AND FUTURE END USER ANALYSIS, 2025–2034, (USD MILLION)
FIGURE 103 THAILAND FACILITY MANAGEMENT CURRENT AND FUTURE TYPE ANALYSIS, 2025–2034, (USD MILLION)
FIGURE 104 THAILAND FACILITY MANAGEMENT CURRENT AND FUTURE END USER ANALYSIS, 2025–2034, (USD MILLION)
FIGURE 105 TAIWAN FACILITY MANAGEMENT CURRENT AND FUTURE TYPE ANALYSIS, 2025–2034, (USD MILLION)
FIGURE 106 TAIWAN FACILITY MANAGEMENT CURRENT AND FUTURE END USER ANALYSIS, 2025–2034, (USD MILLION)
FIGURE 107 MALAYSIA FACILITY MANAGEMENT CURRENT AND FUTURE TYPE ANALYSIS, 2025–2034, (USD MILLION)
FIGURE 108 MALAYSIA FACILITY MANAGEMENT CURRENT AND FUTURE END USER ANALYSIS, 2025–2034, (USD MILLION)
FIGURE 109 REST OF SEA AND SOUTH ASIA FACILITY MANAGEMENT CURRENT AND FUTURE TYPE ANALYSIS, 2025–2034, (USD MILLION)
FIGURE 110 REST OF SEA AND SOUTH ASIA FACILITY MANAGEMENT CURRENT AND FUTURE END USER ANALYSIS, 2025–2034, (USD MILLION)
FIGURE 111 MIDDLE EAST AND AFRICA FACILITY MANAGEMENT CURRENT AND FUTURE MARKET VOLUME SHARE REGIONAL ANALYSIS, 2025–2034, (USD MILLION)
FIGURE 112 GCC COUNTRIES FACILITY MANAGEMENT CURRENT AND FUTURE TYPE ANALYSIS, 2025–2034, (USD MILLION)
FIGURE 113 GCC COUNTRIES FACILITY MANAGEMENT CURRENT AND FUTURE END USER ANALYSIS, 2025–2034, (USD MILLION)
FIGURE 114 SAUDI ARABIA FACILITY MANAGEMENT CURRENT AND FUTURE TYPE ANALYSIS, 2025–2034, (USD MILLION)
FIGURE 115 SAUDI ARABIA FACILITY MANAGEMENT CURRENT AND FUTURE END USER ANALYSIS, 2025–2034, (USD MILLION)
FIGURE 116 UAE FACILITY MANAGEMENT CURRENT AND FUTURE TYPE ANALYSIS, 2025–2034, (USD MILLION)
FIGURE 117 UAE FACILITY MANAGEMENT CURRENT AND FUTURE END USER ANALYSIS, 2025–2034, (USD MILLION)
FIGURE 118 BAHRAIN FACILITY MANAGEMENT CURRENT AND FUTURE TYPE ANALYSIS, 2025–2034, (USD MILLION)
FIGURE 119 BAHRAIN FACILITY MANAGEMENT CURRENT AND FUTURE END USER ANALYSIS, 2025–2034, (USD MILLION)
FIGURE 120 KUWAIT FACILITY MANAGEMENT CURRENT AND FUTURE TYPE ANALYSIS, 2025–2034, (USD MILLION)
FIGURE 121 KUWAIT FACILITY MANAGEMENT CURRENT AND FUTURE END USER ANALYSIS, 2025–2034, (USD MILLION)
FIGURE 122 OMAN FACILITY MANAGEMENT CURRENT AND FUTURE TYPE ANALYSIS, 2025–2034, (USD MILLION)
FIGURE 123 OMAN FACILITY MANAGEMENT CURRENT AND FUTURE END USER ANALYSIS, 2025–2034, (USD MILLION)
FIGURE 124 QATAR FACILITY MANAGEMENT CURRENT AND FUTURE TYPE ANALYSIS, 2025–2034, (USD MILLION)
FIGURE 125 QATAR FACILITY MANAGEMENT CURRENT AND FUTURE END USER ANALYSIS, 2025–2034, (USD MILLION)
FIGURE 126 EGYPT FACILITY MANAGEMENT CURRENT AND FUTURE TYPE ANALYSIS, 2025–2034, (USD MILLION)
FIGURE 127 EGYPT FACILITY MANAGEMENT CURRENT AND FUTURE END USER ANALYSIS, 2025–2034, (USD MILLION)
FIGURE 128 NIGERIA FACILITY MANAGEMENT CURRENT AND FUTURE TYPE ANALYSIS, 2025–2034, (USD MILLION)
FIGURE 129 NIGERIA FACILITY MANAGEMENT CURRENT AND FUTURE END USER ANALYSIS, 2025–2034, (USD MILLION)
FIGURE 130 SOUTH AFRICA FACILITY MANAGEMENT CURRENT AND FUTURE TYPE ANALYSIS, 2025–2034, (USD MILLION)
FIGURE 131 SOUTH AFRICA FACILITY MANAGEMENT CURRENT AND FUTURE END USER ANALYSIS, 2025–2034, (USD MILLION)
FIGURE 132 ISRAEL FACILITY MANAGEMENT CURRENT AND FUTURE TYPE ANALYSIS, 2025–2034, (USD MILLION)
FIGURE 133 ISRAEL FACILITY MANAGEMENT CURRENT AND FUTURE END USER ANALYSIS, 2025–2034, (USD MILLION)
FIGURE 134 REST OF MEA FACILITY MANAGEMENT CURRENT AND FUTURE TYPE ANALYSIS, 2025–2034, (USD MILLION)
FIGURE 135 REST OF MEA FACILITY MANAGEMENT CURRENT AND FUTURE END USER ANALYSIS, 2025–2034, (USD MILLION)
FIGURE 136 U. S. MARKET SHARE ANALYSIS BY TYPE (2024)
FIGURE 137 U. S. MARKET SHARE ANALYSIS BY END USER (2024)
FIGURE 138 CANADA MARKET SHARE ANALYSIS BY TYPE (2024)
FIGURE 139 CANADA MARKET SHARE ANALYSIS BY END USER (2024)
FIGURE 140 MEXICO MARKET SHARE ANALYSIS BY TYPE (2024)
FIGURE 141 MEXICO MARKET SHARE ANALYSIS BY END USER (2024)
FIGURE 142 CHINA MARKET SHARE ANALYSIS BY TYPE (2024)
FIGURE 143 CHINA MARKET SHARE ANALYSIS BY END USER (2024)
FIGURE 144 JAPAN MARKET SHARE ANALYSIS BY TYPE (2024)
FIGURE 145 JAPAN MARKET SHARE ANALYSIS BY END USER (2024)
FIGURE 146 INDIA MARKET SHARE ANALYSIS BY TYPE (2024)
FIGURE 147 INDIA MARKET SHARE ANALYSIS BY END USER (2024)
FIGURE 148 SOUTH KOREA MARKET SHARE ANALYSIS BY TYPE (2024)
FIGURE 149 SOUTH KOREA MARKET SHARE ANALYSIS BY END USER (2024)
FIGURE 150 SAUDI ARABIA MARKET SHARE ANALYSIS BY TYPE (2024)
FIGURE 151 SAUDI ARABIA MARKET SHARE ANALYSIS BY END USER (2024)
FIGURE 152 UAE MARKET SHARE ANALYSIS BY TYPE (2024)
FIGURE 153 UAE MARKET SHARE ANALYSIS BY END USER (2024)
FIGURE 154 EGYPT MARKET SHARE ANALYSIS BY TYPE (2024)
FIGURE 155 EGYPT MARKET SHARE ANALYSIS BY END USER (2024)
FIGURE 156 NIGERIA MARKET SHARE ANALYSIS BY TYPE (2024)
FIGURE 157 NIGERIA MARKET SHARE ANALYSIS BY END USER (2024)
FIGURE 158 SOUTH AFRICA MARKET SHARE ANALYSIS BY TYPE (2024)
FIGURE 159 SOUTH AFRICA MARKET SHARE ANALYSIS BY END USER (2024)
FIGURE 160 GERMANY MARKET SHARE ANALYSIS BY TYPE (2024)
FIGURE 161 GERMANY MARKET SHARE ANALYSIS BY END USER (2024)
FIGURE 162 FRANCE MARKET SHARE ANALYSIS BY TYPE (2024)
FIGURE 163 FRANCE MARKET SHARE ANALYSIS BY END USER (2024)
FIGURE 164 UK MARKET SHARE ANALYSIS BY TYPE (2024)
FIGURE 165 UK MARKET SHARE ANALYSIS BY END USER (2024)
FIGURE 166 SPAIN MARKET SHARE ANALYSIS BY TYPE (2024)
FIGURE 167 SPAIN MARKET SHARE ANALYSIS BY END USER (2024)
FIGURE 168 ITALY MARKET SHARE ANALYSIS BY TYPE (2024)
FIGURE 169 ITALY MARKET SHARE ANALYSIS BY END USER (2024)
FIGURE 170 BRAZIL MARKET SHARE ANALYSIS BY TYPE (2024)
FIGURE 171 BRAZIL MARKET SHARE ANALYSIS BY END USER (2024)
FIGURE 172 ARGENTINA MARKET SHARE ANALYSIS BY TYPE (2024)
FIGURE 173 ARGENTINA MARKET SHARE ANALYSIS BY END USER (2024)
FIGURE 174 COLUMBIA MARKET SHARE ANALYSIS BY TYPE (2024)
FIGURE 175 COLUMBIA MARKET SHARE ANALYSIS BY END USER (2024)
FIGURE 176 GLOBAL FACILITY MANAGEMENT CURRENT AND FUTURE MARKET KEY COUNTRY LEVEL ANALYSIS, 2024–2034, (USD MILLION)
FIGURE 177 FINANCIAL OVERVIEW:
Key Player Analysis
DSpace GmbH: DSpace GmbH is widely regarded as a market leader in the global Hardware-in-the-Loop (HIL) market, with a robust portfolio of real-time simulation systems and control prototyping tools tailored for automotive, aerospace, and industrial applications. The company’s flagship HIL platforms, such as SCALEXIO, offer modular, high-performance solutions that support advanced Electronic Control Unit (ECU) validation and autonomous vehicle testing. As of 2025, DSpace continues to invest heavily in 4th-generation HIL systems that enable ultra-low latency simulations for electric and autonomous vehicle environments.
Strategically, DSpace has strengthened its position through partnerships with OEMs and Tier 1 suppliers in Europe and North America, while expanding its presence in Asia-Pacific. The company’s ongoing R&D focus on supporting model-based development workflows and seamless integration with MATLAB/Simulink environments has made it a preferred vendor among engineering teams. Additionally, its growing alignment with ADAS and EV system validation keeps DSpace at the forefront of innovation in real-time embedded testing.
National Instruments (NI): National Instruments, now operating under the NI brand, positions itself as a global innovator in the HIL market, known for its flexible, open-platform architecture and powerful data acquisition systems. NI’s LabVIEW-based HIL solutions, combined with PXI hardware, have made the company a go-to provider for both prototyping and validation tasks across automotive, aerospace, and industrial sectors. In 2025, NI continues to enhance its offerings by integrating AI-driven analytics, cloud-based simulation environments, and real-time FPGA computing capabilities.
NI's strategic direction includes recent investments in digital twin development, enabling customers to simulate physical systems at scale before physical prototyping. The company has also expanded its partnerships with EV startups and aerospace R&D labs, positioning itself as a flexible partner in rapid system development. Its modular approach and scalable platforms offer a compelling value proposition for both multinational corporations and smaller engineering-driven firms, further solidifying its footprint in the evolving HIL ecosystem.
Vector Informatik: Vector Informatik is positioned as a niche yet highly specialized player in the HIL market, offering sophisticated tools for ECU testing, network simulation, and embedded software validation. With products such as VT System and CANoe, Vector supports automotive OEMs in testing embedded systems for real-time communication protocols like CAN, LIN, FlexRay, and Ethernet. As of 2025, the company is increasingly recognized for its role in enabling robust, end-to-end HIL setups in the context of automotive E/E architecture evolution.
Vector’s core strength lies in its deep domain expertise in automotive electronics and its close collaboration with leading car manufacturers in Europe and Asia. The company has also prioritized cybersecurity simulation and functional safety validation, which are becoming critical differentiators as vehicles become more software-defined. With a focus on compliance with ISO 26262 and ASPICE standards, Vector is well-positioned to capture growth from the rising demand for safety-critical systems testing in autonomous and electrified vehicles.
ETAS GmbH: ETAS GmbH, a subsidiary of the Bosch Group, operates as a strategic challenger in the HIL market, offering an integrated suite of tools and services for embedded system development. Its LABCAR family of HIL simulators is widely adopted for ECU testing in powertrain, chassis, and driver assistance systems. By 2025, ETAS has expanded its HIL portfolio to accommodate scalable real-time testing environments, particularly for the validation of battery management systems (BMS) and electric drivetrain components.
ETAS differentiates itself through tight integration with Bosch’s automotive innovation pipeline and a growing emphasis on software-defined vehicle architectures. The company’s strategic initiatives include increased investment in cloud-based simulation platforms, AI integration, and partnerships with semiconductor firms to accelerate controller development. With its commitment to delivering high-precision models and real-time co-simulation, ETAS continues to gain ground in both established and emerging HIL applications across Europe, China, and the U.
Market Key Players
Opal-RT Technologies
National Instruments
EON
Shanghai KeLiang InformationTechnology Co., Ltd.
DSpace GmbH
Ipg Automotive GmbH
Vector Informatik
HiRain Technologies
ETAS
MicroNova AG
Other Key Players
Driver:
Autonomous & EV Complexity Accelerates HIL Testing Adoption
As of 2025, the rising complexity of autonomous and electric vehicle (EV) systems is driving strong demand for Hardware-in-the-Loop (HIL) testing across the automotive industry. Automakers are integrating advanced functionalities such as collision avoidance, real-time sensor fusion, and ADAS (Advanced Driver Assistance Systems), all of which require robust testing frameworks before deployment. HIL enables real-time simulation and validation of ECUs, algorithms, and sensor inputs under variable and extreme conditions, significantly reducing on-road testing costs and safety risks.
OEM Investments Make HIL a Mission-Critical Validation Tool
Major investments underscore this shift: Continental AG has invested over USD 76 million in ADAS development, while the Hyundai–Aptiv JV continues to expand its autonomous driving platform in the U.S. Similarly, India’s Minus Zero raised USD 1.7 million to scale AI-driven autonomous systems. As OEMs and Tier 1 suppliers escalate development of self-driving and electric platforms, HIL becomes a mission-critical tool—accelerating validation cycles, ensuring compliance, and supporting innovation at scale.
Restraint:
High Costs & Technical Complexity Limit HIL Deployment
Despite its critical role, the adoption of HIL systems faces significant barriers, primarily due to high implementation costs and technical complexity. Developing a reliable HIL environment demands substantial upfront investment in real-time simulation hardware, advanced computing infrastructure, and sophisticated software models. For complex systems—such as microgrids, aircraft control systems, or vehicle dynamics—the need for ultra-low latency, high-speed processing, and highly detailed models significantly increases the cost and engineering burden.
Capital-Intensive Setups Restrict Adoption Among Smaller Firms
The total cost of ownership can reach hundreds of thousands of dollars per setup, especially when factoring in the customization and integration required for domain-specific applications. Moreover, companies need highly skilled personnel to configure, maintain, and operate these systems. This cost-intensive and resource-heavy nature limits adoption, particularly among small to mid-sized firms and startups that lack the financial flexibility for such capital-intensive deployments.
Opportunity:
Power Electronics & Robotics Open New Growth Avenues for HIL
Beyond traditional use cases in automotive and aerospace, the HIL market is expanding into power electronics and industrial robotics, where demand for real-time control validation and safety compliance is rising. In the power sector, HIL is increasingly deployed for grid stability simulations, inverter testing, and fault tolerance analysis—especially as utilities integrate renewables and distributed energy resources. These systems demand high-precision control under dynamic loads, making HIL a vital part of ensuring operational reliability.
HIL Enhances Reliability, Safety & Speed Across Emerging Industries
In industrial robotics, HIL systems enable manufacturers to validate robot motion controllers, embedded processors, and safety protocols in a simulated environment, reducing downtime and operational risks. With global demand for robotics expected to grow at a CAGR exceeding 10% through 2030, the intersection of robotics and HIL presents a compelling growth avenue. Manufacturers seeking faster development cycles, reduced field testing, and adherence to international safety standards are turning to HIL as a strategic solution.
Trend:
4th-Gen HIL Systems Transform High-Speed Power Electronics Testing
A transformative trend shaping the HIL market in 2025 is the rise of 4th-generation HIL systems, engineered to meet the increasingly stringent requirements of high-speed motor drives, wide-bandgap semiconductors (WBG), and advanced power electronics. These systems feature ultra-fast simulation cycles, nanosecond-level response times, and high-resolution modeling—supporting use cases such as EV inverters, aircraft power units, and next-gen robotics controllers.
Ultra-Fast, SiC/GaN-Ready HIL Platforms Redefine Next-Gen Engineering
As the adoption of SiC and GaN-based converters accelerates, traditional simulation platforms are no longer sufficient. The 4th-gen HIL frameworks offer lower loop-back latency, real-time gate driver interaction, and enhanced modeling of nonlinearities and spatial harmonics, enabling engineers to validate more complex architectures with precision. These advancements are vital for designing smarter, more efficient vehicles and machinery, cementing HIL’s role as a foundational tool in the development of high-performance, software-defined systems.
Recent Developments
Dec 2024 – National Instruments: NI launched a next-generation PXI-based HIL testing platform with integrated FPGA acceleration and real-time AI processing capabilities, targeting EV powertrain validation and aerospace control systems. The new system is projected to reduce test cycle times by up to 30%. This product expansion reinforces NI’s positioning in high-performance, scalable simulation environments for emerging mobility and defense applications.
Feb 2025 – DSpace GmbH: DSpace announced the opening of a new R&D facility in Tokyo, Japan, focused on enhancing simulation models for autonomous vehicle HIL applications. The center is expected to support over 100 engineers and expand R&D collaboration with Asian OEMs. This regional investment deepens DSpace’s presence in Asia-Pacific and supports the rising demand for localized HIL solutions.
Apr 2025 – ETAS GmbH: ETAS introduced a cloud-based extension to its LABCAR HIL platform, enabling remote test execution and model updates for distributed engineering teams. Early adopters reported 15–20% efficiency gains in development workflows. This innovation enhances ETAS’s competitiveness in flexible, software-defined vehicle development environments.
Jul 2025 – Vector Informatik: Vector announced a strategic partnership with Infineon Technologies to co-develop HIL modules for power electronics and e-mobility systems. The collaboration aims to integrate semiconductor-level behavior into real-time simulations for high-voltage EV components. This move positions Vector at the forefront of precision HIL validation in electrified mobility systems.
Sep 2025 – Siemens Digital Industries Software: Siemens entered the HIL market with the acquisition of SimuEdge Technologies, a startup specializing in high-speed simulation tools for robotic automation and grid systems. The deal, reportedly valued at over USD 140 million, expands Siemens’ Xcelerator portfolio. This acquisition marks Siemens’ entry as a serious disruptor in the HIL ecosystem, with ambitions to integrate digital twin capabilities across industrial and energy applications.

 Aerospace And Defence
 Agriculture
 Automotive And Transportation
 Banking And Finance
 Business
 Chemicals And Materials
 Consumer And Retail
 Electronics And Semiconductors
 Food And Beverages
 Machinery & Equipments
 Manufacturing And Construction
 Medical Devices
 Others
 Pharmaceuticals And Healthcare
 Power And Energy
 Sports
 Technology

, By End-User (Automobile, Aerospace and Defense, Electronic Power, Scientific Research and Education), Industry Regions & Key Players – Simulation & Testing Trends & Forecast 2025–2034")
, By End-User (Automobile, Aerospace and Defense, Electronic Power, Scientific Research and Education), Industry Regions & Key Players – Simulation & Testing Trends & Forecast 2025–2034")
, By End-User (Automobile, Aerospace and Defense, Electronic Power, Scientific Research and Education), Industry Regions & Key Players – Simulation & Testing Trends & Forecast 2025–2034")
, By End-User (Automobile, Aerospace and Defense, Electronic Power, Scientific Research and Education), Industry Regions & Key Players – Simulation & Testing Trends & Forecast 2025–2034")

