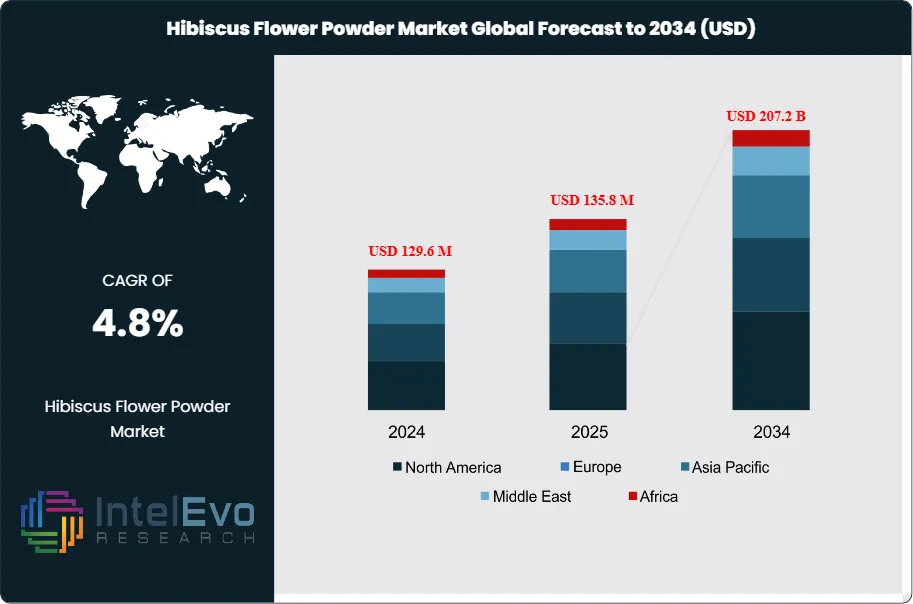
The Hibiscus Flower Powder Market was valued at USD 129.6 million in 2024 and is projected to reach approximately USD 135.8 million in 2025. The market is further expected to expand to nearly USD 207.2 million by 2034, registering a compound annual growth rate (CAGR) of about 4.8% during the forecast period from 2026 to 2034. Growth in the market is supported by rising consumer demand for natural herbal ingredients in food, beverages, cosmetics, and dietary supplements. Hibiscus flower powder is widely used for its antioxidant properties, natural coloring ability, and functional health benefits, particularly in herbal teas and wellness products. Additionally, increasing awareness of plant-based nutrition, organic products, and traditional herbal remedies is expected to further accelerate global demand for hibiscus-derived ingredients in the coming years.
Growth reflects steady expansion in functional beverages, dietary supplements, and plant-based personal care. Hibiscus sabdariffa powder benefits from strong consumer preference for naturally sourced ingredients with clear nutritional positioning, including antioxidant content, vitamin C, and flavonoids. Beverage and infusion applications account for an estimated 45% of 2024 revenue, supported by ready-to-mix tea blends and wellness drinks that value hibiscus for acidity, color, and flavor. Supplements represent about 30%, driven by immunity and metabolic wellness claims that typically sit within regulated structure–function frameworks. Cosmetics and personal care contribute roughly 20%, where formulators use hibiscus acids for exfoliation and brightening, while the remaining share links to culinary use and natural coloring in niche products.
Supply dynamics remain highly agricultural. Producers concentrate in Asia-Pacific and parts of Africa and Latin America, where growing conditions support consistent petal quality. Asia-Pacific holds an estimated 38% of global revenue, supported by sourcing and processing depth in India, China, Thailand, and Vietnam. North America accounts for around 27% and Europe about 23%, led by premiumization in wellness retail and clean-label beauty. Investment activity increasingly targets dehydration efficiency, microbial control, and standardized grind profiles, since color strength and bioactive retention influence pricing. Average price realizations vary by grade, with certified organic and residue-tested batches often carrying a 15–25% premium versus conventional material.
Regulatory pressure shapes both cost and route-to-market. Food safety management systems, allergen and contaminant testing, pesticide-residue compliance, and cosmetics ingredient restrictions raise qualification requirements and elevate documentation needs. Key risks include climate-driven yield volatility, adulteration and mislabeling in fragmented supply chains, and shipment delays that degrade color and potency. Technology adoption mitigates these pressures. Automated drying and milling improves batch consistency, while digital traceability systems support audit readiness. AI-enabled demand forecasting and quality analytics help processors align procurement with seasonal cycles, reduce waste, and protect margins. Emerging investment hotspots include India, Vietnam, Nigeria, and Egypt, where capacity additions and export-oriented compliance programs can improve reliability for global brand buyers.
Key Takeaways
Market Growth: The market grows at 4.8% CAGR, 2026-2034, reaching 197.7 million USD, 2034 from 129.6 million USD, 2024.
Segment Dominance : Conventional hibiscus powder leads with 75.6% share, 2024, supported by scale pricing and broad availability.
Segment Dominance: Food & Beverage leads end use with 47.6% share, 2024, driven by adoption in beverages and culinary formulations.
Driver: Wellness-led demand accelerates purchases through online channels at 26.5% share, 2024, supported by convenience and assortment breadth.
Restraint: Supply variability and quality standardization pressure margins at estimated: 3.0% cost inflation, 2024.
Opportunity: Premium and value-added formats expand pricing power at estimated: 18.0% revenue uplift, 2026, through organic and standardized antioxidant positioning.
Trend: Brands increase digital-first launches and performance marketing at estimated: 32.0% of new SKU launches, 2025, to capture health-focused buyers.
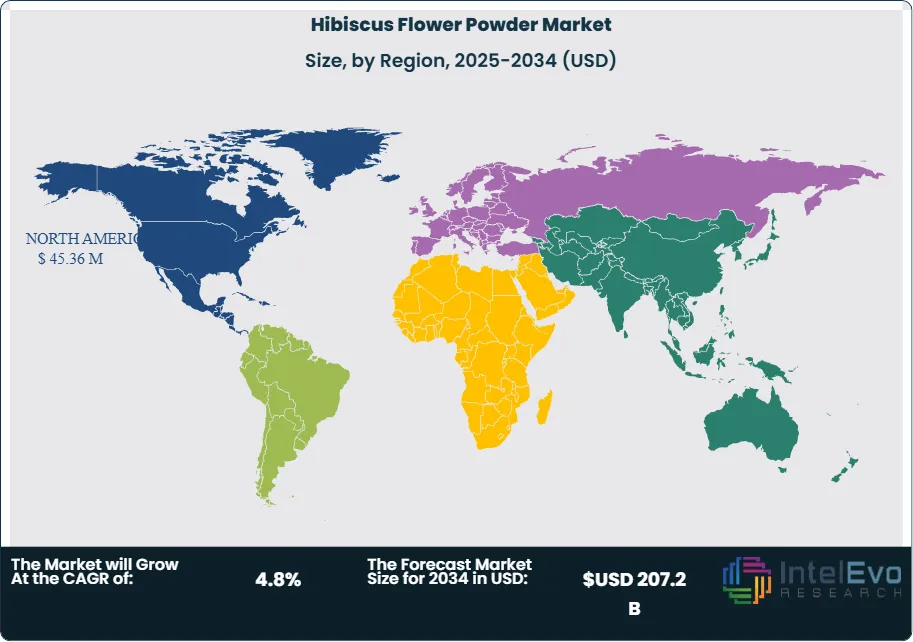
Regional Analysis: North America leads with 35.6% revenue share, 2024, supported by health-oriented consumption and diverse culinary use cases.
By Nature
Conventional hibiscus flower powder continues to account for the majority of global demand entering 2025, with its share estimated at approximately 74 to 76 percent of total volume. Producers favor conventional cultivation due to predictable yields, lower input costs, and established farming infrastructure across Asia Pacific, Africa, and parts of Latin America. These factors support consistent supply for large-scale food, beverage, and personal care manufacturers, where price stability and batch uniformity remain procurement priorities.
Standard agricultural practices allow faster scale-up and wider geographic distribution, which reinforces the dominance of conventional variants in mass-market applications. Most private-label tea brands, beverage concentrates, and cosmetic bases rely on conventional hibiscus powder to manage margins while meeting baseline quality specifications. Average pricing for conventional grades remains 18 to 25 percent lower than certified organic alternatives in 2025.
Organic hibiscus flower powder represents a smaller but steadily expanding segment. Growth remains strongest in North America and Europe, where clean-label positioning and residue-free sourcing influence purchasing decisions. Organic variants command premium pricing due to certification costs and lower yields, yet demand continues to rise in supplements and natural cosmetics, where buyers prioritize traceability and chemical-free cultivation.
By End-Use Industry
Food and beverage remains the largest end-use segment, accounting for nearly 48 percent of global revenue in 2025. Hibiscus powder sees widespread use in herbal infusions, functional beverages, syrups, and specialty bakery products, supported by its natural acidity, color stability, and antioxidant profile. Ready-to-mix beverages and wellness drinks drive incremental volume, particularly in urban retail channels.
Pharmaceutical and nutraceutical applications show moderate but consistent growth, supported by increased use of hibiscus extracts in supplements targeting blood pressure support, lipid balance, and metabolic health. Regulatory frameworks limit explicit health claims, yet demand persists through standardized formulations and ingredient-backed positioning.
Cosmetics and personal care applications continue to expand, with hibiscus powder integrated into exfoliating scrubs, masks, and botanical blends. Smaller volumes characterize this segment, but margins remain higher due to formulation-driven demand and premium branding.
By Distribution Channel
Online retail represents the fastest-growing distribution channel and accounts for roughly 27 percent of global sales in 2025. Direct-to-consumer platforms and health-focused marketplaces improve product visibility and enable access to niche organic and single-origin offerings. Subscription models and cross-border shipping further strengthen this channel.
Supermarkets and hypermarkets remain critical for volume sales, especially for conventional variants and private-label products. Their role centers on accessibility and impulse purchasing within routine grocery trips. Shelf presence continues to influence brand recognition among first-time buyers.
Specialty stores and health food outlets cater to informed consumers seeking organic certification and functional positioning. These channels support higher average selling prices and stronger customer loyalty, particularly in urban markets.
By Region
North America remains the leading regional market in 2025, representing approximately 35 percent of global revenue. Demand benefits from sustained interest in plant-based diets, functional beverages, and natural personal care. The United States leads consumption, while Canada shows steady import growth linked to health-oriented retail expansion.
Europe follows closely, driven by regulatory emphasis on ingredient transparency and organic certification. Germany, France, and the United Kingdom anchor regional demand, particularly in teas and supplements. Asia Pacific remains the primary production hub and a growing consumption market, supported by domestic processing capacity in India and China.
Latin America and the Middle East and Africa contribute smaller shares but offer long-term supply-side importance. These regions support cultivation and export growth as global buyers seek diversified sourcing and cost-efficient production beyond 2025.
By Nature (Conventional, Organic), By End-Use Industry (Food and Beverage, Pharmaceuticals, Cosmetics, Others), By Distribution Channel (Supermarkets and Hypermarkets, Specialty Stores, Health Food Stores, Online Retail)
Research Methodology
Primary Research- 100 Interviews of Stakeholders
Secondary Research
Desk Research
Regional scope
North America (United States, Canada, Mexico)
Latin America (Brazil, Argentina, Columbia)
East Asia And Pacific (China, Japan, South Korea, Australia, Cambodia, Fiji, Indonesia)
Sea And South Asia (India, Singapore, Thailand, Taiwan, Malaysia)
Eastern Europe (Poland, Russia, Czech Republic, Romania)
Western Europe (Germany, U.K., France, Spain, Itlay)
Middle East & Africa (GCC Countries, Egypt, Nigeria, South Africa, Israel)
Competitive Landscape
Rena Beverage Solutions, Traditional Medicinals, Bio Actives, Fortune Health Care, The Republic of Tea, Wild Hibiscus Flower Co., Herbeno Herbals, Bio Organic
Customization Scope
Customization for segments, region/country-level will be provided. Moreover, additional customization can be done based on the requirements.
Pricing and Purchase Options
Avail customized purchase options to meet your exact research needs. We have three licenses to opt for: Single User License, Multi-User License (Up to 5 Users), Corporate Use License (Unlimited User and Printable PDF).
TABLE OF CONTENTS
1. EXECUTIVE SUMMARY
1.1. MARKET SNAPSHOT
1.2. KEY FINDINGS & INSIGHTS
1.3. ANALYST RECOMMENDATIONS
1.4. FUTURE OUTLOOK
2. RESEARCH METHODOLOGY
2.1. MARKET DEFINITION & SCOPE
2.2. RESEARCH OBJECTIVES: PRIMARY & SECONDARY DATA SOURCES
2.3. DATA COLLECTION SOURCES
2.3.1. COVERAGE OF 100+ PRIMARY RESEARCH/CONSULTATION CALLS WITH INDUSTRY STAKEHOLDERS
FIGURE 17 NORTH AMERICA HIBISCUS FLOWER POWDER CURRENT AND FUTURE TYPE ANALYSIS, 2025–2034, (USD MILLION)
FIGURE 18 NORTH AMERICA HIBISCUS FLOWER POWDER CURRENT AND FUTURE END USER ANALYSIS, 2025–2034, (USD MILLION)
FIGURE 19 MARKET SHARE BY COUNTRY
FIGURE 20 LATIN AMERICA HIBISCUS FLOWER POWDER CURRENT AND FUTURE TYPE ANALYSIS, 2025–2034, (USD MILLION)
FIGURE 21 LATIN AMERICA HIBISCUS FLOWER POWDER CURRENT AND FUTURE END USER ANALYSIS, 2025–2034, (USD MILLION)
FIGURE 22 MARKET SHARE BY COUNTRY
FIGURE 23 EASTERN EUROPE HIBISCUS FLOWER POWDER CURRENT AND FUTURE TYPE ANALYSIS, 2025–2034, (USD MILLION)
FIGURE 24 EASTERN EUROPE HIBISCUS FLOWER POWDER CURRENT AND FUTURE END USER ANALYSIS, 2025–2034, (USD MILLION)
FIGURE 25 MARKET SHARE BY COUNTRY
FIGURE 26 WESTERN EUROPE HIBISCUS FLOWER POWDER CURRENT AND FUTURE TYPE ANALYSIS, 2025–2034, (USD MILLION)
FIGURE 27 WESTERN EUROPE HIBISCUS FLOWER POWDER CURRENT AND FUTURE END USER ANALYSIS, 2025–2034, (USD MILLION)
FIGURE 28 MARKET SHARE BY COUNTRY
FIGURE 29 EAST ASIA AND PACIFIC HIBISCUS FLOWER POWDER CURRENT AND FUTURE TYPE ANALYSIS, 2025–2034, (USD MILLION)
FIGURE 30 EAST ASIA AND PACIFIC HIBISCUS FLOWER POWDER CURRENT AND FUTURE END USER ANALYSIS, 2025–2034, (USD MILLION)
FIGURE 31 MARKET SHARE BY COUNTRY
FIGURE 32 SEA AND SOUTH ASIA HIBISCUS FLOWER POWDER CURRENT AND FUTURE TYPE ANALYSIS, 2025–2034, (USD MILLION)
FIGURE 33 SEA AND SOUTH ASIA HIBISCUS FLOWER POWDER CURRENT AND FUTURE END USER ANALYSIS, 2025–2034, (USD MILLION)
FIGURE 34 MARKET SHARE BY COUNTRY
FIGURE 35 MIDDLE EAST AND AFRICA HIBISCUS FLOWER POWDER CURRENT AND FUTURE TYPE ANALYSIS, 2025–2034, (USD MILLION)
FIGURE 36 MIDDLE EAST AND AFRICA HIBISCUS FLOWER POWDER CURRENT AND FUTURE END USER ANALYSIS, 2025–2034, (USD MILLION)
FIGURE 37 NORTH AMERICA HIBISCUS FLOWER POWDER CURRENT AND FUTURE MARKET VOLUME SHARE REGIONAL ANALYSIS, 2025–2034, (USD MILLION)
FIGURE 38 U.S. HIBISCUS FLOWER POWDER CURRENT AND FUTURE TYPE ANALYSIS, 2025–2034, (USD MILLION)
FIGURE 39 U.S. HIBISCUS FLOWER POWDER CURRENT AND FUTURE END USER ANALYSIS, 2025–2034, (USD MILLION)
FIGURE 40 CANADA HIBISCUS FLOWER POWDER CURRENT AND FUTURE TYPE ANALYSIS, 2025–2034, (USD MILLION)
FIGURE 41 CANADA HIBISCUS FLOWER POWDER CURRENT AND FUTURE END USER ANALYSIS, 2025–2034, (USD MILLION)
FIGURE 42 LATIN AMERICA HIBISCUS FLOWER POWDER CURRENT AND FUTURE MARKET VOLUME SHARE REGIONAL ANALYSIS, 2025–2034, (USD MILLION)
FIGURE 43 MEXICO HIBISCUS FLOWER POWDER CURRENT AND FUTURE TYPE ANALYSIS, 2025–2034, (USD MILLION)
FIGURE 44 MEXICO HIBISCUS FLOWER POWDER CURRENT AND FUTURE END USER ANALYSIS, 2025–2034, (USD MILLION)
FIGURE 45 BRAZIL HIBISCUS FLOWER POWDER CURRENT AND FUTURE TYPE ANALYSIS, 2025–2034, (USD MILLION)
FIGURE 46 BRAZIL HIBISCUS FLOWER POWDER CURRENT AND FUTURE END USER ANALYSIS, 2025–2034, (USD MILLION)
FIGURE 47 ARGENTINA HIBISCUS FLOWER POWDER CURRENT AND FUTURE TYPE ANALYSIS, 2025–2034, (USD MILLION)
FIGURE 48 ARGENTINA HIBISCUS FLOWER POWDER CURRENT AND FUTURE END USER ANALYSIS, 2025–2034, (USD MILLION)
FIGURE 49 COLUMBIA HIBISCUS FLOWER POWDER CURRENT AND FUTURE TYPE ANALYSIS, 2025–2034, (USD MILLION)
FIGURE 50 COLUMBIA HIBISCUS FLOWER POWDER CURRENT AND FUTURE END USER ANALYSIS, 2025–2034, (USD MILLION)
FIGURE 51 REST OF LATIN AMERICA HIBISCUS FLOWER POWDER CURRENT AND FUTURE TYPE ANALYSIS, 2025–2034, (USD MILLION)
FIGURE 52 REST OF LATIN AMERICA HIBISCUS FLOWER POWDER CURRENT AND FUTURE END USER ANALYSIS, 2025–2034, (USD MILLION)
FIGURE 53 EASTERN EUROPE HIBISCUS FLOWER POWDER CURRENT AND FUTURE MARKET VOLUME SHARE REGIONAL ANALYSIS, 2025–2034, (USD MILLION)
FIGURE 54 POLAND HIBISCUS FLOWER POWDER CURRENT AND FUTURE TYPE ANALYSIS, 2025–2034, (USD MILLION)
FIGURE 55 POLAND HIBISCUS FLOWER POWDER CURRENT AND FUTURE END USER ANALYSIS, 2025–2034, (USD MILLION)
FIGURE 56 RUSSIA HIBISCUS FLOWER POWDER CURRENT AND FUTURE TYPE ANALYSIS, 2025–2034, (USD MILLION)
FIGURE 57 RUSSIA HIBISCUS FLOWER POWDER CURRENT AND FUTURE END USER ANALYSIS, 2025–2034, (USD MILLION)
FIGURE 58 CZECH REPUBLIC HIBISCUS FLOWER POWDER CURRENT AND FUTURE TYPE ANALYSIS, 2025–2034, (USD MILLION)
FIGURE 59 CZECH REPUBLIC HIBISCUS FLOWER POWDER CURRENT AND FUTURE END USER ANALYSIS, 2025–2034, (USD MILLION)
FIGURE 60 ROMANIA HIBISCUS FLOWER POWDER CURRENT AND FUTURE TYPE ANALYSIS, 2025–2034, (USD MILLION)
FIGURE 61 ROMANIA HIBISCUS FLOWER POWDER CURRENT AND FUTURE END USER ANALYSIS, 2025–2034, (USD MILLION)
FIGURE 62 REST OF EASTERN EUROPE HIBISCUS FLOWER POWDER CURRENT AND FUTURE TYPE ANALYSIS, 2025–2034, (USD MILLION)
FIGURE 63 REST OF EASTERN EUROPE HIBISCUS FLOWER POWDER CURRENT AND FUTURE END USER ANALYSIS, 2025–2034, (USD MILLION)
FIGURE 64 WESTERN EUROPE HIBISCUS FLOWER POWDER CURRENT AND FUTURE MARKET VOLUME SHARE REGIONAL ANALYSIS, 2025–2034, (USD MILLION)
FIGURE 65 GERMANY HIBISCUS FLOWER POWDER CURRENT AND FUTURE TYPE ANALYSIS, 2025–2034, (USD MILLION)
FIGURE 66 GERMANY HIBISCUS FLOWER POWDER CURRENT AND FUTURE END USER ANALYSIS, 2025–2034, (USD MILLION)
FIGURE 67 FRANCE HIBISCUS FLOWER POWDER CURRENT AND FUTURE TYPE ANALYSIS, 2025–2034, (USD MILLION)
FIGURE 68 FRANCE HIBISCUS FLOWER POWDER CURRENT AND FUTURE END USER ANALYSIS, 2025–2034, (USD MILLION)
FIGURE 69 UK HIBISCUS FLOWER POWDER CURRENT AND FUTURE TYPE ANALYSIS, 2025–2034, (USD MILLION)
FIGURE 70 UK HIBISCUS FLOWER POWDER CURRENT AND FUTURE END USER ANALYSIS, 2025–2034, (USD MILLION)
FIGURE 71 SPAIN HIBISCUS FLOWER POWDER CURRENT AND FUTURE TYPE ANALYSIS, 2025–2034, (USD MILLION)
FIGURE 72 SPAIN HIBISCUS FLOWER POWDER CURRENT AND FUTURE END USER ANALYSIS, 2025–2034, (USD MILLION)
FIGURE 73 ITALY HIBISCUS FLOWER POWDER CURRENT AND FUTURE TYPE ANALYSIS, 2025–2034, (USD MILLION)
FIGURE 74 ITALY HIBISCUS FLOWER POWDER CURRENT AND FUTURE END USER ANALYSIS, 2025–2034, (USD MILLION)
FIGURE 75 REST OF WESTERN EUROPE HIBISCUS FLOWER POWDER CURRENT AND FUTURE TYPE ANALYSIS, 2025–2034, (USD MILLION)
FIGURE 76 REST OF WESTERN EUROPE HIBISCUS FLOWER POWDER CURRENT AND FUTURE END USER ANALYSIS, 2025–2034, (USD MILLION)
FIGURE 77 EAST ASIA AND PACIFIC HIBISCUS FLOWER POWDER CURRENT AND FUTURE MARKET VOLUME SHARE REGIONAL ANALYSIS, 2025–2034, (USD MILLION)
FIGURE 78 CHINA HIBISCUS FLOWER POWDER CURRENT AND FUTURE TYPE ANALYSIS, 2025–2034, (USD MILLION)
FIGURE 79 CHINA HIBISCUS FLOWER POWDER CURRENT AND FUTURE END USER ANALYSIS, 2025–2034, (USD MILLION)
FIGURE 80 JAPAN HIBISCUS FLOWER POWDER CURRENT AND FUTURE TYPE ANALYSIS, 2025–2034, (USD MILLION)
FIGURE 81 JAPAN HIBISCUS FLOWER POWDER CURRENT AND FUTURE END USER ANALYSIS, 2025–2034, (USD MILLION)
FIGURE 82 AUSTRALIA HIBISCUS FLOWER POWDER CURRENT AND FUTURE TYPE ANALYSIS, 2025–2034, (USD MILLION)
FIGURE 83 AUSTRALIA HIBISCUS FLOWER POWDER CURRENT AND FUTURE END USER ANALYSIS, 2025–2034, (USD MILLION)
FIGURE 84 CAMBODIA HIBISCUS FLOWER POWDER CURRENT AND FUTURE TYPE ANALYSIS, 2025–2034, (USD MILLION)
FIGURE 85 CAMBODIA HIBISCUS FLOWER POWDER CURRENT AND FUTURE END USER ANALYSIS, 2025–2034, (USD MILLION)
FIGURE 86 FIJI HIBISCUS FLOWER POWDER CURRENT AND FUTURE TYPE ANALYSIS, 2025–2034, (USD MILLION)
FIGURE 87 FIJI HIBISCUS FLOWER POWDER CURRENT AND FUTURE END USER ANALYSIS, 2025–2034, (USD MILLION)
FIGURE 88 INDONESIA HIBISCUS FLOWER POWDER CURRENT AND FUTURE TYPE ANALYSIS, 2025–2034, (USD MILLION)
FIGURE 89 INDONESIA HIBISCUS FLOWER POWDER CURRENT AND FUTURE END USER ANALYSIS, 2025–2034, (USD MILLION)
FIGURE 90 SOUTH KOREA HIBISCUS FLOWER POWDER CURRENT AND FUTURE TYPE ANALYSIS, 2025–2034, (USD MILLION)
FIGURE 91 SOUTH KOREA HIBISCUS FLOWER POWDER CURRENT AND FUTURE END USER ANALYSIS, 2025–2034, (USD MILLION)
FIGURE 92 REST OF EAST ASIA AND PACIFIC HIBISCUS FLOWER POWDER CURRENT AND FUTURE TYPE ANALYSIS, 2025–2034, (USD MILLION)
FIGURE 93 REST OF EAST ASIA AND PACIFIC HIBISCUS FLOWER POWDER CURRENT AND FUTURE END USER ANALYSIS, 2025–2034, (USD MILLION)
FIGURE 94 SEA AND SOUTH ASIA HIBISCUS FLOWER POWDER CURRENT AND FUTURE MARKET VOLUME SHARE REGIONAL ANALYSIS, 2025–2034, (USD MILLION)
FIGURE 95 BANGLADESH HIBISCUS FLOWER POWDER CURRENT AND FUTURE TYPE ANALYSIS, 2025–2034, (USD MILLION)
FIGURE 96 BANGLADESH HIBISCUS FLOWER POWDER CURRENT AND FUTURE END USER ANALYSIS, 2025–2034, (USD MILLION)
FIGURE 97 NEW ZEALAND HIBISCUS FLOWER POWDER CURRENT AND FUTURE TYPE ANALYSIS, 2025–2034, (USD MILLION)
FIGURE 98 NEW ZEALAND HIBISCUS FLOWER POWDER CURRENT AND FUTURE END USER ANALYSIS, 2025–2034, (USD MILLION)
FIGURE 99 INDIA HIBISCUS FLOWER POWDER CURRENT AND FUTURE TYPE ANALYSIS, 2025–2034, (USD MILLION)
FIGURE 100 INDIA HIBISCUS FLOWER POWDER CURRENT AND FUTURE END USER ANALYSIS, 2025–2034, (USD MILLION)
FIGURE 101 SINGAPORE HIBISCUS FLOWER POWDER CURRENT AND FUTURE TYPE ANALYSIS, 2025–2034, (USD MILLION)
FIGURE 102 SINGAPORE HIBISCUS FLOWER POWDER CURRENT AND FUTURE END USER ANALYSIS, 2025–2034, (USD MILLION)
FIGURE 103 THAILAND HIBISCUS FLOWER POWDER CURRENT AND FUTURE TYPE ANALYSIS, 2025–2034, (USD MILLION)
FIGURE 104 THAILAND HIBISCUS FLOWER POWDER CURRENT AND FUTURE END USER ANALYSIS, 2025–2034, (USD MILLION)
FIGURE 105 TAIWAN HIBISCUS FLOWER POWDER CURRENT AND FUTURE TYPE ANALYSIS, 2025–2034, (USD MILLION)
FIGURE 106 TAIWAN HIBISCUS FLOWER POWDER CURRENT AND FUTURE END USER ANALYSIS, 2025–2034, (USD MILLION)
FIGURE 107 MALAYSIA HIBISCUS FLOWER POWDER CURRENT AND FUTURE TYPE ANALYSIS, 2025–2034, (USD MILLION)
FIGURE 108 MALAYSIA HIBISCUS FLOWER POWDER CURRENT AND FUTURE END USER ANALYSIS, 2025–2034, (USD MILLION)
FIGURE 109 REST OF SEA AND SOUTH ASIA HIBISCUS FLOWER POWDER CURRENT AND FUTURE TYPE ANALYSIS, 2025–2034, (USD MILLION)
FIGURE 110 REST OF SEA AND SOUTH ASIA HIBISCUS FLOWER POWDER CURRENT AND FUTURE END USER ANALYSIS, 2025–2034, (USD MILLION)
FIGURE 111 MIDDLE EAST AND AFRICA HIBISCUS FLOWER POWDER CURRENT AND FUTURE MARKET VOLUME SHARE REGIONAL ANALYSIS, 2025–2034, (USD MILLION)
FIGURE 112 GCC COUNTRIES HIBISCUS FLOWER POWDER CURRENT AND FUTURE TYPE ANALYSIS, 2025–2034, (USD MILLION)
FIGURE 113 GCC COUNTRIES HIBISCUS FLOWER POWDER CURRENT AND FUTURE END USER ANALYSIS, 2025–2034, (USD MILLION)
FIGURE 114 SAUDI ARABIA HIBISCUS FLOWER POWDER CURRENT AND FUTURE TYPE ANALYSIS, 2025–2034, (USD MILLION)
FIGURE 115 SAUDI ARABIA HIBISCUS FLOWER POWDER CURRENT AND FUTURE END USER ANALYSIS, 2025–2034, (USD MILLION)
FIGURE 116 UAE HIBISCUS FLOWER POWDER CURRENT AND FUTURE TYPE ANALYSIS, 2025–2034, (USD MILLION)
FIGURE 117 UAE HIBISCUS FLOWER POWDER CURRENT AND FUTURE END USER ANALYSIS, 2025–2034, (USD MILLION)
FIGURE 118 BAHRAIN HIBISCUS FLOWER POWDER CURRENT AND FUTURE TYPE ANALYSIS, 2025–2034, (USD MILLION)
FIGURE 119 BAHRAIN HIBISCUS FLOWER POWDER CURRENT AND FUTURE END USER ANALYSIS, 2025–2034, (USD MILLION)
FIGURE 120 KUWAIT HIBISCUS FLOWER POWDER CURRENT AND FUTURE TYPE ANALYSIS, 2025–2034, (USD MILLION)
FIGURE 121 KUWAIT HIBISCUS FLOWER POWDER CURRENT AND FUTURE END USER ANALYSIS, 2025–2034, (USD MILLION)
FIGURE 122 OMAN HIBISCUS FLOWER POWDER CURRENT AND FUTURE TYPE ANALYSIS, 2025–2034, (USD MILLION)
FIGURE 123 OMAN HIBISCUS FLOWER POWDER CURRENT AND FUTURE END USER ANALYSIS, 2025–2034, (USD MILLION)
FIGURE 124 QATAR HIBISCUS FLOWER POWDER CURRENT AND FUTURE TYPE ANALYSIS, 2025–2034, (USD MILLION)
FIGURE 125 QATAR HIBISCUS FLOWER POWDER CURRENT AND FUTURE END USER ANALYSIS, 2025–2034, (USD MILLION)
FIGURE 126 EGYPT HIBISCUS FLOWER POWDER CURRENT AND FUTURE TYPE ANALYSIS, 2025–2034, (USD MILLION)
FIGURE 127 EGYPT HIBISCUS FLOWER POWDER CURRENT AND FUTURE END USER ANALYSIS, 2025–2034, (USD MILLION)
FIGURE 128 NIGERIA HIBISCUS FLOWER POWDER CURRENT AND FUTURE TYPE ANALYSIS, 2025–2034, (USD MILLION)
FIGURE 129 NIGERIA HIBISCUS FLOWER POWDER CURRENT AND FUTURE END USER ANALYSIS, 2025–2034, (USD MILLION)
FIGURE 130 SOUTH AFRICA HIBISCUS FLOWER POWDER CURRENT AND FUTURE TYPE ANALYSIS, 2025–2034, (USD MILLION)
FIGURE 131 SOUTH AFRICA HIBISCUS FLOWER POWDER CURRENT AND FUTURE END USER ANALYSIS, 2025–2034, (USD MILLION)
FIGURE 132 ISRAEL HIBISCUS FLOWER POWDER CURRENT AND FUTURE TYPE ANALYSIS, 2025–2034, (USD MILLION)
FIGURE 133 ISRAEL HIBISCUS FLOWER POWDER CURRENT AND FUTURE END USER ANALYSIS, 2025–2034, (USD MILLION)
FIGURE 134 REST OF MEA HIBISCUS FLOWER POWDER CURRENT AND FUTURE TYPE ANALYSIS, 2025–2034, (USD MILLION)
FIGURE 135 REST OF MEA HIBISCUS FLOWER POWDER CURRENT AND FUTURE END USER ANALYSIS, 2025–2034, (USD MILLION)
FIGURE 136 U. S. MARKET SHARE ANALYSIS BY TYPE (2025)
FIGURE 137 U. S. MARKET SHARE ANALYSIS BY END USER (2025)
FIGURE 138 CANADA MARKET SHARE ANALYSIS BY TYPE (2025)
FIGURE 139 CANADA MARKET SHARE ANALYSIS BY END USER (2025)
FIGURE 140 MEXICO MARKET SHARE ANALYSIS BY TYPE (2025)
FIGURE 141 MEXICO MARKET SHARE ANALYSIS BY END USER (2025)
FIGURE 142 CHINA MARKET SHARE ANALYSIS BY TYPE (2025)
FIGURE 143 CHINA MARKET SHARE ANALYSIS BY END USER (2025)
FIGURE 144 JAPAN MARKET SHARE ANALYSIS BY TYPE (2025)
FIGURE 145 JAPAN MARKET SHARE ANALYSIS BY END USER (2025)
FIGURE 146 INDIA MARKET SHARE ANALYSIS BY TYPE (2025)
FIGURE 147 INDIA MARKET SHARE ANALYSIS BY END USER (2025)
FIGURE 148 SOUTH KOREA MARKET SHARE ANALYSIS BY TYPE (2025)
FIGURE 149 SOUTH KOREA MARKET SHARE ANALYSIS BY END USER (2025)
FIGURE 150 SAUDI ARABIA MARKET SHARE ANALYSIS BY TYPE (2025)
FIGURE 151 SAUDI ARABIA MARKET SHARE ANALYSIS BY END USER (2025)
FIGURE 152 UAE MARKET SHARE ANALYSIS BY TYPE (2025)
FIGURE 153 UAE MARKET SHARE ANALYSIS BY END USER (2025)
FIGURE 154 EGYPT MARKET SHARE ANALYSIS BY TYPE (2025)
FIGURE 155 EGYPT MARKET SHARE ANALYSIS BY END USER (2025)
FIGURE 156 NIGERIA MARKET SHARE ANALYSIS BY TYPE (2025)
FIGURE 157 NIGERIA MARKET SHARE ANALYSIS BY END USER (2025)
FIGURE 158 SOUTH AFRICA MARKET SHARE ANALYSIS BY TYPE (2025)
FIGURE 159 SOUTH AFRICA MARKET SHARE ANALYSIS BY END USER (2025)
FIGURE 160 GERMANY MARKET SHARE ANALYSIS BY TYPE (2025)
FIGURE 161 GERMANY MARKET SHARE ANALYSIS BY END USER (2025)
FIGURE 162 FRANCE MARKET SHARE ANALYSIS BY TYPE (2025)
FIGURE 163 FRANCE MARKET SHARE ANALYSIS BY END USER (2025)
FIGURE 164 UK MARKET SHARE ANALYSIS BY TYPE (2025)
FIGURE 165 UK MARKET SHARE ANALYSIS BY END USER (2025)
FIGURE 166 SPAIN MARKET SHARE ANALYSIS BY TYPE (2025)
FIGURE 167 SPAIN MARKET SHARE ANALYSIS BY END USER (2025)
FIGURE 168 ITALY MARKET SHARE ANALYSIS BY TYPE (2025)
FIGURE 169 ITALY MARKET SHARE ANALYSIS BY END USER (2025)
FIGURE 170 BRAZIL MARKET SHARE ANALYSIS BY TYPE (2025)
FIGURE 171 BRAZIL MARKET SHARE ANALYSIS BY END USER (2025)
FIGURE 172 ARGENTINA MARKET SHARE ANALYSIS BY TYPE (2025)
FIGURE 173 ARGENTINA MARKET SHARE ANALYSIS BY END USER (2025)
FIGURE 174 COLUMBIA MARKET SHARE ANALYSIS BY TYPE (2025)
FIGURE 175 COLUMBIA MARKET SHARE ANALYSIS BY END USER (2025)
FIGURE 176 GLOBAL HIBISCUS FLOWER POWDER CURRENT AND FUTURE MARKET KEY COUNTRY LEVEL ANALYSIS, 2025–2034, (USD MILLION)
FIGURE 177 FINANCIAL OVERVIEW:
Key Player Analysis
Herbeno Herbals: Herbeno Herbals operates as a niche-to-emerging challenger in the hibiscus flower powder market, with a strong focus on botanical powders, herbal teas, and plant-based wellness ingredients. The company positions itself toward health-conscious consumers and small to mid-sized food, beverage, and supplement brands seeking consistent quality at competitive pricing. Hibiscus flower powder forms part of its broader dried-flower and herbal powder portfolio, supplying applications across teas, functional blends, and cosmetic-grade formulations.
From a strategic perspective, Herbeno Herbals emphasizes sourcing depth and processing control. By 2025, the company has expanded supplier partnerships across India and parts of Southeast Asia to stabilize raw material availability amid climate-driven volatility. Internal investments in low-temperature drying and standardized grinding improve color retention and antioxidant consistency, which remain key buyer specifications. Sustainability-oriented sourcing and transparent batch documentation differentiate Herbeno in export markets, particularly among private-label wellness brands in North America and Europe.
The Republic of Tea: The Republic of Tea holds a strong brand-led position as a category leader within premium herbal and functional tea segments. Hibiscus flower powder and hibiscus-based blends play a strategic role in its caffeine-free and wellness-focused tea lines. The company benefits from high brand recognition, direct-to-consumer reach, and a loyal customer base that values ingredient clarity and functional positioning.
Strategically, the company continues to expand wellness-oriented SKUs tied to heart health, hydration, and antioxidant intake. In 2025, functional herbal teas represent an estimated 35 percent of its total portfolio, with hibiscus featured prominently in red tea and fruit-infused blends. Digital subscription sales and specialty retail partnerships support margin stability despite higher ingredient costs. The Republic of Tea differentiates through formulation expertise, consistent sensory profiles, and strong educational messaging that converts ingredient awareness into repeat purchases.
Traditional Medicinals: Traditional Medicinals positions itself as a science-aligned herbal specialist with deep credibility in medicinal plant use. Hibiscus flower powder and hibiscus extracts feature in targeted tea formulations associated with cardiovascular support and metabolic balance. The company operates firmly in the evidence-backed herbal segment, appealing to consumers who prioritize clinical validation and regulatory-compliant claims.
By 2025, Traditional Medicinals continues to allocate significant resources toward ingredient testing, traceability, and supplier verification. Its R&D-led approach includes ongoing review of clinical literature and standardized formulation protocols. Herbal teas remain its core revenue driver, with hibiscus-containing products contributing to growth within the heart health category, which expands at an estimated 6 percent annually. Strong practitioner endorsement, certification rigor, and long-standing retail relationships differentiate the company from lifestyle-focused tea brands and reinforce its position among premium herbal players.
Market Key Players
Rena Beverage Solutions
Traditional Medicinals
Bio Actives
Fortune Health Care
The Republic of Tea
Wild Hibiscus Flower Co.
Herbeno Herbals
Bio Organic
Driver:
Rising Demand for Antioxidant-Rich Functional Botanicals
In 2025, rising consumer focus on preventive health continues to expand demand for hibiscus flower powder across food, beverage, supplement, and personal care categories. You see this shift in purchasing data from functional ingredients, where antioxidant-rich botanicals post mid-single-digit growth. Hibiscus benefits from its anthocyanin content and its association with cardiovascular support. Clinical literature linking hibiscus intake to reductions of 7 to 10 mmHg in systolic blood pressure among adults with mild hypertension supports adoption in heart-health formulations. This evidence-based positioning strengthens acceptance among wellness-focused consumers.
Expanding Use of Hibiscus in Food, Beverage, and Skincare Products
The ingredient’s flexibility further reinforces demand. You can integrate hibiscus powder into teas, ready-to-mix drinks, gummies, and skin formulations without complex reformulation. Beauty brands also continue to adopt hibiscus for vitamin C content that supports collagen synthesis. By 2025, botanical actives in skincare account for an estimated 28 percent of new product launches globally, creating steady pull-through demand and reinforcing long-term market stability.
Restraint:
Limited Consumer Awareness in Emerging Markets
Outside regions with established cultural consumption, consumer familiarity remains uneven. In North America and Western Europe, awareness of hibiscus beyond herbal tea remains limited compared to turmeric or matcha, which enjoy household penetration rates above 40 percent. You encounter slower trial rates where product education is weak and shelf placement does not clearly communicate benefits.
Strong Competition from Established Superfood Ingredients
Brand competition intensifies this constraint. Established superfoods benefit from years of marketing investment and standardized claims, while hibiscus often lacks unified positioning. This affects velocity in retail channels and raises customer acquisition costs by an estimated 12 to 15 percent for new hibiscus-based launches. Without sustained education and simplified formats, adoption remains concentrated among niche wellness consumers rather than the mass market.
Opportunity:
Growth in Functional Beverage and Nutraceutical Applications
Functional beverages and nutraceuticals represent the most attractive growth avenue through 2030. You are operating in a segment where global functional beverage sales exceed USD 170 billion in 2025, expanding at roughly 6.5 percent annually. Hibiscus powder aligns well with this demand due to its natural acidity, color stability, and association with heart and metabolic health.
Expanding Demand for Clean-Label Botanical Supplements
Supplement applications offer similar upside. Immune-support and cardiometabolic supplements account for more than 45 percent of botanical supplement sales. Hibiscus fits clean-label expectations and allows differentiation without synthetic additives. Companies that invest in standardized extracts and dosage-backed claims can unlock premium pricing and expand B2B supply contracts with beverage and supplement manufacturers.
Trend:
Increasing Adoption in Plant-Based and Vegan Food Products
Plant-based and vegan product development continues to shape ingredient selection in 2025. You see hibiscus powder increasingly used as both a functional ingredient and a natural colorant in dairy alternatives, vegan desserts, and fortified drinks. Plant-based food launches now account for over 18 percent of new global food SKUs, supporting consistent demand growth.
Rising Use in Natural and Cruelty-Free Cosmetic Formulations
The trend extends into cruelty-free cosmetics. Botanical exfoliants and acid-based actives gain share as consumers avoid synthetic ingredients. Hibiscus powder supports this shift with mild exfoliating properties and antioxidant content. Social commerce and creator-led wellness education accelerate visibility, positioning hibiscus as a versatile botanical aligned with long-term dietary and personal care preferences.
Recent Developments
Dec 2024 – World Health Organization: Participants from 85 countries adopted the Beijing Declaration at the 2024 World Conference on Traditional Medicine, with an agenda that emphasized evidence-based integration, standardization, and artificial intelligence applications in traditional medicine research. Strategic impact: It increased regulatory and scientific momentum behind botanicals, supporting higher compliance spend and stronger substantiation for hibiscus-based nutraceutical and functional beverage claims in 2025–2034 pipelines.
Jan 2025 – Traditional Medicinals: The company marked its 50-year milestone and outlined a 2030 sourcing target of 80% of herbal ingredients from fair-certified origins, while also signaling product line expansion via an anniversary blend and Stress Ease line extensions. Strategic impact: It tightened differentiation around traceable sourcing and portfolio breadth, which tends to lift premium mix and strengthens shelf position in natural and specialty retail.
May 2025 – Traditional Medicinals: The company released its 2024 impact report and disclosed that 99% of herbs purchased were certified organic, nearly 40% were sourced from fair-certified partners, and fair premiums exceeded USD 328,000, alongside over USD 2.6 million in impact dollars. Strategic impact: It reinforced buyer confidence in auditability and supply continuity, which supports long-term contracts for hibiscus-containing blends and private-label programs.
Jun 2025 – Traditional Medicinals: Franklin County approved a performance agreement tied to a USD 47 million herbal tea manufacturing and processing plant that is expected to create 57 jobs, with average annual salary above USD 70,657 and construction targeted for completion in 2026. Strategic impact: It expanded U.S. processing capacity and improved service levels for high-velocity botanicals, reducing lead-time risk for hibiscus tea and powder formats.
Jul 2025 – The Republic of Tea: The company reintroduced a limited-edition Cranberry Hibiscus Iced Tea for Hallmark Channel’s Christmas in July, priced at USD 9.25 with “about 25 cents per cup,” using eight large pouches designed for at-home preparation. Strategic impact: It strengthened seasonal demand capture and supported premiumization through limited-run merchandising tied to entertainment partnerships.
Sep 2025 – Traditional Medicinals: The company launched Rosy Mood and Stress Ease Calm as its first Fair for Life-certified teas, disclosed over USD 20 million in community investment over the past decade, and reiterated its 80% fair-certified sourcing goal by 2030; the Rosy Mood blend also highlighted a color-shifting brew effect linked to hibiscus pigments. Strategic impact: It connected product design to verified sourcing credentials, improving willingness-to-pay and raising the bar for certification-led competition in hibiscus-forward blends.
Frequently Asked Questions
How big is the Hibiscus Flower Powder Market?
Global Hibiscus Flower Powder Market was valued at USD 129.6 million in 2024 and is projected to reach USD 207.2 million by 2034, growing at a CAGR of 4.8%. Explore trends, demand drivers, applications, and future market opportunities.
Who are the major players in the Hibiscus Flower Powder Market?
Rena Beverage Solutions, Traditional Medicinals, Bio Actives, Fortune Health Care, The Republic of Tea, Wild Hibiscus Flower Co., Herbeno Herbals, Bio Organic
Which segments covered the Hibiscus Flower Powder Market?
By Nature (Conventional, Organic), By End-Use Industry (Food and Beverage, Pharmaceuticals, Cosmetics, Others), By Distribution Channel (Supermarkets and Hypermarkets, Specialty Stores, Health Food Stores, Online Retail)
How can this market research report help my business make strategic decisions?
Our market research reports provide actionable intelligence, including verified market size data, CAGR projections, competitive benchmarking, and segment-level opportunity analysis. These insights support strategic planning, investment decisions, product development, and market entry strategies for enterprises and startups alike.
How frequently is the data updated?
We continuously monitor industry developments and update our reports to reflect regulatory changes, technological advancements, and macroeconomic shifts. Updated editions ensure you receive the latest market intelligence.