Home Appliance Rental Apps Market Size 2034 | 16.1% CAGR
Global Home Appliance Rental Apps Market Size, Share, Analysis Report By Product Type(Washing Machine, Refrigerator, Air Purifier, Television, Microwave, Water Purifier/Water Dispenser, Air Conditioner, Others)By Rental Duration(Long-Term Rentals, Short-Term Rentals)By End-Use(Commercial, Residential) Industry Region and Key Players-Industry Segment Overview, Market Dynamics, Competitive Strategies, Trends and Forecast 2025-2034
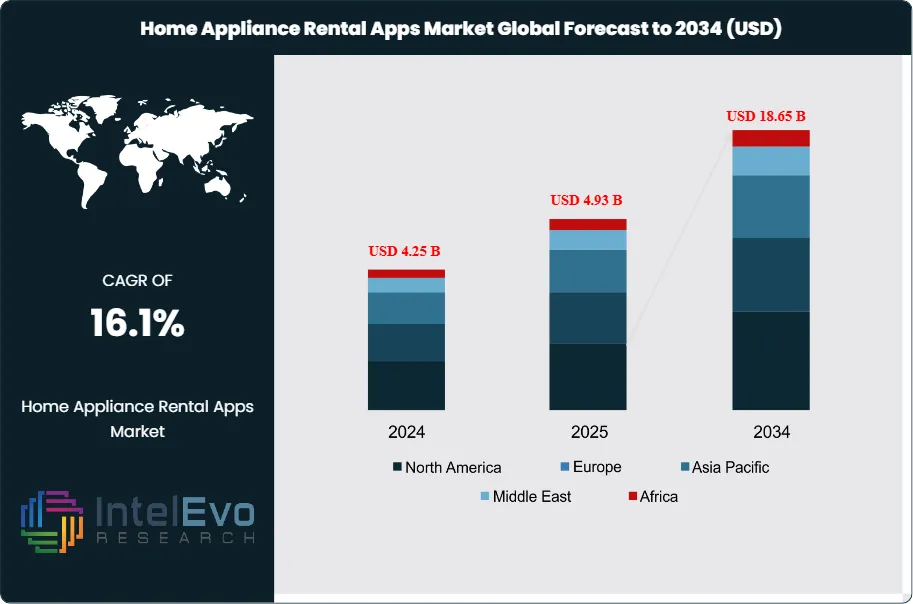
The Home Appliance Rental Apps Market size is projected to reach approximately USD 18.65 Billion by 2034, up from USD 4.25 Billion in 2024, growing at a strong CAGR of 16.1% during the forecast period from 2025 to 2034. With the rise of the sharing economy, digital transformation, and increasing consumer preference for flexible and cost-effective home solutions, rental apps are rapidly reshaping the global appliance industry. This trend is gaining massive traction among millennials and urban professionals, driving a surge in short-term appliance rentals and subscription-based ownership models across emerging and developed markets alike.
The home appliance rental apps market represents a dynamic segment of the sharing economy that has transformed how consumers access essential household appliances. This market encompasses digital platforms that facilitate the rental of various home appliances including washing machines, refrigerators, air purifiers, televisions, microwaves, water purifiers, air conditioners, and other household equipment. The market is driven by several key factors including the growing preference for flexible ownership models, rising urbanization, increasing disposable income among millennials and Gen Z consumers, and the proliferation of smartphone adoption. The subscription-based model offers consumers the advantage of accessing high-quality appliances without the burden of large upfront investments, while also providing maintenance and replacement services that enhance the overall value proposition.
Market dynamics are significantly influenced by changing consumer behavior patterns, particularly among young urban professionals who prioritize convenience and flexibility over traditional ownership models. The rise of nuclear families, frequent relocations due to job changes, and the growing awareness of environmental sustainability have contributed to the market's expansion. Additionally, technological advancements in mobile applications, IoT integration, and digital payment systems have streamlined the rental process, making it more accessible and user-friendly. The market also benefits from the increasing penetration of e-commerce platforms and the growing trust in online service providers, which has facilitated the adoption of appliance rental services across different demographic segments.
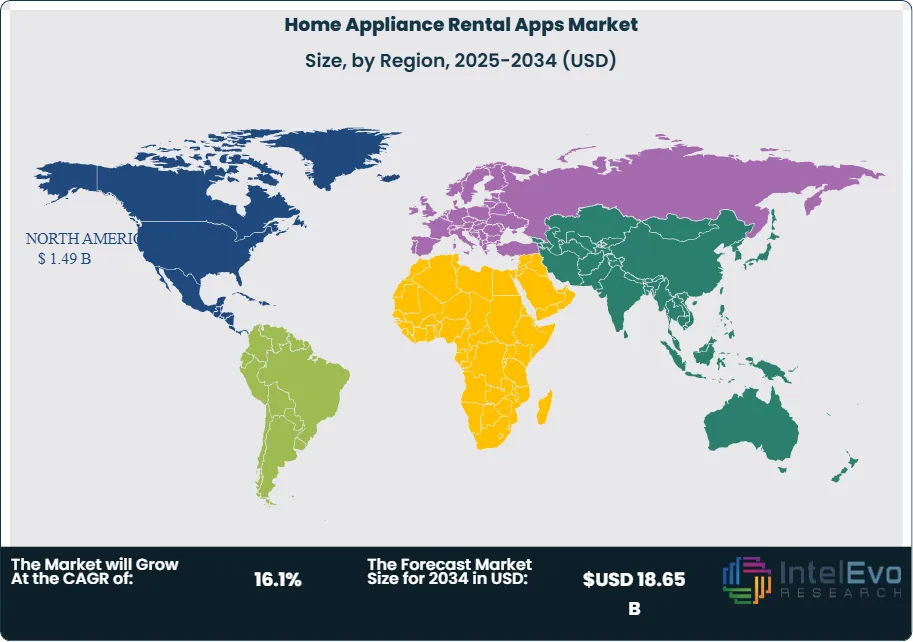
The North American region dominates the global home appliance rental apps market due to high smartphone penetration, advanced digital infrastructure, and strong consumer acceptance of sharing economy models. The region's mature e-commerce ecosystem and well-established logistics networks provide a solid foundation for appliance rental services to flourish.
The COVID-19 pandemic significantly impacted the home appliance rental apps market, initially causing disruptions in supply chains and delivery services. However, the pandemic also accelerated the adoption of digital services as consumers increasingly turned to online platforms for their household needs. The extended periods of remote work and home-based activities increased the demand for home appliances, particularly air purifiers, washing machines, and kitchen appliances, driving growth in the rental market as consumers sought cost-effective solutions.
Key Takeaways
Market Growth: The Home Appliance Rental Apps Market is expected to reach USD 18.65 Billion by 2034, fueled by rising consumer demand for affordable, flexible living solutions and the proliferation of app-based rental services.
Product Type Dominance: Refrigerators remain the leading product category due to their essential utility in both residential and commercial settings. The demand is especially high among urban dwellers who prefer renting high-end refrigerators to avoid large upfront costs.
Rental Duration Dominance: Long-term rentals account for the largest share, as customers increasingly opt for year-long or multi-year rental agreements that provide better value, hassle-free maintenance, and convenience over time.
End-Use Dominance: The residential sector dominates the market because of increasing home relocation, urban migration, and the growing trend of asset-light living among young professionals and nuclear families.
Driver: The market is primarily driven by the shift toward flexible consumption models and the growing preference for asset-light living among younger demographics. Rising urbanization and increasing mobility of the workforce create sustained demand for temporary and flexible appliance solutions.
Restraint: Market growth is constrained by consumer concerns regarding hygiene and the quality of used appliances, along with the long-term cost implications of rental versus purchase. Traditional ownership mindsets in certain demographic segments also pose challenges to market expansion.
Opportunity: Significant opportunities exist in expanding into emerging markets with growing middle-class populations and increasing digitalization. The integration of smart home technologies and IoT-enabled appliances presents avenues for premium service offerings and enhanced customer experiences.
Trend: The market is witnessing a trend toward sustainability-focused rental models and the integration of artificial intelligence for personalized appliance recommendations. Subscription-based models with flexible terms and add-on services are becoming increasingly popular among service providers.
Regional Analysis: North America maintains market leadership due to advanced digital infrastructure and high consumer acceptance of sharing economy models. The Asia-Pacific region shows the highest growth potential driven by rapid urbanization and increasing smartphone penetration in emerging economies.
Product Type Analysis:
Refrigerators are the most dominant product category in the home appliance rental apps market. Their indispensable role in modern living makes them a priority rental appliance for both residential and commercial users. Many consumers find purchasing high-capacity or energy-efficient refrigerators prohibitively expensive. Rental apps bridge this affordability gap by offering premium models at a fraction of the cost, bundled with maintenance and free upgrades. The surge in working professionals relocating to urban centers, co-living spaces, and shared accommodations has contributed significantly to the sustained demand for refrigerator rentals. Additionally, seasonal requirements, such as festivals or temporary housing, further bolster the segment’s relevance. Providers like Rentomojo and Furlenco have capitalized on this demand by offering flexible plans, sanitized products, and doorstep delivery, which attract both new and repeat customers.
Rental Duration Analysis:
Long-Term Rentals Leads With more than 60% Market Share In Home Appliance Rental Apps Market, Long-term rentals are the market’s backbone, driven by customer preference for stability, predictable monthly expenses, and reduced logistic hassles. Consumers increasingly favor 12-24 month contracts, as these arrangements offer cost benefits, consistent service support, and options to upgrade or buy out appliances. Businesses such as co-working spaces, hostels, and small offices also prefer long-term rental contracts to furnish premises without significant capital expenditure. Rental companies benefit from these contracts as they ensure predictable cash flow and higher asset utilization. The trend has been further cemented by subscription models, wherein customers pay monthly installments that cover appliance maintenance and insurance. The post-COVID landscape reinforced this preference, as households sought stability while managing tight budgets, making long-term rentals a compelling proposition.
End-Use Analysis:
The residential end-use segment is the largest contributor to market revenue, accounting for a substantial share of total demand. Rising urbanization, frequent relocations, and the popularity of rental homes have led consumers to rent instead of buying appliances outright. Young professionals, expatriates, and nuclear families appreciate the convenience of rental services, which eliminate transportation and maintenance worries. Subscription-based rentals allow them to customize their living spaces without long-term commitments. The rise of co-living and shared accommodation has further spurred residential rentals, with customers prioritizing affordability and convenience. Providers have responded by offering bundled packages that combine essential appliances with flexible payment options, driving rapid adoption in metropolitan areas.
Region Analysis:
North America Leads With over 35% Market Share In Home Appliance Rental Apps Market. North America is the leading region, accounting for the highest market share. The U.S. and Canada have a mature rental ecosystem with widespread acceptance of subscription models and digital rental apps. High smartphone penetration, robust e-commerce infrastructure, and favorable consumer attitudes toward flexible consumption fuel continued growth. The region also benefits from a high degree of urbanization and a sizable renter population.
Europe follows closely, driven by sustainability trends and the popularity of circular economy practices. Countries like the UK, Germany, and France have witnessed increased adoption among young professionals and eco-conscious consumers who prefer renting refurbished appliances over purchasing new ones.
Asia Pacific is projected to be the fastest-growing market, with India as a key growth engine. Rapid urbanization, a growing middle class, and the proliferation of start-ups like Furlenco and Rentickle have significantly accelerated market penetration. Latin America and the Middle East are emerging markets with high potential, particularly among millennials embracing digital-first lifestyles. In the future, Asia Pacific will likely witness the strongest growth in residential long-term refrigerator rentals, owing to rising disposable incomes and housing mobility.
Customization for segments, region/country-level will be provided. Moreover, additional customization can be done based on the requirements.
Pricing and Purchase Options
Avail customized purchase options to meet your exact research needs. We have three licenses to opt for: Single User License, Multi-User License (Up to 5 Users), Corporate Use License (Unlimited User and Printable PDF).
TABLE OF CONTENTS
1. EXECUTIVE SUMMARY
1.1. MARKET SNAPSHOT
1.2. KEY FINDINGS & INSIGHTS
1.3. ANALYST RECOMMENDATIONS
1.4. FUTURE OUTLOOK
2. RESEARCH METHODOLOGY
2.1. MARKET DEFINITION & SCOPE
2.2. RESEARCH OBJECTIVES: PRIMARY & SECONDARY DATA SOURCES
2.3. DATA COLLECTION SOURCES
2.3.1. COVERAGE OF 100+ PRIMARY RESEARCH/CONSULTATION CALLS WITH INDUSTRY STAKEHOLDERS
FIGURE 17 NORTH AMERICA HOME APPLIANCE RENTAL APPS CURRENT AND FUTURE TYPE ANALYSIS, 2025–2034, (USD MILLION)
FIGURE 18 NORTH AMERICA HOME APPLIANCE RENTAL APPS CURRENT AND FUTURE END USER ANALYSIS, 2025–2034, (USD MILLION)
FIGURE 19 MARKET SHARE BY COUNTRY
FIGURE 20 LATIN AMERICA HOME APPLIANCE RENTAL APPS CURRENT AND FUTURE TYPE ANALYSIS, 2025–2034, (USD MILLION)
FIGURE 21 LATIN AMERICA HOME APPLIANCE RENTAL APPS CURRENT AND FUTURE END USER ANALYSIS, 2025–2034, (USD MILLION)
FIGURE 22 MARKET SHARE BY COUNTRY
FIGURE 23 EASTERN EUROPE HOME APPLIANCE RENTAL APPS CURRENT AND FUTURE TYPE ANALYSIS, 2025–2034, (USD MILLION)
FIGURE 24 EASTERN EUROPE HOME APPLIANCE RENTAL APPS CURRENT AND FUTURE END USER ANALYSIS, 2025–2034, (USD MILLION)
FIGURE 25 MARKET SHARE BY COUNTRY
FIGURE 26 WESTERN EUROPE HOME APPLIANCE RENTAL APPS CURRENT AND FUTURE TYPE ANALYSIS, 2025–2034, (USD MILLION)
FIGURE 27 WESTERN EUROPE HOME APPLIANCE RENTAL APPS CURRENT AND FUTURE END USER ANALYSIS, 2025–2034, (USD MILLION)
FIGURE 28 MARKET SHARE BY COUNTRY
FIGURE 29 EAST ASIA AND PACIFIC HOME APPLIANCE RENTAL APPS CURRENT AND FUTURE TYPE ANALYSIS, 2025–2034, (USD MILLION)
FIGURE 30 EAST ASIA AND PACIFIC HOME APPLIANCE RENTAL APPS CURRENT AND FUTURE END USER ANALYSIS, 2025–2034, (USD MILLION)
FIGURE 31 MARKET SHARE BY COUNTRY
FIGURE 32 SEA AND SOUTH ASIA HOME APPLIANCE RENTAL APPS CURRENT AND FUTURE TYPE ANALYSIS, 2025–2034, (USD MILLION)
FIGURE 33 SEA AND SOUTH ASIA HOME APPLIANCE RENTAL APPS CURRENT AND FUTURE END USER ANALYSIS, 2025–2034, (USD MILLION)
FIGURE 34 MARKET SHARE BY COUNTRY
FIGURE 35 MIDDLE EAST AND AFRICA HOME APPLIANCE RENTAL APPS CURRENT AND FUTURE TYPE ANALYSIS, 2025–2034, (USD MILLION)
FIGURE 36 MIDDLE EAST AND AFRICA HOME APPLIANCE RENTAL APPS CURRENT AND FUTURE END USER ANALYSIS, 2025–2034, (USD MILLION)
FIGURE 37 NORTH AMERICA HOME APPLIANCE RENTAL APPS CURRENT AND FUTURE MARKET VOLUME SHARE REGIONAL ANALYSIS, 2025–2034, (USD MILLION)
FIGURE 38 U.S. HOME APPLIANCE RENTAL APPS CURRENT AND FUTURE TYPE ANALYSIS, 2025–2034, (USD MILLION)
FIGURE 39 U.S. HOME APPLIANCE RENTAL APPS CURRENT AND FUTURE END USER ANALYSIS, 2025–2034, (USD MILLION)
FIGURE 40 CANADA HOME APPLIANCE RENTAL APPS CURRENT AND FUTURE TYPE ANALYSIS, 2025–2034, (USD MILLION)
FIGURE 41 CANADA HOME APPLIANCE RENTAL APPS CURRENT AND FUTURE END USER ANALYSIS, 2025–2034, (USD MILLION)
FIGURE 42 LATIN AMERICA HOME APPLIANCE RENTAL APPS CURRENT AND FUTURE MARKET VOLUME SHARE REGIONAL ANALYSIS, 2025–2034, (USD MILLION)
FIGURE 43 MEXICO HOME APPLIANCE RENTAL APPS CURRENT AND FUTURE TYPE ANALYSIS, 2025–2034, (USD MILLION)
FIGURE 44 MEXICO HOME APPLIANCE RENTAL APPS CURRENT AND FUTURE END USER ANALYSIS, 2025–2034, (USD MILLION)
FIGURE 45 BRAZIL HOME APPLIANCE RENTAL APPS CURRENT AND FUTURE TYPE ANALYSIS, 2025–2034, (USD MILLION)
FIGURE 46 BRAZIL HOME APPLIANCE RENTAL APPS CURRENT AND FUTURE END USER ANALYSIS, 2025–2034, (USD MILLION)
FIGURE 47 ARGENTINA HOME APPLIANCE RENTAL APPS CURRENT AND FUTURE TYPE ANALYSIS, 2025–2034, (USD MILLION)
FIGURE 48 ARGENTINA HOME APPLIANCE RENTAL APPS CURRENT AND FUTURE END USER ANALYSIS, 2025–2034, (USD MILLION)
FIGURE 49 COLUMBIA HOME APPLIANCE RENTAL APPS CURRENT AND FUTURE TYPE ANALYSIS, 2025–2034, (USD MILLION)
FIGURE 50 COLUMBIA HOME APPLIANCE RENTAL APPS CURRENT AND FUTURE END USER ANALYSIS, 2025–2034, (USD MILLION)
FIGURE 51 REST OF LATIN AMERICA HOME APPLIANCE RENTAL APPS CURRENT AND FUTURE TYPE ANALYSIS, 2025–2034, (USD MILLION)
FIGURE 52 REST OF LATIN AMERICA HOME APPLIANCE RENTAL APPS CURRENT AND FUTURE END USER ANALYSIS, 2025–2034, (USD MILLION)
FIGURE 53 EASTERN EUROPE HOME APPLIANCE RENTAL APPS CURRENT AND FUTURE MARKET VOLUME SHARE REGIONAL ANALYSIS, 2025–2034, (USD MILLION)
FIGURE 54 POLAND HOME APPLIANCE RENTAL APPS CURRENT AND FUTURE TYPE ANALYSIS, 2025–2034, (USD MILLION)
FIGURE 55 POLAND HOME APPLIANCE RENTAL APPS CURRENT AND FUTURE END USER ANALYSIS, 2025–2034, (USD MILLION)
FIGURE 56 RUSSIA HOME APPLIANCE RENTAL APPS CURRENT AND FUTURE TYPE ANALYSIS, 2025–2034, (USD MILLION)
FIGURE 57 RUSSIA HOME APPLIANCE RENTAL APPS CURRENT AND FUTURE END USER ANALYSIS, 2025–2034, (USD MILLION)
FIGURE 58 CZECH REPUBLIC HOME APPLIANCE RENTAL APPS CURRENT AND FUTURE TYPE ANALYSIS, 2025–2034, (USD MILLION)
FIGURE 59 CZECH REPUBLIC HOME APPLIANCE RENTAL APPS CURRENT AND FUTURE END USER ANALYSIS, 2025–2034, (USD MILLION)
FIGURE 60 ROMANIA HOME APPLIANCE RENTAL APPS CURRENT AND FUTURE TYPE ANALYSIS, 2025–2034, (USD MILLION)
FIGURE 61 ROMANIA HOME APPLIANCE RENTAL APPS CURRENT AND FUTURE END USER ANALYSIS, 2025–2034, (USD MILLION)
FIGURE 62 REST OF EASTERN EUROPE HOME APPLIANCE RENTAL APPS CURRENT AND FUTURE TYPE ANALYSIS, 2025–2034, (USD MILLION)
FIGURE 63 REST OF EASTERN EUROPE HOME APPLIANCE RENTAL APPS CURRENT AND FUTURE END USER ANALYSIS, 2025–2034, (USD MILLION)
FIGURE 64 WESTERN EUROPE HOME APPLIANCE RENTAL APPS CURRENT AND FUTURE MARKET VOLUME SHARE REGIONAL ANALYSIS, 2025–2034, (USD MILLION)
FIGURE 65 GERMANY HOME APPLIANCE RENTAL APPS CURRENT AND FUTURE TYPE ANALYSIS, 2025–2034, (USD MILLION)
FIGURE 66 GERMANY HOME APPLIANCE RENTAL APPS CURRENT AND FUTURE END USER ANALYSIS, 2025–2034, (USD MILLION)
FIGURE 67 FRANCE HOME APPLIANCE RENTAL APPS CURRENT AND FUTURE TYPE ANALYSIS, 2025–2034, (USD MILLION)
FIGURE 68 FRANCE HOME APPLIANCE RENTAL APPS CURRENT AND FUTURE END USER ANALYSIS, 2025–2034, (USD MILLION)
FIGURE 69 UK HOME APPLIANCE RENTAL APPS CURRENT AND FUTURE TYPE ANALYSIS, 2025–2034, (USD MILLION)
FIGURE 70 UK HOME APPLIANCE RENTAL APPS CURRENT AND FUTURE END USER ANALYSIS, 2025–2034, (USD MILLION)
FIGURE 71 SPAIN HOME APPLIANCE RENTAL APPS CURRENT AND FUTURE TYPE ANALYSIS, 2025–2034, (USD MILLION)
FIGURE 72 SPAIN HOME APPLIANCE RENTAL APPS CURRENT AND FUTURE END USER ANALYSIS, 2025–2034, (USD MILLION)
FIGURE 73 ITALY HOME APPLIANCE RENTAL APPS CURRENT AND FUTURE TYPE ANALYSIS, 2025–2034, (USD MILLION)
FIGURE 74 ITALY HOME APPLIANCE RENTAL APPS CURRENT AND FUTURE END USER ANALYSIS, 2025–2034, (USD MILLION)
FIGURE 75 REST OF WESTERN EUROPE HOME APPLIANCE RENTAL APPS CURRENT AND FUTURE TYPE ANALYSIS, 2025–2034, (USD MILLION)
FIGURE 76 REST OF WESTERN EUROPE HOME APPLIANCE RENTAL APPS CURRENT AND FUTURE END USER ANALYSIS, 2025–2034, (USD MILLION)
FIGURE 77 EAST ASIA AND PACIFIC HOME APPLIANCE RENTAL APPS CURRENT AND FUTURE MARKET VOLUME SHARE REGIONAL ANALYSIS, 2025–2034, (USD MILLION)
FIGURE 78 CHINA HOME APPLIANCE RENTAL APPS CURRENT AND FUTURE TYPE ANALYSIS, 2025–2034, (USD MILLION)
FIGURE 79 CHINA HOME APPLIANCE RENTAL APPS CURRENT AND FUTURE END USER ANALYSIS, 2025–2034, (USD MILLION)
FIGURE 80 JAPAN HOME APPLIANCE RENTAL APPS CURRENT AND FUTURE TYPE ANALYSIS, 2025–2034, (USD MILLION)
FIGURE 81 JAPAN HOME APPLIANCE RENTAL APPS CURRENT AND FUTURE END USER ANALYSIS, 2025–2034, (USD MILLION)
FIGURE 82 AUSTRALIA HOME APPLIANCE RENTAL APPS CURRENT AND FUTURE TYPE ANALYSIS, 2025–2034, (USD MILLION)
FIGURE 83 AUSTRALIA HOME APPLIANCE RENTAL APPS CURRENT AND FUTURE END USER ANALYSIS, 2025–2034, (USD MILLION)
FIGURE 84 CAMBODIA HOME APPLIANCE RENTAL APPS CURRENT AND FUTURE TYPE ANALYSIS, 2025–2034, (USD MILLION)
FIGURE 85 CAMBODIA HOME APPLIANCE RENTAL APPS CURRENT AND FUTURE END USER ANALYSIS, 2025–2034, (USD MILLION)
FIGURE 86 FIJI HOME APPLIANCE RENTAL APPS CURRENT AND FUTURE TYPE ANALYSIS, 2025–2034, (USD MILLION)
FIGURE 87 FIJI HOME APPLIANCE RENTAL APPS CURRENT AND FUTURE END USER ANALYSIS, 2025–2034, (USD MILLION)
FIGURE 88 INDONESIA HOME APPLIANCE RENTAL APPS CURRENT AND FUTURE TYPE ANALYSIS, 2025–2034, (USD MILLION)
FIGURE 89 INDONESIA HOME APPLIANCE RENTAL APPS CURRENT AND FUTURE END USER ANALYSIS, 2025–2034, (USD MILLION)
FIGURE 90 SOUTH KOREA HOME APPLIANCE RENTAL APPS CURRENT AND FUTURE TYPE ANALYSIS, 2025–2034, (USD MILLION)
FIGURE 91 SOUTH KOREA HOME APPLIANCE RENTAL APPS CURRENT AND FUTURE END USER ANALYSIS, 2025–2034, (USD MILLION)
FIGURE 92 REST OF EAST ASIA AND PACIFIC HOME APPLIANCE RENTAL APPS CURRENT AND FUTURE TYPE ANALYSIS, 2025–2034, (USD MILLION)
FIGURE 93 REST OF EAST ASIA AND PACIFIC HOME APPLIANCE RENTAL APPS CURRENT AND FUTURE END USER ANALYSIS, 2025–2034, (USD MILLION)
FIGURE 94 SEA AND SOUTH ASIA HOME APPLIANCE RENTAL APPS CURRENT AND FUTURE MARKET VOLUME SHARE REGIONAL ANALYSIS, 2025–2034, (USD MILLION)
FIGURE 95 BANGLADESH HOME APPLIANCE RENTAL APPS CURRENT AND FUTURE TYPE ANALYSIS, 2025–2034, (USD MILLION)
FIGURE 96 BANGLADESH HOME APPLIANCE RENTAL APPS CURRENT AND FUTURE END USER ANALYSIS, 2025–2034, (USD MILLION)
FIGURE 97 NEW ZEALAND HOME APPLIANCE RENTAL APPS CURRENT AND FUTURE TYPE ANALYSIS, 2025–2034, (USD MILLION)
FIGURE 98 NEW ZEALAND HOME APPLIANCE RENTAL APPS CURRENT AND FUTURE END USER ANALYSIS, 2025–2034, (USD MILLION)
FIGURE 99 INDIA HOME APPLIANCE RENTAL APPS CURRENT AND FUTURE TYPE ANALYSIS, 2025–2034, (USD MILLION)
FIGURE 100 INDIA HOME APPLIANCE RENTAL APPS CURRENT AND FUTURE END USER ANALYSIS, 2025–2034, (USD MILLION)
FIGURE 101 SINGAPORE HOME APPLIANCE RENTAL APPS CURRENT AND FUTURE TYPE ANALYSIS, 2025–2034, (USD MILLION)
FIGURE 102 SINGAPORE HOME APPLIANCE RENTAL APPS CURRENT AND FUTURE END USER ANALYSIS, 2025–2034, (USD MILLION)
FIGURE 103 THAILAND HOME APPLIANCE RENTAL APPS CURRENT AND FUTURE TYPE ANALYSIS, 2025–2034, (USD MILLION)
FIGURE 104 THAILAND HOME APPLIANCE RENTAL APPS CURRENT AND FUTURE END USER ANALYSIS, 2025–2034, (USD MILLION)
FIGURE 105 TAIWAN HOME APPLIANCE RENTAL APPS CURRENT AND FUTURE TYPE ANALYSIS, 2025–2034, (USD MILLION)
FIGURE 106 TAIWAN HOME APPLIANCE RENTAL APPS CURRENT AND FUTURE END USER ANALYSIS, 2025–2034, (USD MILLION)
FIGURE 107 MALAYSIA HOME APPLIANCE RENTAL APPS CURRENT AND FUTURE TYPE ANALYSIS, 2025–2034, (USD MILLION)
FIGURE 108 MALAYSIA HOME APPLIANCE RENTAL APPS CURRENT AND FUTURE END USER ANALYSIS, 2025–2034, (USD MILLION)
FIGURE 109 REST OF SEA AND SOUTH ASIA HOME APPLIANCE RENTAL APPS CURRENT AND FUTURE TYPE ANALYSIS, 2025–2034, (USD MILLION)
FIGURE 110 REST OF SEA AND SOUTH ASIA HOME APPLIANCE RENTAL APPS CURRENT AND FUTURE END USER ANALYSIS, 2025–2034, (USD MILLION)
FIGURE 111 MIDDLE EAST AND AFRICA HOME APPLIANCE RENTAL APPS CURRENT AND FUTURE MARKET VOLUME SHARE REGIONAL ANALYSIS, 2025–2034, (USD MILLION)
FIGURE 112 GCC COUNTRIES HOME APPLIANCE RENTAL APPS CURRENT AND FUTURE TYPE ANALYSIS, 2025–2034, (USD MILLION)
FIGURE 113 GCC COUNTRIES HOME APPLIANCE RENTAL APPS CURRENT AND FUTURE END USER ANALYSIS, 2025–2034, (USD MILLION)
FIGURE 114 SAUDI ARABIA HOME APPLIANCE RENTAL APPS CURRENT AND FUTURE TYPE ANALYSIS, 2025–2034, (USD MILLION)
FIGURE 115 SAUDI ARABIA HOME APPLIANCE RENTAL APPS CURRENT AND FUTURE END USER ANALYSIS, 2025–2034, (USD MILLION)
FIGURE 116 UAE HOME APPLIANCE RENTAL APPS CURRENT AND FUTURE TYPE ANALYSIS, 2025–2034, (USD MILLION)
FIGURE 117 UAE HOME APPLIANCE RENTAL APPS CURRENT AND FUTURE END USER ANALYSIS, 2025–2034, (USD MILLION)
FIGURE 118 BAHRAIN HOME APPLIANCE RENTAL APPS CURRENT AND FUTURE TYPE ANALYSIS, 2025–2034, (USD MILLION)
FIGURE 119 BAHRAIN HOME APPLIANCE RENTAL APPS CURRENT AND FUTURE END USER ANALYSIS, 2025–2034, (USD MILLION)
FIGURE 120 KUWAIT HOME APPLIANCE RENTAL APPS CURRENT AND FUTURE TYPE ANALYSIS, 2025–2034, (USD MILLION)
FIGURE 121 KUWAIT HOME APPLIANCE RENTAL APPS CURRENT AND FUTURE END USER ANALYSIS, 2025–2034, (USD MILLION)
FIGURE 122 OMAN HOME APPLIANCE RENTAL APPS CURRENT AND FUTURE TYPE ANALYSIS, 2025–2034, (USD MILLION)
FIGURE 123 OMAN HOME APPLIANCE RENTAL APPS CURRENT AND FUTURE END USER ANALYSIS, 2025–2034, (USD MILLION)
FIGURE 124 QATAR HOME APPLIANCE RENTAL APPS CURRENT AND FUTURE TYPE ANALYSIS, 2025–2034, (USD MILLION)
FIGURE 125 QATAR HOME APPLIANCE RENTAL APPS CURRENT AND FUTURE END USER ANALYSIS, 2025–2034, (USD MILLION)
FIGURE 126 EGYPT HOME APPLIANCE RENTAL APPS CURRENT AND FUTURE TYPE ANALYSIS, 2025–2034, (USD MILLION)
FIGURE 127 EGYPT HOME APPLIANCE RENTAL APPS CURRENT AND FUTURE END USER ANALYSIS, 2025–2034, (USD MILLION)
FIGURE 128 NIGERIA HOME APPLIANCE RENTAL APPS CURRENT AND FUTURE TYPE ANALYSIS, 2025–2034, (USD MILLION)
FIGURE 129 NIGERIA HOME APPLIANCE RENTAL APPS CURRENT AND FUTURE END USER ANALYSIS, 2025–2034, (USD MILLION)
FIGURE 130 SOUTH AFRICA HOME APPLIANCE RENTAL APPS CURRENT AND FUTURE TYPE ANALYSIS, 2025–2034, (USD MILLION)
FIGURE 131 SOUTH AFRICA HOME APPLIANCE RENTAL APPS CURRENT AND FUTURE END USER ANALYSIS, 2025–2034, (USD MILLION)
FIGURE 132 ISRAEL HOME APPLIANCE RENTAL APPS CURRENT AND FUTURE TYPE ANALYSIS, 2025–2034, (USD MILLION)
FIGURE 133 ISRAEL HOME APPLIANCE RENTAL APPS CURRENT AND FUTURE END USER ANALYSIS, 2025–2034, (USD MILLION)
FIGURE 134 REST OF MEA HOME APPLIANCE RENTAL APPS CURRENT AND FUTURE TYPE ANALYSIS, 2025–2034, (USD MILLION)
FIGURE 135 REST OF MEA HOME APPLIANCE RENTAL APPS CURRENT AND FUTURE END USER ANALYSIS, 2025–2034, (USD MILLION)
FIGURE 136 U. S. MARKET SHARE ANALYSIS BY TYPE (2024)
FIGURE 137 U. S. MARKET SHARE ANALYSIS BY END USER (2024)
FIGURE 138 CANADA MARKET SHARE ANALYSIS BY TYPE (2024)
FIGURE 139 CANADA MARKET SHARE ANALYSIS BY END USER (2024)
FIGURE 140 MEXICO MARKET SHARE ANALYSIS BY TYPE (2024)
FIGURE 141 MEXICO MARKET SHARE ANALYSIS BY END USER (2024)
FIGURE 142 CHINA MARKET SHARE ANALYSIS BY TYPE (2024)
FIGURE 143 CHINA MARKET SHARE ANALYSIS BY END USER (2024)
FIGURE 144 JAPAN MARKET SHARE ANALYSIS BY TYPE (2024)
FIGURE 145 JAPAN MARKET SHARE ANALYSIS BY END USER (2024)
FIGURE 146 INDIA MARKET SHARE ANALYSIS BY TYPE (2024)
FIGURE 147 INDIA MARKET SHARE ANALYSIS BY END USER (2024)
FIGURE 148 SOUTH KOREA MARKET SHARE ANALYSIS BY TYPE (2024)
FIGURE 149 SOUTH KOREA MARKET SHARE ANALYSIS BY END USER (2024)
FIGURE 150 SAUDI ARABIA MARKET SHARE ANALYSIS BY TYPE (2024)
FIGURE 151 SAUDI ARABIA MARKET SHARE ANALYSIS BY END USER (2024)
FIGURE 152 UAE MARKET SHARE ANALYSIS BY TYPE (2024)
FIGURE 153 UAE MARKET SHARE ANALYSIS BY END USER (2024)
FIGURE 154 EGYPT MARKET SHARE ANALYSIS BY TYPE (2024)
FIGURE 155 EGYPT MARKET SHARE ANALYSIS BY END USER (2024)
FIGURE 156 NIGERIA MARKET SHARE ANALYSIS BY TYPE (2024)
FIGURE 157 NIGERIA MARKET SHARE ANALYSIS BY END USER (2024)
FIGURE 158 SOUTH AFRICA MARKET SHARE ANALYSIS BY TYPE (2024)
FIGURE 159 SOUTH AFRICA MARKET SHARE ANALYSIS BY END USER (2024)
FIGURE 160 GERMANY MARKET SHARE ANALYSIS BY TYPE (2024)
FIGURE 161 GERMANY MARKET SHARE ANALYSIS BY END USER (2024)
FIGURE 162 FRANCE MARKET SHARE ANALYSIS BY TYPE (2024)
FIGURE 163 FRANCE MARKET SHARE ANALYSIS BY END USER (2024)
FIGURE 164 UK MARKET SHARE ANALYSIS BY TYPE (2024)
FIGURE 165 UK MARKET SHARE ANALYSIS BY END USER (2024)
FIGURE 166 SPAIN MARKET SHARE ANALYSIS BY TYPE (2024)
FIGURE 167 SPAIN MARKET SHARE ANALYSIS BY END USER (2024)
FIGURE 168 ITALY MARKET SHARE ANALYSIS BY TYPE (2024)
FIGURE 169 ITALY MARKET SHARE ANALYSIS BY END USER (2024)
FIGURE 170 BRAZIL MARKET SHARE ANALYSIS BY TYPE (2024)
FIGURE 171 BRAZIL MARKET SHARE ANALYSIS BY END USER (2024)
FIGURE 172 ARGENTINA MARKET SHARE ANALYSIS BY TYPE (2024)
FIGURE 173 ARGENTINA MARKET SHARE ANALYSIS BY END USER (2024)
FIGURE 174 COLUMBIA MARKET SHARE ANALYSIS BY TYPE (2024)
FIGURE 175 COLUMBIA MARKET SHARE ANALYSIS BY END USER (2024)
FIGURE 176 GLOBAL HOME APPLIANCE RENTAL APPS CURRENT AND FUTURE MARKET KEY COUNTRY LEVEL ANALYSIS, 2024–2034, (USD MILLION)
FIGURE 177 FINANCIAL OVERVIEW:
Key Players Analysis:
Rentomojo- Rentomojo stands as one of the giants in the Indian home appliance rental market, having established itself as a comprehensive lifestyle rental platform since its inception in 2014. The company has successfully raised over $30 million in funding and operates across multiple Indian cities, offering a wide range of appliances including furniture, electronics, and home appliances. Rentomojo's competitive advantage lies in its technology-driven approach, featuring a user-friendly mobile application, flexible rental terms, and comprehensive maintenance services. The company has built a strong brand presence through aggressive marketing campaigns and strategic partnerships with appliance manufacturers. Their subscription-based model includes options for monthly, quarterly, and annual rentals with easy upgrade and return policies, making it attractive to the target demographic of young professionals and students.
Rent-A-Center, Inc.- Rent-A-Center represents a major player in the North American appliance rental market, operating over 2,000 stores across the United States and generating annual revenues exceeding $2.5 billion. The company's business model combines traditional retail locations with digital platforms, offering rent-to-own options that appeal to customers seeking eventual ownership. Rent-A-Center's strength lies in its extensive physical presence, established customer relationships, and comprehensive product portfolio that includes appliances, furniture, and electronics. The company has invested significantly in digital transformation initiatives, including e-commerce platforms and mobile applications, to compete with emerging online-only rental services. Their financial services capabilities, including flexible payment options and credit-building programs, differentiate them from pure rental platforms and create additional customer value.
Furlenco- Furlenco has emerged as a significant player in the Indian furniture and appliance rental market, focusing on the premium segment with high-quality products and superior customer service. The company has successfully positioned itself as a lifestyle brand rather than a traditional rental service, appealing to affluent millennials and expatriates. Furlenco's competitive advantage includes curated product selections, professional interior design services, and white-glove delivery and installation. The company operates in major Indian metropolitan areas and has expanded its product portfolio to include home appliances, electronics, and fitness equipment. Their subscription model includes maintenance, insurance, and replacement services, creating a comprehensive value proposition that justifies premium pricing. The company's focus on customer experience, including personalized service and flexible terms, has resulted in strong customer loyalty and positive brand recognition.
FlexShopper, LLC- FlexShopper operates as a leading online lease-to-own platform in the United States, serving customers who may not qualify for traditional credit-based financing options. The company's business model combines appliance rental with eventual ownership opportunities, appealing to consumers seeking to build credit history while accessing necessary household items. FlexShopper's technology platform enables real-time credit decisions and seamless application processes, making it accessible to a broad customer base. The company partners with major retailers and manufacturers to offer a comprehensive product selection including appliances, electronics, and home goods. Their competitive advantage lies in serving underbanked consumers who are often overlooked by traditional rental services, creating a significant market opportunity. The company's lease-to-own model provides a pathway to ownership while generating recurring revenue through weekly or monthly payment structures.
Market Key Players
Rentomojo
Mr Rental
Furlenco
FlexShopper, LLC.
Rent-A-Center, Inc.
Aaron’s Inc.
DrinkPrime
CityFurnish
Livpure Smart Homes Private Limited
Housejoy
Rentickle
Fabrento
Appliancesonrent.com
Driver:
Changing Consumer Preferences and Demographic Shifts:
The fundamental shift in consumer behavior toward flexible consumption models represents the primary driver of market growth. Millennials and Gen Z consumers, who collectively represent over 40% of the global population, demonstrate distinct preferences for access-based consumption over traditional ownership models. This demographic shift is characterized by prioritizing experiences over possessions, valuing flexibility and convenience, and maintaining asset-light lifestyles that enable mobility and financial flexibility. The preference for subscription-based services extends beyond traditional digital offerings to physical products, including home appliances.
Urbanization and Economic Factors:
Rapid urbanization across emerging markets creates substantial demand for flexible appliance solutions as urban populations grow and living arrangements become more transient. The United Nations projects that 68% of the global population will live in urban areas by 2050, representing a significant expansion of the potential customer base for appliance rental services. Urban living environments often feature space constraints, temporary housing arrangements, and higher mobility rates, all of which favor rental over ownership models. The concentration of population in urban centers also enables rental companies to achieve operational efficiencies through centralized inventory management and streamlined logistics operations.
Restrain:
Consumer Mindset and Cultural Barriers:
Traditional ownership mindsets and cultural preferences for asset accumulation present significant barriers to market expansion, particularly in certain demographic segments and geographic regions. Many consumers, especially older generations and those in developing markets, view appliance ownership as a symbol of financial stability and social status. This cultural attachment to ownership creates resistance to rental models, which may be perceived as temporary or indicative of financial instability. The psychological satisfaction derived from ownership, including the ability to customize, modify, and maintain appliances according to personal preferences, cannot be easily replicated in rental arrangements.
Economic and Operational Challenges:
The long-term cost implications of rental versus purchase present a fundamental challenge to market growth, particularly for appliances with long lifespans and stable performance characteristics. Mathematical analysis often reveals that the total cost of renting an appliance over its useful life exceeds the purchase price, especially for consumers who maintain stable living arrangements for extended periods. This cost disadvantage becomes more pronounced for basic appliances with lower purchase prices and minimal maintenance requirements. Consumer awareness of these long-term cost implications, facilitated by online comparison tools and financial literacy resources, can limit market expansion among price-sensitive segments.
Opportunities:
Emerging Market Expansion and Digital Transformation:
The expansion into emerging markets presents substantial growth opportunities as these regions experience rapid economic development, urbanization, and digital transformation. Countries in Asia-Pacific, Latin America, and Africa are witnessing significant growth in middle-class populations with increasing disposable income and changing lifestyle preferences. The smartphone penetration rates in these markets continue to climb, creating the necessary infrastructure for mobile-based rental platforms. The relatively underdeveloped traditional retail infrastructure in many emerging markets provides an advantage for digital-first rental platforms that can reach consumers directly through mobile applications.
Sustainability and Circular Economy Models:
The growing emphasis on environmental sustainability and circular economy principles creates significant opportunities for appliance rental services positioned as environmentally responsible alternatives to traditional ownership models. The rental model inherently promotes resource efficiency through extended product lifecycles, professional maintenance that optimizes performance and longevity, and centralized management that enables efficient resource allocation. Companies can leverage sustainability messaging to appeal to environmentally conscious consumers and align with corporate social responsibility initiatives of commercial customers.
Trends:
Subscription-Based Models and Service Integration:
The evolution toward comprehensive subscription-based models represents a significant trend that extends beyond simple appliance rental to encompass integrated home service ecosystems. Modern rental platforms are developing subscription tiers that include multiple appliances, maintenance services, insurance coverage, and additional home services such as cleaning, repairs, and utility management. This trend reflects consumer preference for simplified, all-inclusive service packages that eliminate the complexity of managing multiple service providers and contracts. The subscription model provides predictable revenue streams for service providers while offering consumers transparent pricing and comprehensive service coverage.
Technology Integration and Smart Home Connectivity:
The integration of smart home technologies and IoT capabilities represents a transformative trend that creates new value propositions and service delivery models. Smart appliances equipped with connectivity features enable remote monitoring, predictive maintenance, and automated service delivery that enhances reliability and customer satisfaction. Real-time performance data allows rental companies to optimize maintenance schedules, predict potential failures, and proactively address issues before they impact customer experience. The integration with home automation systems and voice assistants creates seamless user experiences and positions rental appliances as components of comprehensive smart home ecosystems.
Recent Development:
In July 2025: Rentomojo, a pioneer in India’s furniture and appliance rental sector, has marked a significant achievement by inaugurating its 51st experience center in Ghansoli, Navi Mumbai. This launch not only highlights the company’s rapid growth but also reinforces its reputation as an innovative retail-tech leader transforming the rental landscape.
In May 2025: 2Quip Corporation, a prominent US-based provider of equipment rental software and technology solutions, has announced the acquisition of Rentz Corp, a move that further strengthens its position in the equipment rental technology sector. While the financial specifics of the transaction remain confidential, this strategic acquisition is expected to enhance 2Quip’s service offerings and market reach.