Global Home Improvement Services Market Size, Share & Analysis By Deployment (Online, Offline), By Repairs & Maintenance (Non-HVAC Home Appliances, Ventilation and Air Conditioning, Electricity, Gas, Heating, Plumbing), By Home Improvement Type (Interior Design, Construction), Industry Demand Drivers, Digital Platforms Impact, Competitive Landscape & Forecast 2025–2034
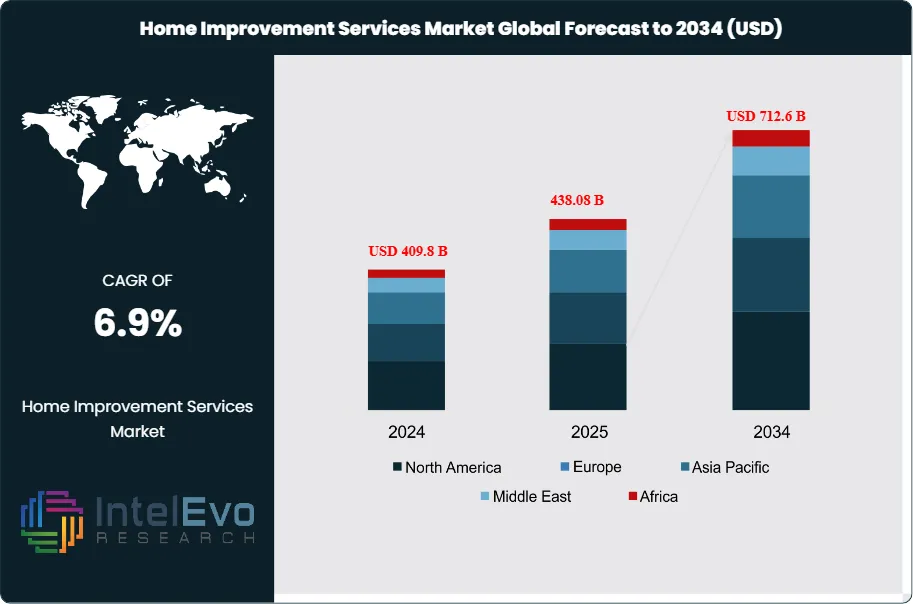
The Home Improvement Services Market is projected to grow from USD 409.8 Billion in 2024 to approximately USD 712.6 Billion by 2034, expanding at a CAGR of around 6.9% during 2025–2034. Rising renovation activity—especially among owners of aging homes—is fueling strong demand for remodeling, energy-efficient upgrades, and modern interior redesigns. The surge in smart home adoption and sustainable materials is reshaping consumer expectations and driving premium service offerings worldwide.
As digital tools, AI-powered design, and eco-friendly solutions gain momentum, the sector is entering a new era of tech-enabled, value-driven home improvement. This, driven by rising consumer demand for personalized, efficient, and sustainable residential upgrades, offering strategic opportunities for manufacturers, contractors, and investors. This market reflects a dynamic intersection of lifestyle enhancement, economic conditions, and technological innovation, shaping its trajectory as a cornerstone of modern residential development.
Over the past decade, the sector has transitioned from primarily functional repairs to a comprehensive focus on lifestyle-oriented renovations, such as kitchen and bathroom remodels, energy-efficient installations, and outdoor living enhancements. While the market experienced a 14% decline in kitchen and bathroom renovation revenues in 2024, totaling USD 165.4 billion, this contraction underscores the cyclical nature of discretionary spending rather than a long-term downturn. At the same time, supply chain realignments revealed shifting priorities—import shipments dropped by 30.1% in early 2024, whereas U.S. manufacturing shipments rose by 3.8%, highlighting an emerging preference for domestic production and localized supply resilience.
Several demand-side drivers continue to propel market expansion, including the aging housing stock in developed economies, heightened homeownership rates among Baby Boomers and Gen X (notably 84% in 2024), and rising expectations for energy-efficient and sustainable solutions. These dynamics are further amplified by supply-side innovations, with smart home technologies, automation tools, and AI-enabled design platforms reshaping consumer decision-making and project execution. However, the sector also faces constraints such as fluctuating raw material costs, labor shortages, and evolving regulatory frameworks focused on environmental standards, all of which require agile adaptation by market participants.
Regionally, North America maintains a dominant share, fueled by high consumer expenditure on remodeling and repair, while Europe follows with robust demand for eco-friendly upgrades aligned with stringent sustainability mandates. Asia-Pacific is emerging as a high-growth investment hub, driven by rapid urbanization, rising middle-class incomes, and increasing adoption of digital platforms for service procurement. Investors are particularly attentive to opportunities in green housing initiatives, modular renovation solutions, and digitally integrated service models across these expanding geographies.
As the Home Improvement Services Market advances toward 2033, stakeholders who prioritize sustainability, digital transformation, and customer-centric solutions will be best positioned to capture long-term value. The sector’s resilience and adaptability amid shifting economic, demographic, and technological landscapes reinforce its role as a critical growth frontier for global residential development.
Market Growth: The Global Home Improvement Services Market was valued at USD 409.8 Billion in 2024 and is projected to reach USD 712.6 Billion by 2034, expanding at a CAGR of 6.90% from 2025 to 2034. Growth is fueled by rising consumer demand for lifestyle upgrades, energy-efficient solutions, and sustainable renovation practices.
Home Improvement Type: Interior design services accounted for 53% of the market in 2024, reflecting strong consumer preference for aesthetic and functional enhancements within kitchens, bathrooms, and living spaces.
Deployment Channel: Offline service delivery continues to dominate with a 60% market share, supported by consumer reliance on in-person consultations and established contractor networks, though digital platforms are gradually expanding penetration.
Repairs & Maintenance: Electrical repair and maintenance represented 22% of total services in 2024, underscoring the growing demand for skilled expertise in addressing power system upgrades, smart wiring, and energy-efficient installations.
Driver: Rising urbanization and housing stock upgrades, coupled with a homeownership rate of 84% among Baby Boomers and Gen X in 2024, are sustaining long-term demand for renovation and remodeling services.
Restraint: Supply chain volatility, reflected in a 30.1% decline in import shipments during early 2024, and skilled labor shortages are creating cost pressures and project delays across key markets.
Opportunity: Asia-Pacific is emerging as a high-growth region, driven by urban infrastructure development and a rapidly expanding middle class, with projected double-digit growth in adoption of smart home and modular renovation services through 2030.
Trend: Technological integration is reshaping the market, with AI-enabled design tools, digital service platforms, and smart home automation increasingly influencing consumer choices and project execution strategies.
Regional Analysis: North America dominates with 38% of global market share in 2024, supported by high remodeling expenditure and energy-efficiency initiatives, while Asia-Pacific is forecast to be the fastest-growing region, attracting significant investment in sustainable and digitally driven service models.
Type Analysis
The home improvement services market is segmented by type into high-performance concrete, self-consolidating concrete, and other specialized variants. High-performance concrete continues to capture the largest share, reflecting its durability, superior strength, and ability to withstand extreme weather conditions. As infrastructure and residential projects increasingly emphasize longevity and energy efficiency, demand for high-performance concrete has accelerated, particularly in North America and Europe where sustainability standards are stringent. By 2025, this segment is expected to account for over 45% of type-based revenues, supported by its widespread use in both residential renovations and commercial upgrades.
Self-consolidating concrete is gaining traction as the fastest-growing category, largely due to its efficiency in reducing labor costs and construction times. The material’s ability to flow easily into complex forms without vibration has positioned it as a preferred choice for modern architectural designs and high-rise projects. This segment is projected to grow at a CAGR exceeding 6% through 2030, benefiting from rising adoption in urban housing and infrastructure upgrades across Asia-Pacific. Other types, including specialty blends tailored for decorative finishes or eco-friendly applications, remain niche but are increasingly valued in high-end residential projects focused on customization and sustainability.
Application Analysis
Within applications, pavers represent a significant share of the market, driven by rising investments in outdoor living spaces such as patios, walkways, and driveways. The trend toward enhancing curb appeal and creating multifunctional outdoor environments has boosted demand in North America and Europe, where paver installations are closely tied to premium landscaping projects. By 2025, the segment is forecast to contribute more than 40% of global revenues in application-based categories.
Retaining walls form another core segment, supported by the need for erosion control, land management, and infrastructure development. With rapid urbanization in Asia-Pacific and Latin America, retaining walls are increasingly adopted in residential complexes, road projects, and industrial facilities. The segment is expected to expand steadily at 5–6% CAGR, underpinned by government-backed infrastructure initiatives. Other applications—including decorative elements, façade enhancements, and structural reinforcements—are growing in demand as consumers seek both aesthetic and functional improvements in their living spaces.
End-Use Analysis
Residential buildings dominate the end-use segment, accounting for nearly 55% of global revenues in 2024. Rising homeownership rates, coupled with the sustained trend of remote and hybrid working, are fueling consumer investments in both interior and exterior upgrades. Spending on home improvement in this segment is particularly high in North America, where per-household remodeling expenditure surpasses USD 4,000 annually.
Commercial buildings represent the second-largest segment, with strong momentum in retail, hospitality, and office renovations. Growing demand for energy-efficient retrofits and smart building systems has positioned this category for robust growth, with projected CAGR above 6% through 2030. The industrial segment, while smaller, plays a strategic role in supporting durable flooring, storage infrastructure, and customized workspace layouts. Its growth is closely tied to manufacturing and logistics expansion, particularly in Asia-Pacific economies.
Regional Analysis
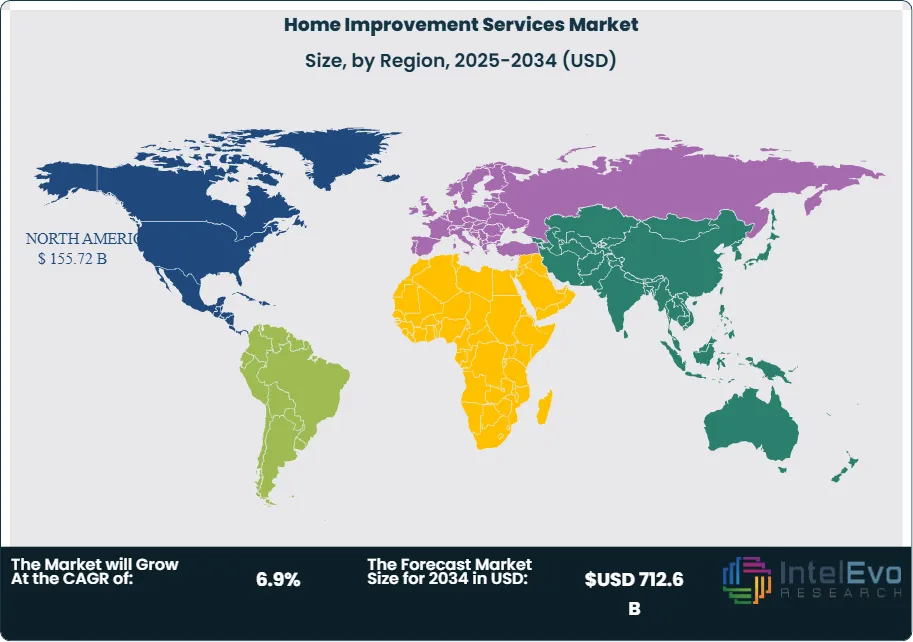
North America leads the global market, commanding approximately 38% share in 2024, underpinned by high remodeling activity, mature contractor networks, and rapid adoption of smart home solutions. Energy-efficient upgrades and government incentives for green housing remain key drivers in this region. Europe follows, driven by stringent environmental regulations and consumer demand for sustainable materials. Renovation projects focusing on energy efficiency and architectural preservation are particularly prominent in Germany, France, and the UK.
Asia-Pacific is projected to be the fastest-growing region, expanding at a CAGR of over 7% through 2030. Rapid urbanization, expanding middle-class populations, and rising disposable incomes in China, India, and Southeast Asia are fueling investments in residential and commercial improvements. Latin America is witnessing steady growth, supported by urban development in Brazil and Mexico, though macroeconomic volatility tempers its pace. Meanwhile, the Middle East & Africa market is evolving with demand for luxury and bespoke home upgrades in affluent urban centers, particularly in the UAE and Saudi Arabia, aligning with broader economic diversification agendas.
By Deployment (Online, Offline), By Repairs & Maintenance (Non-HVAC Home Appliances, Ventilation and Air Conditioning, Electricity, Gas, Heating, Plumbing), By Home Improvement Type (Interior Design, Construction)
Research Methodology
Primary Research- 100 Interviews of Stakeholders
Secondary Research
Desk Research
Regional scope
North America (United States, Canada, Mexico)
Latin America (Brazil, Argentina, Columbia)
East Asia And Pacific (China, Japan, South Korea, Australia, Cambodia, Fiji, Indonesia)
Sea And South Asia (India, Singapore, Thailand, Taiwan, Malaysia)
Eastern Europe (Poland, Russia, Czech Republic, Romania)
Western Europe (Germany, U.K., France, Spain, Itlay)
Middle East & Africa (GCC Countries, Egypt, Nigeria, South Africa, Israel)
Competitive Landscape
Belfor, Power Home Remodeling Group, LLC, Venturi Restoration, Rainbow Restoration, Coit Services, Inc., FirstService Corporation, Mr. Handyman, DKI Ventures, LLC, Crane Renovation Group, Servpro, Other Key Players
Customization Scope
Customization for segments, region/country-level will be provided. Moreover, additional customization can be done based on the requirements.
Pricing and Purchase Options
Avail customized purchase options to meet your exact research needs. We have three licenses to opt for: Single User License, Multi-User License (Up to 5 Users), Corporate Use License (Unlimited User and Printable PDF).
TABLE OF CONTENTS
1. EXECUTIVE SUMMARY
1.1. MARKET SNAPSHOT
1.2. KEY FINDINGS & INSIGHTS
1.3. ANALYST RECOMMENDATIONS
1.4. FUTURE OUTLOOK
2. RESEARCH METHODOLOGY
2.1. MARKET DEFINITION & SCOPE
2.2. RESEARCH OBJECTIVES: PRIMARY & SECONDARY DATA SOURCES
2.3. DATA COLLECTION SOURCES
2.3.1. COVERAGE OF 100+ PRIMARY RESEARCH/CONSULTATION CALLS WITH INDUSTRY STAKEHOLDERS
FIGURE 17 NORTH AMERICA HOME IMPROVEMENT SERVICES CURRENT AND FUTURE TYPE ANALYSIS, 2025–2034, (USD MILLION)
FIGURE 18 NORTH AMERICA HOME IMPROVEMENT SERVICES CURRENT AND FUTURE END USER ANALYSIS, 2025–2034, (USD MILLION)
FIGURE 19 MARKET SHARE BY COUNTRY
FIGURE 20 LATIN AMERICA HOME IMPROVEMENT SERVICES CURRENT AND FUTURE TYPE ANALYSIS, 2025–2034, (USD MILLION)
FIGURE 21 LATIN AMERICA HOME IMPROVEMENT SERVICES CURRENT AND FUTURE END USER ANALYSIS, 2025–2034, (USD MILLION)
FIGURE 22 MARKET SHARE BY COUNTRY
FIGURE 23 EASTERN EUROPE HOME IMPROVEMENT SERVICES CURRENT AND FUTURE TYPE ANALYSIS, 2025–2034, (USD MILLION)
FIGURE 24 EASTERN EUROPE HOME IMPROVEMENT SERVICES CURRENT AND FUTURE END USER ANALYSIS, 2025–2034, (USD MILLION)
FIGURE 25 MARKET SHARE BY COUNTRY
FIGURE 26 WESTERN EUROPE HOME IMPROVEMENT SERVICES CURRENT AND FUTURE TYPE ANALYSIS, 2025–2034, (USD MILLION)
FIGURE 27 WESTERN EUROPE HOME IMPROVEMENT SERVICES CURRENT AND FUTURE END USER ANALYSIS, 2025–2034, (USD MILLION)
FIGURE 28 MARKET SHARE BY COUNTRY
FIGURE 29 EAST ASIA AND PACIFIC HOME IMPROVEMENT SERVICES CURRENT AND FUTURE TYPE ANALYSIS, 2025–2034, (USD MILLION)
FIGURE 30 EAST ASIA AND PACIFIC HOME IMPROVEMENT SERVICES CURRENT AND FUTURE END USER ANALYSIS, 2025–2034, (USD MILLION)
FIGURE 31 MARKET SHARE BY COUNTRY
FIGURE 32 SEA AND SOUTH ASIA HOME IMPROVEMENT SERVICES CURRENT AND FUTURE TYPE ANALYSIS, 2025–2034, (USD MILLION)
FIGURE 33 SEA AND SOUTH ASIA HOME IMPROVEMENT SERVICES CURRENT AND FUTURE END USER ANALYSIS, 2025–2034, (USD MILLION)
FIGURE 34 MARKET SHARE BY COUNTRY
FIGURE 35 MIDDLE EAST AND AFRICA HOME IMPROVEMENT SERVICES CURRENT AND FUTURE TYPE ANALYSIS, 2025–2034, (USD MILLION)
FIGURE 36 MIDDLE EAST AND AFRICA HOME IMPROVEMENT SERVICES CURRENT AND FUTURE END USER ANALYSIS, 2025–2034, (USD MILLION)
FIGURE 37 NORTH AMERICA HOME IMPROVEMENT SERVICES CURRENT AND FUTURE MARKET VOLUME SHARE REGIONAL ANALYSIS, 2025–2034, (USD MILLION)
FIGURE 38 U.S. HOME IMPROVEMENT SERVICES CURRENT AND FUTURE TYPE ANALYSIS, 2025–2034, (USD MILLION)
FIGURE 39 U.S. HOME IMPROVEMENT SERVICES CURRENT AND FUTURE END USER ANALYSIS, 2025–2034, (USD MILLION)
FIGURE 40 CANADA HOME IMPROVEMENT SERVICES CURRENT AND FUTURE TYPE ANALYSIS, 2025–2034, (USD MILLION)
FIGURE 41 CANADA HOME IMPROVEMENT SERVICES CURRENT AND FUTURE END USER ANALYSIS, 2025–2034, (USD MILLION)
FIGURE 42 LATIN AMERICA HOME IMPROVEMENT SERVICES CURRENT AND FUTURE MARKET VOLUME SHARE REGIONAL ANALYSIS, 2025–2034, (USD MILLION)
FIGURE 43 MEXICO HOME IMPROVEMENT SERVICES CURRENT AND FUTURE TYPE ANALYSIS, 2025–2034, (USD MILLION)
FIGURE 44 MEXICO HOME IMPROVEMENT SERVICES CURRENT AND FUTURE END USER ANALYSIS, 2025–2034, (USD MILLION)
FIGURE 45 BRAZIL HOME IMPROVEMENT SERVICES CURRENT AND FUTURE TYPE ANALYSIS, 2025–2034, (USD MILLION)
FIGURE 46 BRAZIL HOME IMPROVEMENT SERVICES CURRENT AND FUTURE END USER ANALYSIS, 2025–2034, (USD MILLION)
FIGURE 47 ARGENTINA HOME IMPROVEMENT SERVICES CURRENT AND FUTURE TYPE ANALYSIS, 2025–2034, (USD MILLION)
FIGURE 48 ARGENTINA HOME IMPROVEMENT SERVICES CURRENT AND FUTURE END USER ANALYSIS, 2025–2034, (USD MILLION)
FIGURE 49 COLUMBIA HOME IMPROVEMENT SERVICES CURRENT AND FUTURE TYPE ANALYSIS, 2025–2034, (USD MILLION)
FIGURE 50 COLUMBIA HOME IMPROVEMENT SERVICES CURRENT AND FUTURE END USER ANALYSIS, 2025–2034, (USD MILLION)
FIGURE 51 REST OF LATIN AMERICA HOME IMPROVEMENT SERVICES CURRENT AND FUTURE TYPE ANALYSIS, 2025–2034, (USD MILLION)
FIGURE 52 REST OF LATIN AMERICA HOME IMPROVEMENT SERVICES CURRENT AND FUTURE END USER ANALYSIS, 2025–2034, (USD MILLION)
FIGURE 53 EASTERN EUROPE HOME IMPROVEMENT SERVICES CURRENT AND FUTURE MARKET VOLUME SHARE REGIONAL ANALYSIS, 2025–2034, (USD MILLION)
FIGURE 54 POLAND HOME IMPROVEMENT SERVICES CURRENT AND FUTURE TYPE ANALYSIS, 2025–2034, (USD MILLION)
FIGURE 55 POLAND HOME IMPROVEMENT SERVICES CURRENT AND FUTURE END USER ANALYSIS, 2025–2034, (USD MILLION)
FIGURE 56 RUSSIA HOME IMPROVEMENT SERVICES CURRENT AND FUTURE TYPE ANALYSIS, 2025–2034, (USD MILLION)
FIGURE 57 RUSSIA HOME IMPROVEMENT SERVICES CURRENT AND FUTURE END USER ANALYSIS, 2025–2034, (USD MILLION)
FIGURE 58 CZECH REPUBLIC HOME IMPROVEMENT SERVICES CURRENT AND FUTURE TYPE ANALYSIS, 2025–2034, (USD MILLION)
FIGURE 59 CZECH REPUBLIC HOME IMPROVEMENT SERVICES CURRENT AND FUTURE END USER ANALYSIS, 2025–2034, (USD MILLION)
FIGURE 60 ROMANIA HOME IMPROVEMENT SERVICES CURRENT AND FUTURE TYPE ANALYSIS, 2025–2034, (USD MILLION)
FIGURE 61 ROMANIA HOME IMPROVEMENT SERVICES CURRENT AND FUTURE END USER ANALYSIS, 2025–2034, (USD MILLION)
FIGURE 62 REST OF EASTERN EUROPE HOME IMPROVEMENT SERVICES CURRENT AND FUTURE TYPE ANALYSIS, 2025–2034, (USD MILLION)
FIGURE 63 REST OF EASTERN EUROPE HOME IMPROVEMENT SERVICES CURRENT AND FUTURE END USER ANALYSIS, 2025–2034, (USD MILLION)
FIGURE 64 WESTERN EUROPE HOME IMPROVEMENT SERVICES CURRENT AND FUTURE MARKET VOLUME SHARE REGIONAL ANALYSIS, 2025–2034, (USD MILLION)
FIGURE 65 GERMANY HOME IMPROVEMENT SERVICES CURRENT AND FUTURE TYPE ANALYSIS, 2025–2034, (USD MILLION)
FIGURE 66 GERMANY HOME IMPROVEMENT SERVICES CURRENT AND FUTURE END USER ANALYSIS, 2025–2034, (USD MILLION)
FIGURE 67 FRANCE HOME IMPROVEMENT SERVICES CURRENT AND FUTURE TYPE ANALYSIS, 2025–2034, (USD MILLION)
FIGURE 68 FRANCE HOME IMPROVEMENT SERVICES CURRENT AND FUTURE END USER ANALYSIS, 2025–2034, (USD MILLION)
FIGURE 69 UK HOME IMPROVEMENT SERVICES CURRENT AND FUTURE TYPE ANALYSIS, 2025–2034, (USD MILLION)
FIGURE 70 UK HOME IMPROVEMENT SERVICES CURRENT AND FUTURE END USER ANALYSIS, 2025–2034, (USD MILLION)
FIGURE 71 SPAIN HOME IMPROVEMENT SERVICES CURRENT AND FUTURE TYPE ANALYSIS, 2025–2034, (USD MILLION)
FIGURE 72 SPAIN HOME IMPROVEMENT SERVICES CURRENT AND FUTURE END USER ANALYSIS, 2025–2034, (USD MILLION)
FIGURE 73 ITALY HOME IMPROVEMENT SERVICES CURRENT AND FUTURE TYPE ANALYSIS, 2025–2034, (USD MILLION)
FIGURE 74 ITALY HOME IMPROVEMENT SERVICES CURRENT AND FUTURE END USER ANALYSIS, 2025–2034, (USD MILLION)
FIGURE 75 REST OF WESTERN EUROPE HOME IMPROVEMENT SERVICES CURRENT AND FUTURE TYPE ANALYSIS, 2025–2034, (USD MILLION)
FIGURE 76 REST OF WESTERN EUROPE HOME IMPROVEMENT SERVICES CURRENT AND FUTURE END USER ANALYSIS, 2025–2034, (USD MILLION)
FIGURE 77 EAST ASIA AND PACIFIC HOME IMPROVEMENT SERVICES CURRENT AND FUTURE MARKET VOLUME SHARE REGIONAL ANALYSIS, 2025–2034, (USD MILLION)
FIGURE 78 CHINA HOME IMPROVEMENT SERVICES CURRENT AND FUTURE TYPE ANALYSIS, 2025–2034, (USD MILLION)
FIGURE 79 CHINA HOME IMPROVEMENT SERVICES CURRENT AND FUTURE END USER ANALYSIS, 2025–2034, (USD MILLION)
FIGURE 80 JAPAN HOME IMPROVEMENT SERVICES CURRENT AND FUTURE TYPE ANALYSIS, 2025–2034, (USD MILLION)
FIGURE 81 JAPAN HOME IMPROVEMENT SERVICES CURRENT AND FUTURE END USER ANALYSIS, 2025–2034, (USD MILLION)
FIGURE 82 AUSTRALIA HOME IMPROVEMENT SERVICES CURRENT AND FUTURE TYPE ANALYSIS, 2025–2034, (USD MILLION)
FIGURE 83 AUSTRALIA HOME IMPROVEMENT SERVICES CURRENT AND FUTURE END USER ANALYSIS, 2025–2034, (USD MILLION)
FIGURE 84 CAMBODIA HOME IMPROVEMENT SERVICES CURRENT AND FUTURE TYPE ANALYSIS, 2025–2034, (USD MILLION)
FIGURE 85 CAMBODIA HOME IMPROVEMENT SERVICES CURRENT AND FUTURE END USER ANALYSIS, 2025–2034, (USD MILLION)
FIGURE 86 FIJI HOME IMPROVEMENT SERVICES CURRENT AND FUTURE TYPE ANALYSIS, 2025–2034, (USD MILLION)
FIGURE 87 FIJI HOME IMPROVEMENT SERVICES CURRENT AND FUTURE END USER ANALYSIS, 2025–2034, (USD MILLION)
FIGURE 88 INDONESIA HOME IMPROVEMENT SERVICES CURRENT AND FUTURE TYPE ANALYSIS, 2025–2034, (USD MILLION)
FIGURE 89 INDONESIA HOME IMPROVEMENT SERVICES CURRENT AND FUTURE END USER ANALYSIS, 2025–2034, (USD MILLION)
FIGURE 90 SOUTH KOREA HOME IMPROVEMENT SERVICES CURRENT AND FUTURE TYPE ANALYSIS, 2025–2034, (USD MILLION)
FIGURE 91 SOUTH KOREA HOME IMPROVEMENT SERVICES CURRENT AND FUTURE END USER ANALYSIS, 2025–2034, (USD MILLION)
FIGURE 92 REST OF EAST ASIA AND PACIFIC HOME IMPROVEMENT SERVICES CURRENT AND FUTURE TYPE ANALYSIS, 2025–2034, (USD MILLION)
FIGURE 93 REST OF EAST ASIA AND PACIFIC HOME IMPROVEMENT SERVICES CURRENT AND FUTURE END USER ANALYSIS, 2025–2034, (USD MILLION)
FIGURE 94 SEA AND SOUTH ASIA HOME IMPROVEMENT SERVICES CURRENT AND FUTURE MARKET VOLUME SHARE REGIONAL ANALYSIS, 2025–2034, (USD MILLION)
FIGURE 95 BANGLADESH HOME IMPROVEMENT SERVICES CURRENT AND FUTURE TYPE ANALYSIS, 2025–2034, (USD MILLION)
FIGURE 96 BANGLADESH HOME IMPROVEMENT SERVICES CURRENT AND FUTURE END USER ANALYSIS, 2025–2034, (USD MILLION)
FIGURE 97 NEW ZEALAND HOME IMPROVEMENT SERVICES CURRENT AND FUTURE TYPE ANALYSIS, 2025–2034, (USD MILLION)
FIGURE 98 NEW ZEALAND HOME IMPROVEMENT SERVICES CURRENT AND FUTURE END USER ANALYSIS, 2025–2034, (USD MILLION)
FIGURE 99 INDIA HOME IMPROVEMENT SERVICES CURRENT AND FUTURE TYPE ANALYSIS, 2025–2034, (USD MILLION)
FIGURE 100 INDIA HOME IMPROVEMENT SERVICES CURRENT AND FUTURE END USER ANALYSIS, 2025–2034, (USD MILLION)
FIGURE 101 SINGAPORE HOME IMPROVEMENT SERVICES CURRENT AND FUTURE TYPE ANALYSIS, 2025–2034, (USD MILLION)
FIGURE 102 SINGAPORE HOME IMPROVEMENT SERVICES CURRENT AND FUTURE END USER ANALYSIS, 2025–2034, (USD MILLION)
FIGURE 103 THAILAND HOME IMPROVEMENT SERVICES CURRENT AND FUTURE TYPE ANALYSIS, 2025–2034, (USD MILLION)
FIGURE 104 THAILAND HOME IMPROVEMENT SERVICES CURRENT AND FUTURE END USER ANALYSIS, 2025–2034, (USD MILLION)
FIGURE 105 TAIWAN HOME IMPROVEMENT SERVICES CURRENT AND FUTURE TYPE ANALYSIS, 2025–2034, (USD MILLION)
FIGURE 106 TAIWAN HOME IMPROVEMENT SERVICES CURRENT AND FUTURE END USER ANALYSIS, 2025–2034, (USD MILLION)
FIGURE 107 MALAYSIA HOME IMPROVEMENT SERVICES CURRENT AND FUTURE TYPE ANALYSIS, 2025–2034, (USD MILLION)
FIGURE 108 MALAYSIA HOME IMPROVEMENT SERVICES CURRENT AND FUTURE END USER ANALYSIS, 2025–2034, (USD MILLION)
FIGURE 109 REST OF SEA AND SOUTH ASIA HOME IMPROVEMENT SERVICES CURRENT AND FUTURE TYPE ANALYSIS, 2025–2034, (USD MILLION)
FIGURE 110 REST OF SEA AND SOUTH ASIA HOME IMPROVEMENT SERVICES CURRENT AND FUTURE END USER ANALYSIS, 2025–2034, (USD MILLION)
FIGURE 111 MIDDLE EAST AND AFRICA HOME IMPROVEMENT SERVICES CURRENT AND FUTURE MARKET VOLUME SHARE REGIONAL ANALYSIS, 2025–2034, (USD MILLION)
FIGURE 112 GCC COUNTRIES HOME IMPROVEMENT SERVICES CURRENT AND FUTURE TYPE ANALYSIS, 2025–2034, (USD MILLION)
FIGURE 113 GCC COUNTRIES HOME IMPROVEMENT SERVICES CURRENT AND FUTURE END USER ANALYSIS, 2025–2034, (USD MILLION)
FIGURE 114 SAUDI ARABIA HOME IMPROVEMENT SERVICES CURRENT AND FUTURE TYPE ANALYSIS, 2025–2034, (USD MILLION)
FIGURE 115 SAUDI ARABIA HOME IMPROVEMENT SERVICES CURRENT AND FUTURE END USER ANALYSIS, 2025–2034, (USD MILLION)
FIGURE 116 UAE HOME IMPROVEMENT SERVICES CURRENT AND FUTURE TYPE ANALYSIS, 2025–2034, (USD MILLION)
FIGURE 117 UAE HOME IMPROVEMENT SERVICES CURRENT AND FUTURE END USER ANALYSIS, 2025–2034, (USD MILLION)
FIGURE 118 BAHRAIN HOME IMPROVEMENT SERVICES CURRENT AND FUTURE TYPE ANALYSIS, 2025–2034, (USD MILLION)
FIGURE 119 BAHRAIN HOME IMPROVEMENT SERVICES CURRENT AND FUTURE END USER ANALYSIS, 2025–2034, (USD MILLION)
FIGURE 120 KUWAIT HOME IMPROVEMENT SERVICES CURRENT AND FUTURE TYPE ANALYSIS, 2025–2034, (USD MILLION)
FIGURE 121 KUWAIT HOME IMPROVEMENT SERVICES CURRENT AND FUTURE END USER ANALYSIS, 2025–2034, (USD MILLION)
FIGURE 122 OMAN HOME IMPROVEMENT SERVICES CURRENT AND FUTURE TYPE ANALYSIS, 2025–2034, (USD MILLION)
FIGURE 123 OMAN HOME IMPROVEMENT SERVICES CURRENT AND FUTURE END USER ANALYSIS, 2025–2034, (USD MILLION)
FIGURE 124 QATAR HOME IMPROVEMENT SERVICES CURRENT AND FUTURE TYPE ANALYSIS, 2025–2034, (USD MILLION)
FIGURE 125 QATAR HOME IMPROVEMENT SERVICES CURRENT AND FUTURE END USER ANALYSIS, 2025–2034, (USD MILLION)
FIGURE 126 EGYPT HOME IMPROVEMENT SERVICES CURRENT AND FUTURE TYPE ANALYSIS, 2025–2034, (USD MILLION)
FIGURE 127 EGYPT HOME IMPROVEMENT SERVICES CURRENT AND FUTURE END USER ANALYSIS, 2025–2034, (USD MILLION)
FIGURE 128 NIGERIA HOME IMPROVEMENT SERVICES CURRENT AND FUTURE TYPE ANALYSIS, 2025–2034, (USD MILLION)
FIGURE 129 NIGERIA HOME IMPROVEMENT SERVICES CURRENT AND FUTURE END USER ANALYSIS, 2025–2034, (USD MILLION)
FIGURE 130 SOUTH AFRICA HOME IMPROVEMENT SERVICES CURRENT AND FUTURE TYPE ANALYSIS, 2025–2034, (USD MILLION)
FIGURE 131 SOUTH AFRICA HOME IMPROVEMENT SERVICES CURRENT AND FUTURE END USER ANALYSIS, 2025–2034, (USD MILLION)
FIGURE 132 ISRAEL HOME IMPROVEMENT SERVICES CURRENT AND FUTURE TYPE ANALYSIS, 2025–2034, (USD MILLION)
FIGURE 133 ISRAEL HOME IMPROVEMENT SERVICES CURRENT AND FUTURE END USER ANALYSIS, 2025–2034, (USD MILLION)
FIGURE 134 REST OF MEA HOME IMPROVEMENT SERVICES CURRENT AND FUTURE TYPE ANALYSIS, 2025–2034, (USD MILLION)
FIGURE 135 REST OF MEA HOME IMPROVEMENT SERVICES CURRENT AND FUTURE END USER ANALYSIS, 2025–2034, (USD MILLION)
FIGURE 136 U. S. MARKET SHARE ANALYSIS BY TYPE (2024)
FIGURE 137 U. S. MARKET SHARE ANALYSIS BY END USER (2024)
FIGURE 138 CANADA MARKET SHARE ANALYSIS BY TYPE (2024)
FIGURE 139 CANADA MARKET SHARE ANALYSIS BY END USER (2024)
FIGURE 140 MEXICO MARKET SHARE ANALYSIS BY TYPE (2024)
FIGURE 141 MEXICO MARKET SHARE ANALYSIS BY END USER (2024)
FIGURE 142 CHINA MARKET SHARE ANALYSIS BY TYPE (2024)
FIGURE 143 CHINA MARKET SHARE ANALYSIS BY END USER (2024)
FIGURE 144 JAPAN MARKET SHARE ANALYSIS BY TYPE (2024)
FIGURE 145 JAPAN MARKET SHARE ANALYSIS BY END USER (2024)
FIGURE 146 INDIA MARKET SHARE ANALYSIS BY TYPE (2024)
FIGURE 147 INDIA MARKET SHARE ANALYSIS BY END USER (2024)
FIGURE 148 SOUTH KOREA MARKET SHARE ANALYSIS BY TYPE (2024)
FIGURE 149 SOUTH KOREA MARKET SHARE ANALYSIS BY END USER (2024)
FIGURE 150 SAUDI ARABIA MARKET SHARE ANALYSIS BY TYPE (2024)
FIGURE 151 SAUDI ARABIA MARKET SHARE ANALYSIS BY END USER (2024)
FIGURE 152 UAE MARKET SHARE ANALYSIS BY TYPE (2024)
FIGURE 153 UAE MARKET SHARE ANALYSIS BY END USER (2024)
FIGURE 154 EGYPT MARKET SHARE ANALYSIS BY TYPE (2024)
FIGURE 155 EGYPT MARKET SHARE ANALYSIS BY END USER (2024)
FIGURE 156 NIGERIA MARKET SHARE ANALYSIS BY TYPE (2024)
FIGURE 157 NIGERIA MARKET SHARE ANALYSIS BY END USER (2024)
FIGURE 158 SOUTH AFRICA MARKET SHARE ANALYSIS BY TYPE (2024)
FIGURE 159 SOUTH AFRICA MARKET SHARE ANALYSIS BY END USER (2024)
FIGURE 160 GERMANY MARKET SHARE ANALYSIS BY TYPE (2024)
FIGURE 161 GERMANY MARKET SHARE ANALYSIS BY END USER (2024)
FIGURE 162 FRANCE MARKET SHARE ANALYSIS BY TYPE (2024)
FIGURE 163 FRANCE MARKET SHARE ANALYSIS BY END USER (2024)
FIGURE 164 UK MARKET SHARE ANALYSIS BY TYPE (2024)
FIGURE 165 UK MARKET SHARE ANALYSIS BY END USER (2024)
FIGURE 166 SPAIN MARKET SHARE ANALYSIS BY TYPE (2024)
FIGURE 167 SPAIN MARKET SHARE ANALYSIS BY END USER (2024)
FIGURE 168 ITALY MARKET SHARE ANALYSIS BY TYPE (2024)
FIGURE 169 ITALY MARKET SHARE ANALYSIS BY END USER (2024)
FIGURE 170 BRAZIL MARKET SHARE ANALYSIS BY TYPE (2024)
FIGURE 171 BRAZIL MARKET SHARE ANALYSIS BY END USER (2024)
FIGURE 172 ARGENTINA MARKET SHARE ANALYSIS BY TYPE (2024)
FIGURE 173 ARGENTINA MARKET SHARE ANALYSIS BY END USER (2024)
FIGURE 174 COLUMBIA MARKET SHARE ANALYSIS BY TYPE (2024)
FIGURE 175 COLUMBIA MARKET SHARE ANALYSIS BY END USER (2024)
FIGURE 176 GLOBAL HOME IMPROVEMENT SERVICES CURRENT AND FUTURE MARKET KEY COUNTRY LEVEL ANALYSIS, 2024–2034, (USD MILLION)
FIGURE 177 FINANCIAL OVERVIEW:
Key Player Analysis
DKI Ventures, LLC: DKI Ventures, LLC positions itself as a leading provider in the disaster restoration and property recovery segment of the home improvement services market. With a nationwide network of contractors, the company specializes in emergency repairs, structural restoration, and reconstruction, serving both residential and commercial clients. By 2025, DKI has strengthened its market presence through investments in digital platforms that streamline claims management and customer communication, allowing faster response times and greater operational efficiency. Its strategic partnerships with insurance providers and facility managers reinforce its role as a preferred service partner in large-scale restoration projects.
The company differentiates itself through its robust contractor network and focus on sustainability in restoration practices. DKI has increasingly adopted eco-friendly materials and processes, aligning with growing regulatory and consumer demand for green building solutions. Its scale, reliability, and ability to mobilize resources quickly in disaster-prone regions position it as a key market stabilizer in the U.S. and Canada.
Rainbow Restoration: Rainbow Restoration is recognized as a challenger brand within the home improvement services market, specializing in property restoration, mold remediation, and deep cleaning services. With more than 300 franchise locations across North America, the company has expanded its service capabilities through enhanced training programs and advanced equipment adoption. By integrating AI-driven diagnostics for moisture detection and predictive maintenance, Rainbow Restoration has improved service accuracy and reduced remediation timelines.
The company’s franchise-driven growth model provides scalability and regional reach, allowing it to compete effectively in local markets while maintaining consistent brand standards. Differentiation comes from its comprehensive service offering, which extends beyond restoration into preventative care and long-term property management solutions. Rainbow Restoration’s focus on customer trust and community-driven operations continues to build loyalty, particularly among residential homeowners seeking reliable service providers.
Servpro: Servpro remains the market leader in restoration and cleaning services, operating more than 2,200 franchises across North America. In 2025, the company has solidified its leadership position by leveraging digital transformation, including AI-powered scheduling systems, mobile-first customer portals, and advanced equipment for water, fire, and storm damage restoration. Its scale and brand recognition give Servpro a dominant market share, with annual revenues surpassing USD 3 billion.
Strategically, Servpro has invested heavily in franchise support and training, ensuring consistency in service quality across its network. The company’s strong relationships with insurance carriers provide a steady pipeline of projects, giving it a competitive advantage over smaller players. Its differentiators lie in its unmatched geographic coverage, speed of service delivery, and continued emphasis on technology adoption—making Servpro a benchmark for operational excellence in the industry.
Power Home Remodeling Group, LLC: Power Home Remodeling Group positions itself as an innovator in the home improvement services market, focusing on large-scale residential upgrades such as roofing, windows, siding, and energy-efficient solutions. The company has built a reputation as one of the fastest-growing remodeling firms in the U.S., with reported annual revenues exceeding USD 1 billion by 2024. Its strong emphasis on sustainability—through energy-efficient products and solar-ready installations—resonates with environmentally conscious homeowners.
Power Home Remodeling differentiates itself with a customer-first approach supported by advanced digital design platforms that allow homeowners to visualize remodeling outcomes before committing. Its investment in workforce culture and training has also earned it recognition as a top employer, helping to address industry-wide labor shortages. By combining customer engagement, sustainable solutions, and technological integration, Power Home Remodeling is positioned to capitalize on the rising demand for eco-friendly, value-added home improvement services in 2025 and beyond.
Market Key Players
Belfor
Power Home Remodeling Group, LLC
Venturi Restoration
Rainbow Restoration
Coit Services, Inc.
FirstService Corporation
Mr. Handyman
DKI Ventures, LLC
Crane Renovation Group
Servpro
Other Key Players
Driver:
Rising Remodeling Demand Driven by Aging Housing Stock
As of 2025, one of the strongest forces shaping the Home Improvement Services Market is the steady rise in remodeling activity, particularly among buyers of older homes. With nearly 60% of U.S. home sales in 2024 involving properties more than 20 years old, demand for pre-occupancy renovations—ranging from energy-efficient retrofits to modern kitchen and bath upgrades—continues to surge. This driver is reinforced by higher property prices and mortgage rates, which make moving into newer homes less attainable and push households to maximize the value of their existing properties. For market players, this trend not only fuels project volumes but also accelerates adoption of advanced solutions such as smart home automation, sustainable materials, and AI-enabled design services.
Restraint:
Financial Constraints and DIY Culture Limit Market Expansion
Despite robust growth prospects, tightening financial conditions remain a critical barrier to expansion. Interest rates across major economies remain above pre-pandemic averages, pushing up financing costs for both home purchases and large-scale renovations. This has constrained discretionary spending, particularly for non-essential upgrades, and intensified consumer price sensitivity. Compounding the challenge is the accelerating DIY culture—an estimated 40% of homeowners in North America now attempt at least one major project independently each year, supported by easy access to tutorials and affordable tools. While this reflects growing consumer engagement, it simultaneously erodes the potential service pipeline for professional contractors and solution providers.
Opportunity:
Urbanization and Smart Home Adoption Unlock Major Growth Opportunities
Rapid urbanization and rising middle-class affluence in emerging markets present the most significant growth opportunities for 2025 and beyond. Asia-Pacific, in particular, is expected to record a CAGR above 7% through 2030, driven by large-scale housing development in China, India, and Southeast Asia. Within these markets, demand for modular renovations, space optimization, and eco-friendly materials is expanding quickly, supported by government-led sustainability initiatives. Another high-value opportunity lies in smart home integration: global spending on connected devices in residential settings is forecast to exceed USD 150 billion by 2028. Companies that can combine traditional renovation services with advanced digital ecosystems are positioned to capture a disproportionate share of this demand.
Trend:
Digital Transformation and DIY Hybrid Models Redefine Market Trends
The market is being reshaped by a dual trend: the proliferation of DIY culture and the rapid integration of digital technologies into home improvement. While DIY activity is democratizing home upgrades, it is also creating a new advisory and hybrid service niche, where professionals provide consultation, specialized installations, or advanced finishing work beyond DIY capabilities. Parallelly, adoption of smart, energy-efficient systems has become mainstream—over 35% of newly remodeled homes in developed markets now feature integrated automation, from smart lighting and HVAC to AI-driven energy management. This convergence of personalization, sustainability, and technology is redefining consumer expectations and compelling service providers to transition toward tech-enabled, value-added business models.
Recent Developments
Dec 2024 – Servpro: Servpro announced the rollout of an AI-driven scheduling and logistics platform across its 2,200+ franchises, designed to reduce project turnaround times by up to 18%. This move strengthens operational efficiency and reinforces its market leadership in rapid-response restoration services.
Feb 2025 – Power Home Remodeling Group: Power Home Remodeling Group unveiled its new solar-ready roofing line, projected to generate over USD 250 million in revenue within its first year. The launch positions the company at the forefront of sustainability-focused residential remodeling.
Apr 2025 – DKI Ventures, LLC: DKI Ventures completed the acquisition of a mid-sized regional restoration firm in the U.S. Midwest, expanding its contractor network by 15%. The deal enhances DKI’s disaster response capacity and broadens its geographic footprint in underserved markets.
Jul 2025 – Rainbow Restoration: Rainbow Restoration entered into a partnership with a leading IoT solutions provider to integrate smart home diagnostics into its service offering, covering water damage, mold detection, and HVAC efficiency. This integration enhances its value proposition and enables data-driven maintenance solutions for residential clients.
Sep 2025 – Lowe’s Companies, Inc.: Lowe’s expanded its professional services platform with a USD 500 million investment into home improvement contractor partnerships, aiming to increase its service-led revenues by 20% by 2026. This expansion underscores the growing convergence of retail and service delivery in the home improvement market.