Global Hookah Market Size, Share & Analysis By Product Type (Flavor, Fruits, Mint, Chocolate, Others), By Age Group (Below 18 Years, 18 to 30 Years, 30 to 50 years, Above 50 years), By Type (2 Hose, 3 Hose), By Application (Group Use, Personal Use), By Distribution Channel (Bars and Cafes, Specialty Stores, Online, Others), Consumer Lifestyle Trends, Regulatory Impact, Competitive Strategies & Forecast 2025–2034
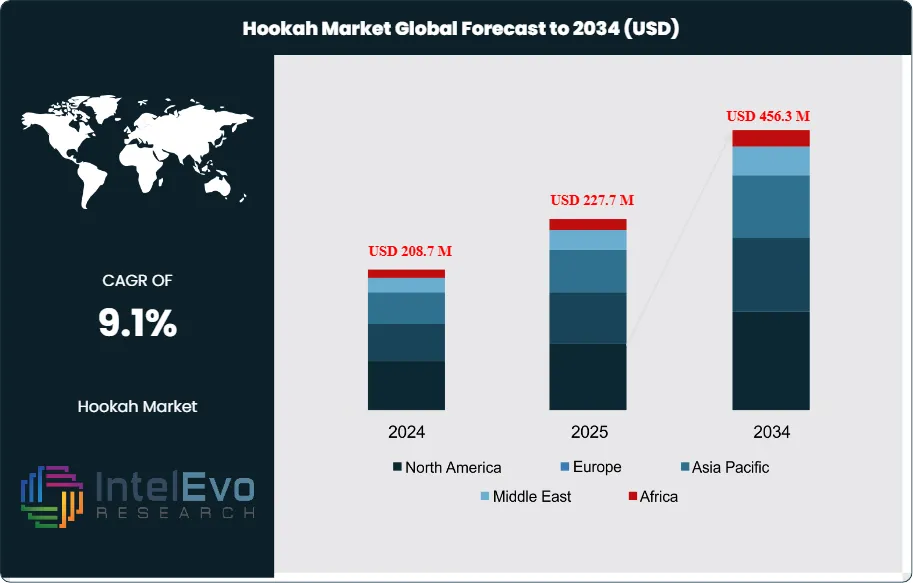
The Hookah Market is valued at approximately USD 208.7 million in 2024 and is projected to reach nearly USD 456.3 million by 2034, expanding at an estimated CAGR of around 9.1% during 2025–2034. Rising café culture, experiential lounges, and flavor innovation continue to fuel category momentum worldwide. Premium charcoal, herbal blends, and designer hookah setups are gaining strong traction among young adults and social nightlife segments. With social media influence and tourism-driven consumption growing rapidly, the hookah culture is evolving into a global lifestyle trend.
The category has transitioned from a niche, culturally anchored pastime to a formal retail-and-lounge ecosystem with resilient, experience-led demand. After steady mid-single-digit expansion through the late 2010s, the market rebounded from pandemic-era disruptions as lounges reopened and at-home occasions persisted; volumes have normalized while average selling prices edged up on premium device designs and flavor innovation. Flavored shisha (molasses) now accounts for an estimated 70–75% of category value, while hardware—pipes, bowls, hoses, and heat-management devices—contributes roughly 20–25%, supported by premiumization and replacement cycles of 18–24 months.
Growth is underpinned by a young adult consumer base, social consumption occasions, and rapid flavor proliferation—fruit, mint, and confectionery notes together exceed 60% of new launches. E-commerce and direct-to-consumer channels, scaling from a low base, are gaining share and are projected to exceed 15% of retail sales by the mid-forecast period as age-gating and track-and-trace mature. On the supply side, modular metal and glass designs and standardized grommets have reduced assembly time and improved durability, while charcoal sourcing remains a sensitivity due to energy and freight cost volatility. Regulatory risk is the principal headwind: taxation, indoor-use restrictions, and flavor limitations in select jurisdictions can dampen lounge footfall and compress margins; health warnings and product standards add compliance costs but also professionalize the market.
Technology is a meaningful differentiator. Heat-management devices, precision-cut bowls, and electric/temperature-controlled heads improve heat distribution and reduce harshness, supporting higher repeat use. Contactless mouthpieces and disposable hoses, scaled post-pandemic, are now embedded hygiene features. Zero-nicotine herbal shisha and reduced-tobacco blends, albeit sub-scale, are expanding at double-digit rates as wellness-minded consumers seek alternatives.
Regionally, the Middle East & North Africa remains the demand anchor (≈35–40% of global spend) with high lounge density and tourist traffic, while South Asia and Türkiye form a sizable second cluster (≈20–25%) driven by cultural adoption. Europe (notably Germany and the U.K.) sustains steady lounge-led growth, and North America, though more regulated, is poised for above-trend expansion in compliant specialty retail. Investment hotspots include premium lounges in GCC cities, flavor houses with robust regulatory dossiers, electric heating platforms, and hygiene-driven accessories—segments positioned to outgrow the market average under the base-case outlook.
Key Takeaways
Market Growth: The global Hookah Market is projected to reach USD 456.3 million from USD 208.7 million in 2024, reflecting a 9.1% CAGR, supported by experience-led social consumption, flavor proliferation, and premium device designs that lift average selling prices.
Flavor Type: Flavored shisha leads with a 51.3% value share; fruit, mint, and chocolate profiles account for the bulk of launches and repeat purchases, sustaining higher-margin mix and brand-led differentiation.
Hookah Configuration: Two-hose hookahs command over 67.2% share, evidencing the primacy of communal sessions and driving incremental sales of hoses, mouthpieces, and heat-management accessories in both retail and lounge settings.
Driver: Demographic momentum from the 18–30 cohort—combined with group use comprising 76.3% of consumption occasions—amplifies lounge footfall and multi-user setups, reinforcing volume resilience and cross-sell opportunities.
Restraint: Regulatory scrutiny on flavors and indoor smoking is the chief headwind; potential flavor limitations could directly pressure more than half of category revenue (51.3% share), while stricter venue rules compress lounge utilization and margin per session.
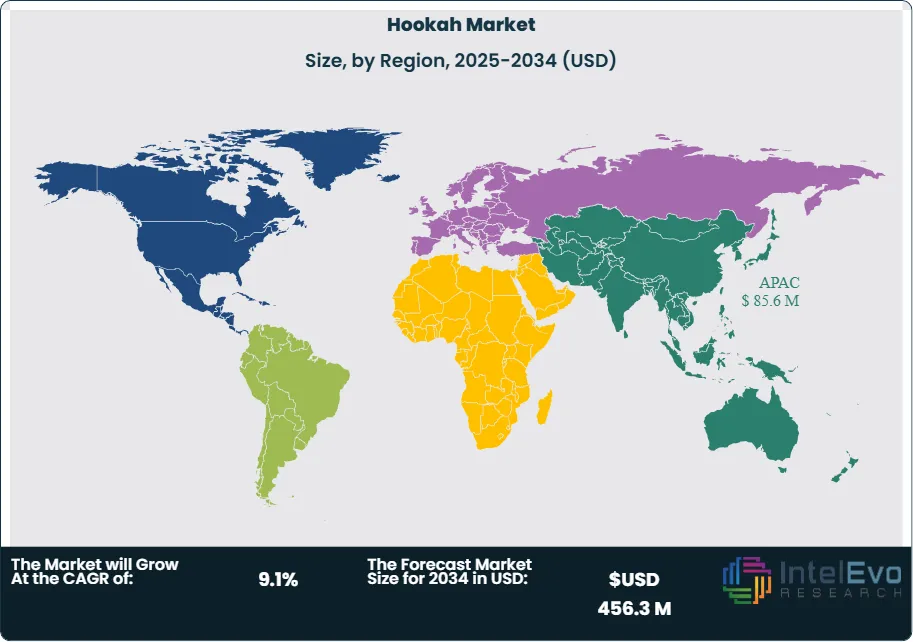
Opportunity: Asia Pacific’s scale leadership (41% share) leaves room for premiumization in Tier-2/3 cities and travel corridors; electric and temperature-controlled heating systems and hygiene-focused accessories are poised for double-digit growth (≈12–14% CAGR) off a low base.
Trend: Product innovation is shifting toward heat-management devices, precision bowls, and contactless/disposable hygiene components, while herbal/zero-nicotine blends expand from niche to meaningful share; online, age-gated sales are on track to reach the mid-teens of channel mix by 2030.
Regional Analysis: Asia Pacific remains the revenue anchor at ~41%, with MENA and parts of Europe forming the next largest clusters via dense lounge networks; North America is smaller but projected to grow faster—high single-digit CAGR—where compliant specialty retail and premium lounges scale.
Product Type Analysis
The product mix in 2025 remains led by flavored shisha, which accounted for just over half of category value in 2023 (≈51.3%) and is holding near the 50–53% range as suppliers expand into dessert, beverage, and spice-inspired profiles. Fruit variants—apple, grape, berry, citrus—continue to anchor repeat purchase behavior and represent the largest slice within the broader “Flavor” umbrella, supported by steady launch cadence from global brands and regional producers. Mint retains outsized loyalty due to its cooling profile and strong mixability, while chocolate appeals to a distinct niche that skews toward premium and seasonal blends.
Innovation is shifting toward hybrid and exotic mixes (the “Others” bucket), including ice/menthol layers, spice–fruit pairings, and zero-nicotine herbal bases. These lines command a 5–10% price premium and are expanding faster than the category average (high-single-digit CAGR through 2030), aided by regulatory-compliant formulations and cleaner sensory profiles. Flavor houses with robust dossiers and consistent batch quality are winning lounge contracts and driving higher-margin assortments.
Age Group Analysis
The 18–30 cohort remains the primary demand engine in 2025, reflecting lounge-centric social occasions, flavor experimentation, and higher frequency of group sessions; this segment typically contributes the majority of occasions in urban markets. The 30–50 segment is expanding via premiumization—larger bowls, precision heat-management devices, and curated flavor flights—lifting average revenue per session in compliant venues.
Sales to individuals below legal purchase age are prohibited in most markets; enforcement tightening keeps this segment immaterial in formal channels. Users above 50 represent a smaller but stable base in culturally embedded markets, favoring classic profiles and traditional set-ups, with loyalty tempered by health and taxation dynamics.
Type Analysis
Two-hose hookahs continue to dominate (≈67.2% share in 2023; broadly stable into 2025) given ease of use, lower unit cost, and suitability for small groups at home and in lounges. Replacement cycles of 18–24 months and the adoption of modular stems sustain repeat hardware demand.
Three-hose systems, while a minority, are gaining traction in high-traffic lounges and event settings as operators seek to maximize table throughput and multi-user engagement. With rising adoption of heat-management devices and quick-light charcoals, 3-hose configurations are projected to outgrow the market (≈7–8% CAGR through 2030) in tourism and student-dense districts.
Application Analysis
Group use remains the dominant application (≈76.3% share in 2023; mid-70s in 2025) due to the social nature of the category and the economics of on-premise service. Higher seating utilization, flavor rotation, and accessory upsell (disposable tips, hoses) continue to lift venue yields.
Personal use, though smaller, is the faster-growing application, propelled by compact devices, electric/temperature-controlled heads, and online flavor subscriptions. From a low base, at-home occasions are expanding at high-single to low-double-digit rates in markets with restrictive indoor-use policies, shifting sales toward premium bowls and hygiene-forward components.
Distribution Channel Analysis
Specialty stores remain the primary retail channel (≈53.5% share in 2023; trending toward ~50–52% in 2025) as consumers value product expertise, authenticity checks, and accessory breadth. Bars and cafés—key on-premise nodes—benefit from post-pandemic social recovery, tourist flows, and curated tasting menus, accounting for a sizable minority of value with above-average margins.
Online continues to gain share from a low base, supported by age-gated checkout, click-and-collect, and direct-to-consumer flavor drops; in leading markets, the online mix is tracking toward the mid-teens by 2027. The “Others” channel (convenience, tobacconists, independent kiosks) caters to refill and impulse purchases, but faces compliance and assortment depth constraints.
End-Use Analysis
Commercial venues (lounges/bars/cafés) account for the largest value share, driven by service fees, premium device fleets, and higher flavor rotation per table. Investments in ventilation, contactless mouthpieces, and staff training have improved session consistency and raised spend per visit.
Household use represents a substantial and rising share as consumers adopt compact devices and electric heating for convenience and discretion. Hospitality and entertainment (hotels, resorts, events) remain smaller but fast-growing, particularly in tourist hubs, festivals, and premium nightlife corridors where curated experiences command price premiums.
By Region
Asia Pacific remains the demand anchor into 2025, sustaining an estimated ~41% global share on the back of large urban populations, cultural adoption, and expanding specialty retail in India, Southeast Asia, and parts of East Asia. The Middle East & Africa continues to post high per-capita consumption with dense lounge networks and tourism-led spend, while Europe (notably Germany and the U.K.) benefits from formalized specialty retail and stringent quality standards.
North America, though smaller, is on a faster trajectory (high-single-digit CAGR through 2030) as compliant specialty retail and premium lounges scale in metropolitan areas. Latin America is emerging from a low base—Mexico and Brazil lead—with growth tempered by regulatory variability and import costs. Across regions, investment hotspots include GCC premium lounges, APAC flavor manufacturing with documented compliance, and age-gated e-commerce platforms in North America and Europe.
By Product Type (Flavor, Fruits, Mint, Chocolate, Others), By Age Group (Below 18 Years, 18 to 30 Years, 30 to 50 years, Above 50 years), By Type (2 Hose, 3 Hose), By Application (Group Use, Personal Use), By Distribution Channel (Bars and Cafes, Specialty Stores, Online, Others)
Research Methodology
Primary Research- 100 Interviews of Stakeholders
Secondary Research
Desk Research
Regional scope
North America (United States, Canada, Mexico)
Latin America (Brazil, Argentina, Columbia)
East Asia And Pacific (China, Japan, South Korea, Australia, Cambodia, Fiji, Indonesia)
Sea And South Asia (India, Singapore, Thailand, Taiwan, Malaysia)
Eastern Europe (Poland, Russia, Czech Republic, Romania)
Western Europe (Germany, U.K., France, Spain, Itlay)
Middle East & Africa (GCC Countries, Egypt, Nigeria, South Africa, Israel)
Competitive Landscape
Evolution Hookahs, Social Smoke, Inc., HAZE Tobacco, LLC, Mya Hookah, ALZawrae Industrial Company, Ed Hardy Hookah, Starbuzz Hookahs, AL Andalus Flavoured Tobacco & Molasses Co. LLC, CLOUD Tobacco, Inc., METCO Ltd, Regal Hookahs, Fumari, Inc., Japan Tobacco, Inc., Anahi Hookahs, MUJEEBSONS, AL Fakher Tobacco Trading LLC, Tianbao Glass
Customization Scope
Customization for segments, region/country-level will be provided. Moreover, additional customization can be done based on the requirements.
Pricing and Purchase Options
Avail customized purchase options to meet your exact research needs. We have three licenses to opt for: Single User License, Multi-User License (Up to 5 Users), Corporate Use License (Unlimited User and Printable PDF).
TABLE OF CONTENTS
1. EXECUTIVE SUMMARY
1.1. MARKET SNAPSHOT
1.2. KEY FINDINGS & INSIGHTS
1.3. ANALYST RECOMMENDATIONS
1.4. FUTURE OUTLOOK
2. RESEARCH METHODOLOGY
2.1. MARKET DEFINITION & SCOPE
2.2. RESEARCH OBJECTIVES: PRIMARY & SECONDARY DATA SOURCES
2.3. DATA COLLECTION SOURCES
2.3.1. COVERAGE OF 100+ PRIMARY RESEARCH/CONSULTATION CALLS WITH INDUSTRY STAKEHOLDERS
FIGURE 17 NORTH AMERICA HOOKAH SYSTEM CURRENT AND FUTURE TYPE ANALYSIS, 2025–2034, (USD MILLION)
FIGURE 18 NORTH AMERICA HOOKAH SYSTEM CURRENT AND FUTURE END USER ANALYSIS, 2025–2034, (USD MILLION)
FIGURE 19 MARKET SHARE BY COUNTRY
FIGURE 20 LATIN AMERICA HOOKAH SYSTEM CURRENT AND FUTURE TYPE ANALYSIS, 2025–2034, (USD MILLION)
FIGURE 21 LATIN AMERICA HOOKAH SYSTEM CURRENT AND FUTURE END USER ANALYSIS, 2025–2034, (USD MILLION)
FIGURE 22 MARKET SHARE BY COUNTRY
FIGURE 23 EASTERN EUROPE HOOKAH SYSTEM CURRENT AND FUTURE TYPE ANALYSIS, 2025–2034, (USD MILLION)
FIGURE 24 EASTERN EUROPE HOOKAH SYSTEM CURRENT AND FUTURE END USER ANALYSIS, 2025–2034, (USD MILLION)
FIGURE 25 MARKET SHARE BY COUNTRY
FIGURE 26 WESTERN EUROPE HOOKAH SYSTEM CURRENT AND FUTURE TYPE ANALYSIS, 2025–2034, (USD MILLION)
FIGURE 27 WESTERN EUROPE HOOKAH SYSTEM CURRENT AND FUTURE END USER ANALYSIS, 2025–2034, (USD MILLION)
FIGURE 28 MARKET SHARE BY COUNTRY
FIGURE 29 EAST ASIA AND PACIFIC HOOKAH SYSTEM CURRENT AND FUTURE TYPE ANALYSIS, 2025–2034, (USD MILLION)
FIGURE 30 EAST ASIA AND PACIFIC HOOKAH SYSTEM CURRENT AND FUTURE END USER ANALYSIS, 2025–2034, (USD MILLION)
FIGURE 31 MARKET SHARE BY COUNTRY
FIGURE 32 SEA AND SOUTH ASIA HOOKAH SYSTEM CURRENT AND FUTURE TYPE ANALYSIS, 2025–2034, (USD MILLION)
FIGURE 33 SEA AND SOUTH ASIA HOOKAH SYSTEM CURRENT AND FUTURE END USER ANALYSIS, 2025–2034, (USD MILLION)
FIGURE 34 MARKET SHARE BY COUNTRY
FIGURE 35 MIDDLE EAST AND AFRICA HOOKAH SYSTEM CURRENT AND FUTURE TYPE ANALYSIS, 2025–2034, (USD MILLION)
FIGURE 36 MIDDLE EAST AND AFRICA HOOKAH SYSTEM CURRENT AND FUTURE END USER ANALYSIS, 2025–2034, (USD MILLION)
FIGURE 37 NORTH AMERICA HOOKAH SYSTEM CURRENT AND FUTURE MARKET VOLUME SHARE REGIONAL ANALYSIS, 2025–2034, (USD MILLION)
FIGURE 38 U.S. HOOKAH SYSTEM CURRENT AND FUTURE TYPE ANALYSIS, 2025–2034, (USD MILLION)
FIGURE 39 U.S. HOOKAH SYSTEM CURRENT AND FUTURE END USER ANALYSIS, 2025–2034, (USD MILLION)
FIGURE 40 CANADA HOOKAH SYSTEM CURRENT AND FUTURE TYPE ANALYSIS, 2025–2034, (USD MILLION)
FIGURE 41 CANADA HOOKAH SYSTEM CURRENT AND FUTURE END USER ANALYSIS, 2025–2034, (USD MILLION)
FIGURE 42 LATIN AMERICA HOOKAH SYSTEM CURRENT AND FUTURE MARKET VOLUME SHARE REGIONAL ANALYSIS, 2025–2034, (USD MILLION)
FIGURE 43 MEXICO HOOKAH SYSTEM CURRENT AND FUTURE TYPE ANALYSIS, 2025–2034, (USD MILLION)
FIGURE 44 MEXICO HOOKAH SYSTEM CURRENT AND FUTURE END USER ANALYSIS, 2025–2034, (USD MILLION)
FIGURE 45 BRAZIL HOOKAH SYSTEM CURRENT AND FUTURE TYPE ANALYSIS, 2025–2034, (USD MILLION)
FIGURE 46 BRAZIL HOOKAH SYSTEM CURRENT AND FUTURE END USER ANALYSIS, 2025–2034, (USD MILLION)
FIGURE 47 ARGENTINA HOOKAH SYSTEM CURRENT AND FUTURE TYPE ANALYSIS, 2025–2034, (USD MILLION)
FIGURE 48 ARGENTINA HOOKAH SYSTEM CURRENT AND FUTURE END USER ANALYSIS, 2025–2034, (USD MILLION)
FIGURE 49 COLUMBIA HOOKAH SYSTEM CURRENT AND FUTURE TYPE ANALYSIS, 2025–2034, (USD MILLION)
FIGURE 50 COLUMBIA HOOKAH SYSTEM CURRENT AND FUTURE END USER ANALYSIS, 2025–2034, (USD MILLION)
FIGURE 51 REST OF LATIN AMERICA HOOKAH SYSTEM CURRENT AND FUTURE TYPE ANALYSIS, 2025–2034, (USD MILLION)
FIGURE 52 REST OF LATIN AMERICA HOOKAH SYSTEM CURRENT AND FUTURE END USER ANALYSIS, 2025–2034, (USD MILLION)
FIGURE 53 EASTERN EUROPE HOOKAH SYSTEM CURRENT AND FUTURE MARKET VOLUME SHARE REGIONAL ANALYSIS, 2025–2034, (USD MILLION)
FIGURE 54 POLAND HOOKAH SYSTEM CURRENT AND FUTURE TYPE ANALYSIS, 2025–2034, (USD MILLION)
FIGURE 55 POLAND HOOKAH SYSTEM CURRENT AND FUTURE END USER ANALYSIS, 2025–2034, (USD MILLION)
FIGURE 56 RUSSIA HOOKAH SYSTEM CURRENT AND FUTURE TYPE ANALYSIS, 2025–2034, (USD MILLION)
FIGURE 57 RUSSIA HOOKAH SYSTEM CURRENT AND FUTURE END USER ANALYSIS, 2025–2034, (USD MILLION)
FIGURE 58 CZECH REPUBLIC HOOKAH SYSTEM CURRENT AND FUTURE TYPE ANALYSIS, 2025–2034, (USD MILLION)
FIGURE 59 CZECH REPUBLIC HOOKAH SYSTEM CURRENT AND FUTURE END USER ANALYSIS, 2025–2034, (USD MILLION)
FIGURE 60 ROMANIA HOOKAH SYSTEM CURRENT AND FUTURE TYPE ANALYSIS, 2025–2034, (USD MILLION)
FIGURE 61 ROMANIA HOOKAH SYSTEM CURRENT AND FUTURE END USER ANALYSIS, 2025–2034, (USD MILLION)
FIGURE 62 REST OF EASTERN EUROPE HOOKAH SYSTEM CURRENT AND FUTURE TYPE ANALYSIS, 2025–2034, (USD MILLION)
FIGURE 63 REST OF EASTERN EUROPE HOOKAH SYSTEM CURRENT AND FUTURE END USER ANALYSIS, 2025–2034, (USD MILLION)
FIGURE 64 WESTERN EUROPE HOOKAH SYSTEM CURRENT AND FUTURE MARKET VOLUME SHARE REGIONAL ANALYSIS, 2025–2034, (USD MILLION)
FIGURE 65 GERMANY HOOKAH SYSTEM CURRENT AND FUTURE TYPE ANALYSIS, 2025–2034, (USD MILLION)
FIGURE 66 GERMANY HOOKAH SYSTEM CURRENT AND FUTURE END USER ANALYSIS, 2025–2034, (USD MILLION)
FIGURE 67 FRANCE HOOKAH SYSTEM CURRENT AND FUTURE TYPE ANALYSIS, 2025–2034, (USD MILLION)
FIGURE 68 FRANCE HOOKAH SYSTEM CURRENT AND FUTURE END USER ANALYSIS, 2025–2034, (USD MILLION)
FIGURE 69 UK HOOKAH SYSTEM CURRENT AND FUTURE TYPE ANALYSIS, 2025–2034, (USD MILLION)
FIGURE 70 UK HOOKAH SYSTEM CURRENT AND FUTURE END USER ANALYSIS, 2025–2034, (USD MILLION)
FIGURE 71 SPAIN HOOKAH SYSTEM CURRENT AND FUTURE TYPE ANALYSIS, 2025–2034, (USD MILLION)
FIGURE 72 SPAIN HOOKAH SYSTEM CURRENT AND FUTURE END USER ANALYSIS, 2025–2034, (USD MILLION)
FIGURE 73 ITALY HOOKAH SYSTEM CURRENT AND FUTURE TYPE ANALYSIS, 2025–2034, (USD MILLION)
FIGURE 74 ITALY HOOKAH SYSTEM CURRENT AND FUTURE END USER ANALYSIS, 2025–2034, (USD MILLION)
FIGURE 75 REST OF WESTERN EUROPE HOOKAH SYSTEM CURRENT AND FUTURE TYPE ANALYSIS, 2025–2034, (USD MILLION)
FIGURE 76 REST OF WESTERN EUROPE HOOKAH SYSTEM CURRENT AND FUTURE END USER ANALYSIS, 2025–2034, (USD MILLION)
FIGURE 77 EAST ASIA AND PACIFIC HOOKAH SYSTEM CURRENT AND FUTURE MARKET VOLUME SHARE REGIONAL ANALYSIS, 2025–2034, (USD MILLION)
FIGURE 78 CHINA HOOKAH SYSTEM CURRENT AND FUTURE TYPE ANALYSIS, 2025–2034, (USD MILLION)
FIGURE 79 CHINA HOOKAH SYSTEM CURRENT AND FUTURE END USER ANALYSIS, 2025–2034, (USD MILLION)
FIGURE 80 JAPAN HOOKAH SYSTEM CURRENT AND FUTURE TYPE ANALYSIS, 2025–2034, (USD MILLION)
FIGURE 81 JAPAN HOOKAH SYSTEM CURRENT AND FUTURE END USER ANALYSIS, 2025–2034, (USD MILLION)
FIGURE 82 AUSTRALIA HOOKAH SYSTEM CURRENT AND FUTURE TYPE ANALYSIS, 2025–2034, (USD MILLION)
FIGURE 83 AUSTRALIA HOOKAH SYSTEM CURRENT AND FUTURE END USER ANALYSIS, 2025–2034, (USD MILLION)
FIGURE 84 CAMBODIA HOOKAH SYSTEM CURRENT AND FUTURE TYPE ANALYSIS, 2025–2034, (USD MILLION)
FIGURE 85 CAMBODIA HOOKAH SYSTEM CURRENT AND FUTURE END USER ANALYSIS, 2025–2034, (USD MILLION)
FIGURE 86 FIJI HOOKAH SYSTEM CURRENT AND FUTURE TYPE ANALYSIS, 2025–2034, (USD MILLION)
FIGURE 87 FIJI HOOKAH SYSTEM CURRENT AND FUTURE END USER ANALYSIS, 2025–2034, (USD MILLION)
FIGURE 88 INDONESIA HOOKAH SYSTEM CURRENT AND FUTURE TYPE ANALYSIS, 2025–2034, (USD MILLION)
FIGURE 89 INDONESIA HOOKAH SYSTEM CURRENT AND FUTURE END USER ANALYSIS, 2025–2034, (USD MILLION)
FIGURE 90 SOUTH KOREA HOOKAH SYSTEM CURRENT AND FUTURE TYPE ANALYSIS, 2025–2034, (USD MILLION)
FIGURE 91 SOUTH KOREA HOOKAH SYSTEM CURRENT AND FUTURE END USER ANALYSIS, 2025–2034, (USD MILLION)
FIGURE 92 REST OF EAST ASIA AND PACIFIC HOOKAH SYSTEM CURRENT AND FUTURE TYPE ANALYSIS, 2025–2034, (USD MILLION)
FIGURE 93 REST OF EAST ASIA AND PACIFIC HOOKAH SYSTEM CURRENT AND FUTURE END USER ANALYSIS, 2025–2034, (USD MILLION)
FIGURE 94 SEA AND SOUTH ASIA HOOKAH SYSTEM CURRENT AND FUTURE MARKET VOLUME SHARE REGIONAL ANALYSIS, 2025–2034, (USD MILLION)
FIGURE 95 BANGLADESH HOOKAH SYSTEM CURRENT AND FUTURE TYPE ANALYSIS, 2025–2034, (USD MILLION)
FIGURE 96 BANGLADESH HOOKAH SYSTEM CURRENT AND FUTURE END USER ANALYSIS, 2025–2034, (USD MILLION)
FIGURE 97 NEW ZEALAND HOOKAH SYSTEM CURRENT AND FUTURE TYPE ANALYSIS, 2025–2034, (USD MILLION)
FIGURE 98 NEW ZEALAND HOOKAH SYSTEM CURRENT AND FUTURE END USER ANALYSIS, 2025–2034, (USD MILLION)
FIGURE 99 INDIA HOOKAH SYSTEM CURRENT AND FUTURE TYPE ANALYSIS, 2025–2034, (USD MILLION)
FIGURE 100 INDIA HOOKAH SYSTEM CURRENT AND FUTURE END USER ANALYSIS, 2025–2034, (USD MILLION)
FIGURE 101 SINGAPORE HOOKAH SYSTEM CURRENT AND FUTURE TYPE ANALYSIS, 2025–2034, (USD MILLION)
FIGURE 102 SINGAPORE HOOKAH SYSTEM CURRENT AND FUTURE END USER ANALYSIS, 2025–2034, (USD MILLION)
FIGURE 103 THAILAND HOOKAH SYSTEM CURRENT AND FUTURE TYPE ANALYSIS, 2025–2034, (USD MILLION)
FIGURE 104 THAILAND HOOKAH SYSTEM CURRENT AND FUTURE END USER ANALYSIS, 2025–2034, (USD MILLION)
FIGURE 105 TAIWAN HOOKAH SYSTEM CURRENT AND FUTURE TYPE ANALYSIS, 2025–2034, (USD MILLION)
FIGURE 106 TAIWAN HOOKAH SYSTEM CURRENT AND FUTURE END USER ANALYSIS, 2025–2034, (USD MILLION)
FIGURE 107 MALAYSIA HOOKAH SYSTEM CURRENT AND FUTURE TYPE ANALYSIS, 2025–2034, (USD MILLION)
FIGURE 108 MALAYSIA HOOKAH SYSTEM CURRENT AND FUTURE END USER ANALYSIS, 2025–2034, (USD MILLION)
FIGURE 109 REST OF SEA AND SOUTH ASIA HOOKAH SYSTEM CURRENT AND FUTURE TYPE ANALYSIS, 2025–2034, (USD MILLION)
FIGURE 110 REST OF SEA AND SOUTH ASIA HOOKAH SYSTEM CURRENT AND FUTURE END USER ANALYSIS, 2025–2034, (USD MILLION)
FIGURE 111 MIDDLE EAST AND AFRICA HOOKAH SYSTEM CURRENT AND FUTURE MARKET VOLUME SHARE REGIONAL ANALYSIS, 2025–2034, (USD MILLION)
FIGURE 112 GCC COUNTRIES HOOKAH SYSTEM CURRENT AND FUTURE TYPE ANALYSIS, 2025–2034, (USD MILLION)
FIGURE 113 GCC COUNTRIES HOOKAH SYSTEM CURRENT AND FUTURE END USER ANALYSIS, 2025–2034, (USD MILLION)
FIGURE 114 SAUDI ARABIA HOOKAH SYSTEM CURRENT AND FUTURE TYPE ANALYSIS, 2025–2034, (USD MILLION)
FIGURE 115 SAUDI ARABIA HOOKAH SYSTEM CURRENT AND FUTURE END USER ANALYSIS, 2025–2034, (USD MILLION)
FIGURE 116 UAE HOOKAH SYSTEM CURRENT AND FUTURE TYPE ANALYSIS, 2025–2034, (USD MILLION)
FIGURE 117 UAE HOOKAH SYSTEM CURRENT AND FUTURE END USER ANALYSIS, 2025–2034, (USD MILLION)
FIGURE 118 BAHRAIN HOOKAH SYSTEM CURRENT AND FUTURE TYPE ANALYSIS, 2025–2034, (USD MILLION)
FIGURE 119 BAHRAIN HOOKAH SYSTEM CURRENT AND FUTURE END USER ANALYSIS, 2025–2034, (USD MILLION)
FIGURE 120 KUWAIT HOOKAH SYSTEM CURRENT AND FUTURE TYPE ANALYSIS, 2025–2034, (USD MILLION)
FIGURE 121 KUWAIT HOOKAH SYSTEM CURRENT AND FUTURE END USER ANALYSIS, 2025–2034, (USD MILLION)
FIGURE 122 OMAN HOOKAH SYSTEM CURRENT AND FUTURE TYPE ANALYSIS, 2025–2034, (USD MILLION)
FIGURE 123 OMAN HOOKAH SYSTEM CURRENT AND FUTURE END USER ANALYSIS, 2025–2034, (USD MILLION)
FIGURE 124 QATAR HOOKAH SYSTEM CURRENT AND FUTURE TYPE ANALYSIS, 2025–2034, (USD MILLION)
FIGURE 125 QATAR HOOKAH SYSTEM CURRENT AND FUTURE END USER ANALYSIS, 2025–2034, (USD MILLION)
FIGURE 126 EGYPT HOOKAH SYSTEM CURRENT AND FUTURE TYPE ANALYSIS, 2025–2034, (USD MILLION)
FIGURE 127 EGYPT HOOKAH SYSTEM CURRENT AND FUTURE END USER ANALYSIS, 2025–2034, (USD MILLION)
FIGURE 128 NIGERIA HOOKAH SYSTEM CURRENT AND FUTURE TYPE ANALYSIS, 2025–2034, (USD MILLION)
FIGURE 129 NIGERIA HOOKAH SYSTEM CURRENT AND FUTURE END USER ANALYSIS, 2025–2034, (USD MILLION)
FIGURE 130 SOUTH AFRICA HOOKAH SYSTEM CURRENT AND FUTURE TYPE ANALYSIS, 2025–2034, (USD MILLION)
FIGURE 131 SOUTH AFRICA HOOKAH SYSTEM CURRENT AND FUTURE END USER ANALYSIS, 2025–2034, (USD MILLION)
FIGURE 132 ISRAEL HOOKAH SYSTEM CURRENT AND FUTURE TYPE ANALYSIS, 2025–2034, (USD MILLION)
FIGURE 133 ISRAEL HOOKAH SYSTEM CURRENT AND FUTURE END USER ANALYSIS, 2025–2034, (USD MILLION)
FIGURE 134 REST OF MEA HOOKAH SYSTEM CURRENT AND FUTURE TYPE ANALYSIS, 2025–2034, (USD MILLION)
FIGURE 135 REST OF MEA HOOKAH SYSTEM CURRENT AND FUTURE END USER ANALYSIS, 2025–2034, (USD MILLION)
FIGURE 136 U. S. MARKET SHARE ANALYSIS BY TYPE (2024)
FIGURE 137 U. S. MARKET SHARE ANALYSIS BY END USER (2024)
FIGURE 138 CANADA MARKET SHARE ANALYSIS BY TYPE (2024)
FIGURE 139 CANADA MARKET SHARE ANALYSIS BY END USER (2024)
FIGURE 140 MEXICO MARKET SHARE ANALYSIS BY TYPE (2024)
FIGURE 141 MEXICO MARKET SHARE ANALYSIS BY END USER (2024)
FIGURE 142 CHINA MARKET SHARE ANALYSIS BY TYPE (2024)
FIGURE 143 CHINA MARKET SHARE ANALYSIS BY END USER (2024)
FIGURE 144 JAPAN MARKET SHARE ANALYSIS BY TYPE (2024)
FIGURE 145 JAPAN MARKET SHARE ANALYSIS BY END USER (2024)
FIGURE 146 INDIA MARKET SHARE ANALYSIS BY TYPE (2024)
FIGURE 147 INDIA MARKET SHARE ANALYSIS BY END USER (2024)
FIGURE 148 SOUTH KOREA MARKET SHARE ANALYSIS BY TYPE (2024)
FIGURE 149 SOUTH KOREA MARKET SHARE ANALYSIS BY END USER (2024)
FIGURE 150 SAUDI ARABIA MARKET SHARE ANALYSIS BY TYPE (2024)
FIGURE 151 SAUDI ARABIA MARKET SHARE ANALYSIS BY END USER (2024)
FIGURE 152 UAE MARKET SHARE ANALYSIS BY TYPE (2024)
FIGURE 153 UAE MARKET SHARE ANALYSIS BY END USER (2024)
FIGURE 154 EGYPT MARKET SHARE ANALYSIS BY TYPE (2024)
FIGURE 155 EGYPT MARKET SHARE ANALYSIS BY END USER (2024)
FIGURE 156 NIGERIA MARKET SHARE ANALYSIS BY TYPE (2024)
FIGURE 157 NIGERIA MARKET SHARE ANALYSIS BY END USER (2024)
FIGURE 158 SOUTH AFRICA MARKET SHARE ANALYSIS BY TYPE (2024)
FIGURE 159 SOUTH AFRICA MARKET SHARE ANALYSIS BY END USER (2024)
FIGURE 160 GERMANY MARKET SHARE ANALYSIS BY TYPE (2024)
FIGURE 161 GERMANY MARKET SHARE ANALYSIS BY END USER (2024)
FIGURE 162 FRANCE MARKET SHARE ANALYSIS BY TYPE (2024)
FIGURE 163 FRANCE MARKET SHARE ANALYSIS BY END USER (2024)
FIGURE 164 UK MARKET SHARE ANALYSIS BY TYPE (2024)
FIGURE 165 UK MARKET SHARE ANALYSIS BY END USER (2024)
FIGURE 166 SPAIN MARKET SHARE ANALYSIS BY TYPE (2024)
FIGURE 167 SPAIN MARKET SHARE ANALYSIS BY END USER (2024)
FIGURE 168 ITALY MARKET SHARE ANALYSIS BY TYPE (2024)
FIGURE 169 ITALY MARKET SHARE ANALYSIS BY END USER (2024)
FIGURE 170 BRAZIL MARKET SHARE ANALYSIS BY TYPE (2024)
FIGURE 171 BRAZIL MARKET SHARE ANALYSIS BY END USER (2024)
FIGURE 172 ARGENTINA MARKET SHARE ANALYSIS BY TYPE (2024)
FIGURE 173 ARGENTINA MARKET SHARE ANALYSIS BY END USER (2024)
FIGURE 174 COLUMBIA MARKET SHARE ANALYSIS BY TYPE (2024)
FIGURE 175 COLUMBIA MARKET SHARE ANALYSIS BY END USER (2024)
FIGURE 176 GLOBAL HOOKAH SYSTEM CURRENT AND FUTURE MARKET KEY COUNTRY LEVEL ANALYSIS, 2024–2034, (USD MILLION)
FIGURE 177 FINANCIAL OVERVIEW:
Key Player Analysis
HAZE TOBACCO, LLC: Positioned as a challenger-innovator in the U.S. premium shisha segment, Haze focuses on artisanal blends, charcoal, and accessories aimed at lounge operators and enthusiast consumers. The company emphasizes “hand-crafted” flavor development and maintains active wholesale channels, signaling a scale-up stance for 2025 as lounges and specialty retail continue to premiumize. Founded in 2011 and based in the U.S., Haze’s small-batch ethos and flavor portfolio (including dessert and spice-forward profiles) differentiate it against value-priced incumbents while sustaining higher average selling prices.
Strategically, Haze is likely to lean into age-gated e-commerce and data-driven SKU curation, using limited-release runs and lounge partnerships to defend shelf space. Its premium positioning, coupled with operational agility, aligns with 2025 demand for differentiated flavor experiences and hygiene-forward accessories, supporting mid- to high-single-digit revenue growth in compliant North American metros.
The Kraft Heinz Company: Kraft Heinz is not a direct shisha producer; however, it is a global flavor and condiments leader with robust R&D, packaging, and brand-building capabilities that make it an adjacent potential partner for co-developed flavor systems, licensing, and sensory research. In 2025 the company continues to spotlight portfolio innovation—e.g., globally inspired “Flavor Tour” sauces—underscoring institutional expertise in consumer-led flavor creation and rapid commercialization. From a strategic lens, Kraft Heinz’s scale (Q2 2025 net sales of ~$6.4B) and stepped-up media investment (planned +20% in North America in H2 2025) strengthen its optionality to enter or support adjacent categories through partnerships, white-label development, or data-sharing on flavor trends. For hookah incumbents, collaboration with Kraft Heinz could accelerate compliant flavor pipelines and packaging quality while preserving capital; conversely, there is no evidence of direct category entry, keeping competitive risk low in the near term.
AL ANDALUS FLAVOURED TOBACCO & MOLASSES CO. LLC: A regional challenger with manufacturing in Jordan’s Zarqa Free Zone, Al Andalus (marketed globally via the Al Rayan Molasses brand) focuses on flavored tobacco/molasses production with an export-oriented footprint. Public directories indicate a mid-sized operation (≈51–100 employees), supporting agile batch runs and country-specific formulations—an advantage as regulations diverge across MENA and nearby markets.
The company’s differentiation rests on freshness-locked packaging and a portfolio tuned to classic fruit and hybrid blends, positioning it well for lounge contracts in price-sensitive markets. Continued investment in packaging and quality control should lift reorder rates; tighter supplier compliance and documentation would further enable penetration into the EU and GCC, where authorities increasingly demand traceability and standardized labeling.
AL FAKHER TOBACCO TRADING LLC: Al Fakher is the category’s global leader, with distribution in 100+ countries and a reputation for consistent quality and broad flavor coverage. The brand’s scale, manufacturing depth, and global route-to-market give it outsized bargaining power with distributors and lounges, reinforcing its leadership as demand shifts toward premium, consistent blends in 2025.
Strategically, Al Fakher continues to expand flavor lines and localized assortments, including dedicated U.S. product portfolios, while investing in product and sensory innovation to sustain repeat purchase and defend share against niche entrants. Its ability to harmonize compliance, quality, and supply reliability remains a core moat—particularly valuable as more markets enforce age-gating, ventilation standards, and label transparency.
Market Key Players
Evolution Hookahs
Social Smoke, Inc.
HAZE Tobacco, LLC
Mya Hookah
ALZawrae Industrial Company
Ed Hardy Hookah
Starbuzz Hookahs
AL Andalus Flavoured Tobacco & Molasses Co. LLC
CLOUD Tobacco, Inc.
METCO Ltd
Regal Hookahs
Fumari, Inc.
Japan Tobacco, Inc.
Anahi Hookahs
MUJEEBSONS
AL Fakher Tobacco Trading LLC
Tianbao Glass
Driver:
Experience-Led Demand
As of 2025, the hookah category is benefiting from experience-led consumption and broader cultural adoption, with the market tracking a ~6–7% CAGR through 2033 on the back of flavor proliferation and communal use. Flavored shisha remains the economic engine (≈51% of value), while group occasions account for roughly three-quarters of consumption, sustaining lounge footfall and higher per-visit spend. The 18–30 demographic anchors frequency and trial, and two-hose configurations (≈67% share) optimize small-group sessions without sacrificing throughput. Product upgrades—heat-management devices, precision bowls, and modular stems—lift repeat purchases and average selling prices, reinforcing premium mix and vendor bargaining power.
Flavor Innovation Power Category Growth
Strategically, this combination of social utility and product innovation expands pricing latitude for brands, increases lifetime value in subscription-like replenishment (charcoal, flavors, hoses), and supports the scaling of compliant specialty retail. Operators that couple fast flavor rotation with hygiene add-ons (e.g., disposable tips) typically report mid-single-digit basket uplifts and higher table utilization, compounding growth.
Restraint:
Regulatory Pressure
Health concerns and regulation remain the principal brakes on expansion. Flavor restrictions directly expose over half of category revenue, while indoor-use and ventilation rules can reduce lounge capacity utilization by 10–20% during enforcement cycles. Compliance costs—age-gating, labeling, and track-and-trace—add 100–200 bps to operating expense for smaller retailers, narrowing margins and discouraging new venue openings. Geopolitical frictions and energy volatility raise input costs for charcoal and metal components, tightening gross margins by an estimated 150–250 bps in import-dependent markets.
Health Concerns Limit Market Expansion
For investors, the result is heightened earnings variability and rising working-capital needs. Brands with diversified portfolios (including herbal/zero-nicotine lines) and multi-channel distribution are better insulated, while single-market lounge operators face the steepest downside if local restrictions tighten.
Opportunity:
Digital Channels
Digitally enabled distribution and alternative heating platforms represent the clearest upside. Age-gated e-commerce is expanding from a low base and is on pace to capture the mid-teens of retail sales by 2027–2028, supported by D2C flavor drops and auto-replenishment. Electric/temperature-controlled heads, though sub-scale today, are projected to grow at ~12–15% CAGR through 2030 as venues seek consistent heat, lower setup time, and improved hygiene. Combined, these vectors could add USD 40–60 million in incremental category revenue by 2030, with outsized gains in North America, the GCC, and urban APAC.
Electric Heating Systems Unlock New Revenue
Strategically, the winners will pair compliant digital funnels with data-driven merchandising (SKU rationalization, cohort-based flavor curation) and invest in standardized, modular hardware fleets that reduce maintenance and accelerate table turns. Partnerships with payment/ID-verification providers and last-mile networks will further compress cart-to-delivery times and build defensible moats.
Trend:
Rapid Shift Toward Herbal
Herbal and zero-nicotine shisha is scaling from niche to meaningful share as wellness-minded consumers and venue operators seek regulatory-light options. From a low single-digit base in 2020, nicotine-free lines are tracking toward 10–12% of value by 2030 in liberalized markets, growing >15% annually as formulations improve smoke density and flavor fidelity. Leading flavor houses now offer parallel SKUs (tobacco and herbal), enabling rapid menu pivots when rules tighten.
Zero-Nicotine Shisha Formats
This shift is reinforced by on-premise adoption of hygiene-first accessories and electric heating, which together reduce perceived health risks and operational complexity. For brands, the strategic play is portfolio optionality: maintain compliance-ready dossiers, emphasize sensory parity in herbal lines, and target premium price points where consumers accept a 5–10% markup for “cleaner” experiences.
Recent Developments
Dec 2024 – Fumari: Relaunched its direct-to-consumer platform with enhanced merchandising, subscription options, and customizable flavor bundles to improve conversion and repeat purchase economics. This upgrade strengthens Fumari’s D2C moat and shifts a greater share of sales online in North America and Europe, improving data visibility and pricing control.
Jan 2025 – Advanced Inhalation Rituals (AIR): Introduced OOKA Pro, a charcoal-free, pod-based system designed for hospitality venues, expanding the company’s hardware ecosystem beyond consumer devices. The launch positions AIR to capture on-premise demand with faster setup, consistent sessions, and premium pricing per table.
Apr 2025 – AIR/OOKA: Reported cumulative sales of ~14,000 OOKA devices since the product’s market debut in 2023, underscoring rising adoption of electric shisha formats. Early scale validates the reduced-charcoal thesis and supports further channel expansion into regulated markets.
Jul 2025 – Fumari: Rolled out two new SKUs—Pink Gummi Bear and Orange Gummi Bear—supported by a branded content push and retail listings, expanding its candy/dessert flavor portfolio. The extensions reinforce Fumari’s flavor leadership and drive mix premiumization in U.S. specialty retail.
Aug 2025 – Al Fakher x Cookies: Launched a co-branded flavor collection (five SKUs) marking Cookies’ first entry into the hookah category; retail availability began June 25 via select stores and online partners. The collaboration broadens Al Fakher’s reach into lifestyle-led audiences and introduces cross-category marketing muscle to the shisha segment.
Sep 2025 – AIR (InterTabac 2025): Showcased a full inhalation portfolio—Al Fakher, OOKA Pro, and new systems such as Crown Switch—with survey data indicating ~90% of shisha businesses expect demand to rise over the next two years. The trade show presence consolidates AIR’s category leadership and accelerates B2B pipeline development across EU hospitality.