Hot Tub Market Size, Trends, Growth & Forecast 2034 | 6.2% CAG
Global Hot Tub Market Size, Share & Analysis By Type (Portable Hot Tubs, Fixed Hot Tubs), By End-User (Residential, Commercial), By Distribution Channel (Offline, Online) Industry Regions & Key Players – Market Structure, Consumer Trends, Pricing Analysis, Competitive Strategies & Forecast 2025–2034
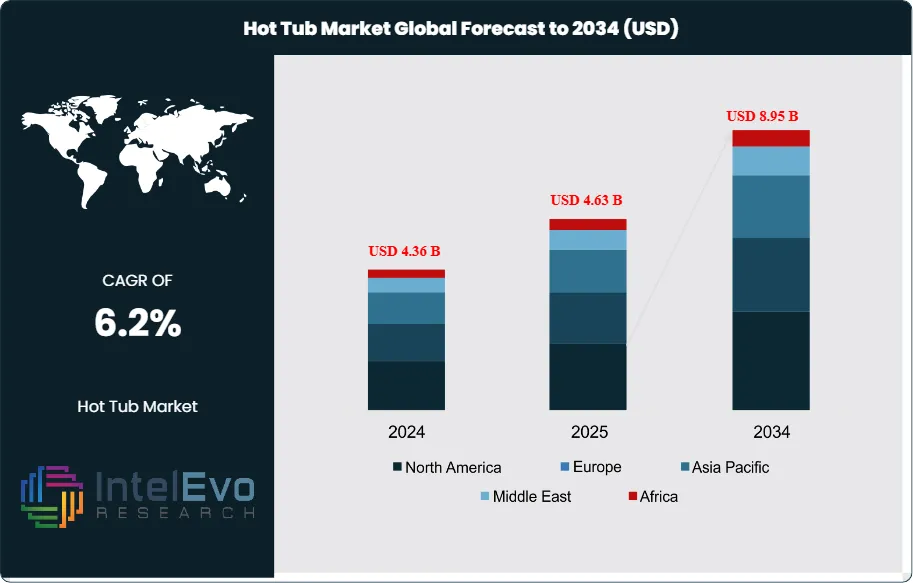
The Hot Tub Market was valued at approximately USD 4.36 Billion in 2024 and is expected to reach nearly USD 8.95 Billion by 2034, expanding at an estimated CAGR of around 6.2% during 2025–2034. Growing consumer focus on home wellness, hydrotherapy benefits, and premium outdoor living experiences is driving strong global demand. With smart features, energy-efficient designs, and rising residential installations, hot tubs are rapidly evolving into essential wellness assets. The market outlook remains highly positive as lifestyle upgrades and health-driven purchasing continue to surge.
Slowly evolving from a niche vacation home investment to a home-wellness mainstay, marketplace size expansion is based upon steady residential demand and growing commercial presence across hotels, resorts, and wellness centers. The pandemic-fueled life trends towards at-home rest and renewal continue to support penetration with the installed base already huge: 5.8–7.3 million units are predicted to number alone in the United States, and average unit lifespan is about 7.5 years, supporting a long-term replacement cycle and a healthy secondhand market with some 40% being resold/gifted.
Demand is spurred by hydrotherapy's perceived health benefit—stressed and muscle relief and circulation boost—and by sleep promotion, a prominent need since 132 million Americans experience weekly sleep disorders; a 15-minute soak 90 minutes before bedtime can help bring deeper sleep. Cost facilitates adoption: typical U.S. installations cost near USD 318 (standard range USD 157–490 based on difficulty at site), and periodic operating costs of some USD 10–20 per month keep ownership affordable. Supply-side issues persist, however. U.S. manufacture decreased at an average 0.6% annually during 2017–2022 amidst price pressure, supply-chain disruption, and offshoring competition and by regulation of safety/energy, water-constraint sites during dry spells, and volatility of inputs (e.g., pumps, acrylic).
Technology is redefining value propositions. IoT-enabled "smart" tubs include remote temperature and filter control, usage tracking, and predictive maintenance; advanced insulation, variable-speed pumps, and interconnections with heat pumps minimize energy usage; and advanced sanitation (UV/ozone) reduces chemical consumption. Premiumization is enhanced by customizable jets, LED ambiance and onboard sound, with AI-enhanced diagnostics minimizing downtime and service cost.
Regionally, North America leads with installed base and retail infrastructure—some 4,500 U.S.-based retailers host 360,700 spa-industry workers, with four key hot-tub vendors generating 58% revenue and typical outlet generating ~USD 500,000 per year—indicating a consolidated but scaleable channel. Europe is still large and is accelerating upgrade retrofits based on efficiency-driven initiatives, and Asia Pacific is fastest-growing opportunity as middle-class demand shifts to transportable and mid-premium units. Infrastructure hotspots are smart, energy-efficient platforms, aftermarket chemicals and services, and hospitality/wellness initiatives, and adherence to safety guidelines (e.g., 104°F max; ~100°F kids) and sustainability attributes will create differentiation to winners.
Key Takeaways
Market Growth: The hot tub industry is set to grow to USD 4.36 Billion in 2024 to USD 8.95 Billion by 2034 (CAGR 6.2%, 2025–2034), driven by home adoption for health and wellness reasons, a huge base for installations (≈5.8–7.3 million units across the United States), and durable replacements/upgrade cycles (≈7.5-year average tenure)
Product Type: Portable hot tubs lead with ~57% share through lower capex and fast installation; average cost of U.S. install is ~USD 318 (range USD 157–490) with ongoing use being ~USD 10–20/month and further reinforcing affordability.
End Use: Residential accounts for ~74% demand because homeowners want hydrotherapy to assist with stress, to relax muscles and to sleep—as relevant because 132 million Americans suffer weekly sleep interruptions; 15 minutes soak 90 minutes prior to bedtime makes sleep deeper.
Distribution Channel: Offline retailing captures ~65% share through experience-based buying and services support through ~4,500 U.S.-based specialties stores and average sales through outlets nearing USD 500,000 reinforcing local demo, install, and after-sales amenities.
Driver: Health-and-wellness monetization is accelerating: post-pandemic home-spa investments, hospitality upgrades, and increasing aftermarket services (chemicals, filters, maintenance) all boost utilization and lifetime value per unit.
Restraint: Supply-side pressure persists with U.S.-made hot-tub manufacture decreasing at roughly 0.6% annually (2017–2022), and volatility of input prices (pumps and acrylics) and water/energy regulations keeps margins back and prolongs lead times for water-/energy-constricted
Opportunity: Smart/energy-efficient products (Internet of Things controls, variable-speed pumps, add-on heat pumps, UV/ozone sanitations) and aftermarket subscription services can expand beyond base business; incremental global revenue of ~USD 2.2 billion to 2033 suggests opportunity for premium products and subscription revenue services.
Trend: Scaling through digitization—remote tracking and monitoring, usage-based analysis, and AI-enhanced diagnostics reduce maintenance cost and downtime—while premiumization (LED ambiance, customizable jets, integrated sound) boosts ASPs disproportionately to opex increases.
Regional Analysis: North America leads at ~38% share by virtue of high disposable incomes and an efficient retail/service network; Europe remains relevant with efficiency-driven retro fit demand, and Asia Pacific is the fastest-growing opportunity as middle-class end-users increasingly adopt portable and mid-premium models and is projected to outgrow global CAGR.
Type Analysis
Portable hot tubs remain the volume anchor of the category, accounting for an estimated ~57% of global sales in the 2024 baseline and sustaining leadership into 2025 as households prioritize fast installation, lower upfront cost, and the flexibility to relocate units. Continued innovation in inflatable and lightweight shell designs, better insulation, and variable-speed pumps has improved total cost of ownership—typical U.S. installation averages around USD 318, with ongoing energy/maintenance outlays commonly in the USD 10–20 per month range—supporting first-time adoption and upgrades alike. As manufacturers bundle app-based controls and remote diagnostics into sub-premium price tiers, portable systems are expected to defend a >55% share through the medium term.
Fixed hot tubs (≈43% in 2024) address a different buyer profile: owners investing in durable outdoor living spaces, hospitality venues, and wellness rooms seeking higher jet density, bespoke seating, and integrated lighting/audio. Although higher installation complexity and site prep extend project timelines, fixed units can enhance property value and command higher average selling prices (ASPs). Into 2025–2030, premiumization—multi-zone hydrotherapy, heat-pump add-ons, UV/ozone sanitation—should lift mix and margins, even as portables continue to dominate unit volumes.
End-User Analysis
Residential demand anchors market scale, representing roughly 74% of purchases in 2024 and remaining the primary growth engine in 2025 amid sustained home-wellness spending, renovation activity, and work-from-home lifestyles. Health outcomes drive intent: hydrotherapy for stress relief and recovery, alongside sleep benefits (e.g., short warm-water sessions before bedtime) underpin frequent use and a resilient replacement cycle of ~7–8 years. Broad price ladders—from entry inflatables to feature-rich premium models—have widened household addressability across regions.
Commercial deployments—approximately 26% of the market—span hotels, resorts, fitness/wellness centers, and short-term rental properties, where hot tubs elevate guest experience and RevPAR. Purchasing cycles are longer and compliance stricter (water quality, temperature limits, safety), but specification levels are higher, supporting ASPs and aftermarket revenue (chemicals, filters, service contracts). With wellness tourism expanding and hospitality capex normalizing post-pandemic, 2025–2028 should see steady commercial retrofit and new-build demand, particularly in resort corridors and alpine/leisure destinations.
Distribution Channel Analysis
Offline retail remains the dominant route to market (~65% share in 2024) and continues to be decisive in 2025 due to experiential selling—on-site wet tests, installation planning, financing, and service onboarding. The channel’s depth, especially in North America (≈4,500 specialty outlets with average store revenue near USD 0.5 million), supports high-touch consultative sales and localized after-sales care that reduce ownership friction and boost attachment rates for accessories and maintenance plans.
Online accounts for ~35% and is the faster-growing complement as consumers comparison-shop across brands, configurations, and delivery options. Enhanced digital journeys—3D/AR visualization, virtual consultations, and transparent installation quoting—are compressing decision cycles and extending reach into underserved ZIP codes. The prevailing outlook is omnichannel: dealers integrate e-commerce front ends and marketplace presence while preserving in-person services (site surveys, delivery/craning, water-care training) that are critical to satisfaction and repeat purchases.
Regional Analysis
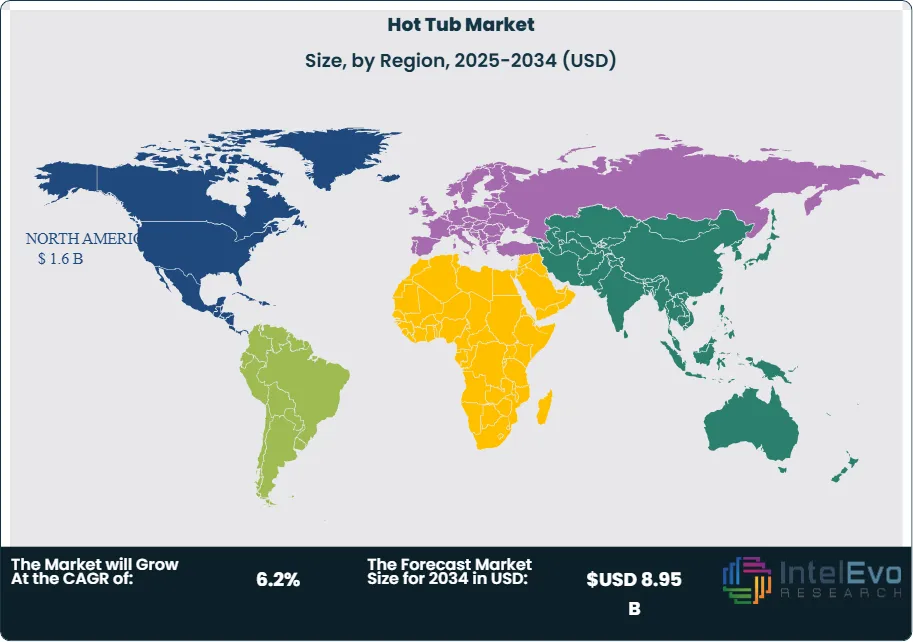
North America leads with about 38% share (≈USD 1.6 billion in 2024), supported by a large installed base, high discretionary spending, and mature retail/service infrastructure. The U.S. remains the bellwether for premium features and aftermarket monetization, while Canada benefits from strong cottage/leisure home ownership. Europe is a sizeable, more efficiency-driven market in 2025, with Northern and Western countries emphasizing low-energy operation, smart controls, and stringent safety and environmental standards that favor insulated cabinets and advanced filtration.
Asia Pacific is the fastest-rising opportunity through 2030 as middle-income households in China and Southeast Asia trade up to portable and mid-premium units, and Japan/Australia sustain steady replacement. Vendor partnerships with local installers and hospitality groups are expanding access and service coverage. Latin America and the Middle East & Africa are smaller but expanding, propelled by resort development, luxury residential projects, and urban affluent cohorts in Brazil, Mexico, the UAE, and Saudi Arabia. Across emerging regions, success hinges on climate-appropriate energy solutions, financing options, and dealer networks that can execute complex installations reliably.
Comparative Summary
The three profiled companies occupy distinct strategic positions across the hot tub market's competitive spectrum. Jacuzzi Brands commands the market from its leadership position with unmatched brand equity, a multi-brand portfolio spanning all price tiers, and the financial resources of Investindustrial. Bullfrog Spas competes as an innovator-challenger, using its patented JetPak technology, domestic manufacturing base, and factory-direct retail model to carve out a 20% global share. Nordic Hot Tubs fills a deliberate niche in the value segment, delivering handcrafted therapeutic products at accessible price points to first-time buyers and cost-conscious consumers. As the market navigates energy regulation changes, tariff pressures, and growing demand for smart-connected products, each company's strategic choices in R&D investment, supply chain configuration, and channel development will determine whether they gain or concede ground through the remainder of the decade.
By Type (Portable Hot Tubs, Fixed Hot Tubs), By End-User (Residential, Commercial), By Distribution Channel (Offline, Online)
Research Methodology
Primary Research- 100 Interviews of Stakeholders
Secondary Research
Desk Research
Regional scope
North America (United States, Canada, Mexico)
Latin America (Brazil, Argentina, Columbia)
East Asia And Pacific (China, Japan, South Korea, Australia, Cambodia, Fiji, Indonesia)
Sea And South Asia (India, Singapore, Thailand, Taiwan, Malaysia)
Eastern Europe (Poland, Russia, Czech Republic, Romania)
Western Europe (Germany, U.K., France, Spain, Itlay)
Middle East & Africa (GCC Countries, Egypt, Nigeria, South Africa, Israel)
Competitive Landscape
Jacuzzi Brands, Nordic Hot Tubs, Bullfrog Spas, Coast Hot Tubs, PDC Spas, Blue Falls Manufacturing, Caldera Spas, Artesian Spas, Canadian Spa Company, Cal Spas, Other Key Players
Customization Scope
Customization for segments, region/country-level will be provided. Moreover, additional customization can be done based on the requirements.
Pricing and Purchase Options
Avail customized purchase options to meet your exact research needs. We have three licenses to opt for: Single User License, Multi-User License (Up to 5 Users), Corporate Use License (Unlimited User and Printable PDF).
TABLE OF CONTENTS
1. EXECUTIVE SUMMARY
1.1. MARKET SNAPSHOT
1.2. KEY FINDINGS & INSIGHTS
1.3. ANALYST RECOMMENDATIONS
1.4. FUTURE OUTLOOK
2. RESEARCH METHODOLOGY
2.1. MARKET DEFINITION & SCOPE
2.2. RESEARCH OBJECTIVES: PRIMARY & SECONDARY DATA SOURCES
2.3. DATA COLLECTION SOURCES
2.3.1. COVERAGE OF 100+ PRIMARY RESEARCH/CONSULTATION CALLS WITH INDUSTRY STAKEHOLDERS
FIGURE 17 NORTH AMERICA HOT TUB CURRENT AND FUTURE TYPE ANALYSIS, 2025–2034, (USD MILLION)
FIGURE 18 NORTH AMERICA HOT TUB CURRENT AND FUTURE END USER ANALYSIS, 2025–2034, (USD MILLION)
FIGURE 19 MARKET SHARE BY COUNTRY
FIGURE 20 LATIN AMERICA HOT TUB CURRENT AND FUTURE TYPE ANALYSIS, 2025–2034, (USD MILLION)
FIGURE 21 LATIN AMERICA HOT TUB CURRENT AND FUTURE END USER ANALYSIS, 2025–2034, (USD MILLION)
FIGURE 22 MARKET SHARE BY COUNTRY
FIGURE 23 EASTERN EUROPE HOT TUB CURRENT AND FUTURE TYPE ANALYSIS, 2025–2034, (USD MILLION)
FIGURE 24 EASTERN EUROPE HOT TUB CURRENT AND FUTURE END USER ANALYSIS, 2025–2034, (USD MILLION)
FIGURE 25 MARKET SHARE BY COUNTRY
FIGURE 26 WESTERN EUROPE HOT TUB CURRENT AND FUTURE TYPE ANALYSIS, 2025–2034, (USD MILLION)
FIGURE 27 WESTERN EUROPE HOT TUB CURRENT AND FUTURE END USER ANALYSIS, 2025–2034, (USD MILLION)
FIGURE 28 MARKET SHARE BY COUNTRY
FIGURE 29 EAST ASIA AND PACIFIC HOT TUB CURRENT AND FUTURE TYPE ANALYSIS, 2025–2034, (USD MILLION)
FIGURE 30 EAST ASIA AND PACIFIC HOT TUB CURRENT AND FUTURE END USER ANALYSIS, 2025–2034, (USD MILLION)
FIGURE 31 MARKET SHARE BY COUNTRY
FIGURE 32 SEA AND SOUTH ASIA HOT TUB CURRENT AND FUTURE TYPE ANALYSIS, 2025–2034, (USD MILLION)
FIGURE 33 SEA AND SOUTH ASIA HOT TUB CURRENT AND FUTURE END USER ANALYSIS, 2025–2034, (USD MILLION)
FIGURE 34 MARKET SHARE BY COUNTRY
FIGURE 35 MIDDLE EAST AND AFRICA HOT TUB CURRENT AND FUTURE TYPE ANALYSIS, 2025–2034, (USD MILLION)
FIGURE 36 MIDDLE EAST AND AFRICA HOT TUB CURRENT AND FUTURE END USER ANALYSIS, 2025–2034, (USD MILLION)
FIGURE 37 NORTH AMERICA HOT TUB CURRENT AND FUTURE MARKET VOLUME SHARE REGIONAL ANALYSIS, 2025–2034, (USD MILLION)
FIGURE 38 U.S. HOT TUB CURRENT AND FUTURE TYPE ANALYSIS, 2025–2034, (USD MILLION)
FIGURE 39 U.S. HOT TUB CURRENT AND FUTURE END USER ANALYSIS, 2025–2034, (USD MILLION)
FIGURE 40 CANADA HOT TUB CURRENT AND FUTURE TYPE ANALYSIS, 2025–2034, (USD MILLION)
FIGURE 41 CANADA HOT TUB CURRENT AND FUTURE END USER ANALYSIS, 2025–2034, (USD MILLION)
FIGURE 42 LATIN AMERICA HOT TUB CURRENT AND FUTURE MARKET VOLUME SHARE REGIONAL ANALYSIS, 2025–2034, (USD MILLION)
FIGURE 43 MEXICO HOT TUB CURRENT AND FUTURE TYPE ANALYSIS, 2025–2034, (USD MILLION)
FIGURE 44 MEXICO HOT TUB CURRENT AND FUTURE END USER ANALYSIS, 2025–2034, (USD MILLION)
FIGURE 45 BRAZIL HOT TUB CURRENT AND FUTURE TYPE ANALYSIS, 2025–2034, (USD MILLION)
FIGURE 46 BRAZIL HOT TUB CURRENT AND FUTURE END USER ANALYSIS, 2025–2034, (USD MILLION)
FIGURE 47 ARGENTINA HOT TUB CURRENT AND FUTURE TYPE ANALYSIS, 2025–2034, (USD MILLION)
FIGURE 48 ARGENTINA HOT TUB CURRENT AND FUTURE END USER ANALYSIS, 2025–2034, (USD MILLION)
FIGURE 49 COLUMBIA HOT TUB CURRENT AND FUTURE TYPE ANALYSIS, 2025–2034, (USD MILLION)
FIGURE 50 COLUMBIA HOT TUB CURRENT AND FUTURE END USER ANALYSIS, 2025–2034, (USD MILLION)
FIGURE 51 REST OF LATIN AMERICA HOT TUB CURRENT AND FUTURE TYPE ANALYSIS, 2025–2034, (USD MILLION)
FIGURE 52 REST OF LATIN AMERICA HOT TUB CURRENT AND FUTURE END USER ANALYSIS, 2025–2034, (USD MILLION)
FIGURE 53 EASTERN EUROPE HOT TUB CURRENT AND FUTURE MARKET VOLUME SHARE REGIONAL ANALYSIS, 2025–2034, (USD MILLION)
FIGURE 54 POLAND HOT TUB CURRENT AND FUTURE TYPE ANALYSIS, 2025–2034, (USD MILLION)
FIGURE 55 POLAND HOT TUB CURRENT AND FUTURE END USER ANALYSIS, 2025–2034, (USD MILLION)
FIGURE 56 RUSSIA HOT TUB CURRENT AND FUTURE TYPE ANALYSIS, 2025–2034, (USD MILLION)
FIGURE 57 RUSSIA HOT TUB CURRENT AND FUTURE END USER ANALYSIS, 2025–2034, (USD MILLION)
FIGURE 58 CZECH REPUBLIC HOT TUB CURRENT AND FUTURE TYPE ANALYSIS, 2025–2034, (USD MILLION)
FIGURE 59 CZECH REPUBLIC HOT TUB CURRENT AND FUTURE END USER ANALYSIS, 2025–2034, (USD MILLION)
FIGURE 60 ROMANIA HOT TUB CURRENT AND FUTURE TYPE ANALYSIS, 2025–2034, (USD MILLION)
FIGURE 61 ROMANIA HOT TUB CURRENT AND FUTURE END USER ANALYSIS, 2025–2034, (USD MILLION)
FIGURE 62 REST OF EASTERN EUROPE HOT TUB CURRENT AND FUTURE TYPE ANALYSIS, 2025–2034, (USD MILLION)
FIGURE 63 REST OF EASTERN EUROPE HOT TUB CURRENT AND FUTURE END USER ANALYSIS, 2025–2034, (USD MILLION)
FIGURE 64 WESTERN EUROPE HOT TUB CURRENT AND FUTURE MARKET VOLUME SHARE REGIONAL ANALYSIS, 2025–2034, (USD MILLION)
FIGURE 65 GERMANY HOT TUB CURRENT AND FUTURE TYPE ANALYSIS, 2025–2034, (USD MILLION)
FIGURE 66 GERMANY HOT TUB CURRENT AND FUTURE END USER ANALYSIS, 2025–2034, (USD MILLION)
FIGURE 67 FRANCE HOT TUB CURRENT AND FUTURE TYPE ANALYSIS, 2025–2034, (USD MILLION)
FIGURE 68 FRANCE HOT TUB CURRENT AND FUTURE END USER ANALYSIS, 2025–2034, (USD MILLION)
FIGURE 69 UK HOT TUB CURRENT AND FUTURE TYPE ANALYSIS, 2025–2034, (USD MILLION)
FIGURE 70 UK HOT TUB CURRENT AND FUTURE END USER ANALYSIS, 2025–2034, (USD MILLION)
FIGURE 71 SPAIN HOT TUB CURRENT AND FUTURE TYPE ANALYSIS, 2025–2034, (USD MILLION)
FIGURE 72 SPAIN HOT TUB CURRENT AND FUTURE END USER ANALYSIS, 2025–2034, (USD MILLION)
FIGURE 73 ITALY HOT TUB CURRENT AND FUTURE TYPE ANALYSIS, 2025–2034, (USD MILLION)
FIGURE 74 ITALY HOT TUB CURRENT AND FUTURE END USER ANALYSIS, 2025–2034, (USD MILLION)
FIGURE 75 REST OF WESTERN EUROPE HOT TUB CURRENT AND FUTURE TYPE ANALYSIS, 2025–2034, (USD MILLION)
FIGURE 76 REST OF WESTERN EUROPE HOT TUB CURRENT AND FUTURE END USER ANALYSIS, 2025–2034, (USD MILLION)
FIGURE 77 EAST ASIA AND PACIFIC HOT TUB CURRENT AND FUTURE MARKET VOLUME SHARE REGIONAL ANALYSIS, 2025–2034, (USD MILLION)
FIGURE 78 CHINA HOT TUB CURRENT AND FUTURE TYPE ANALYSIS, 2025–2034, (USD MILLION)
FIGURE 79 CHINA HOT TUB CURRENT AND FUTURE END USER ANALYSIS, 2025–2034, (USD MILLION)
FIGURE 80 JAPAN HOT TUB CURRENT AND FUTURE TYPE ANALYSIS, 2025–2034, (USD MILLION)
FIGURE 81 JAPAN HOT TUB CURRENT AND FUTURE END USER ANALYSIS, 2025–2034, (USD MILLION)
FIGURE 82 AUSTRALIA HOT TUB CURRENT AND FUTURE TYPE ANALYSIS, 2025–2034, (USD MILLION)
FIGURE 83 AUSTRALIA HOT TUB CURRENT AND FUTURE END USER ANALYSIS, 2025–2034, (USD MILLION)
FIGURE 84 CAMBODIA HOT TUB CURRENT AND FUTURE TYPE ANALYSIS, 2025–2034, (USD MILLION)
FIGURE 85 CAMBODIA HOT TUB CURRENT AND FUTURE END USER ANALYSIS, 2025–2034, (USD MILLION)
FIGURE 86 FIJI HOT TUB CURRENT AND FUTURE TYPE ANALYSIS, 2025–2034, (USD MILLION)
FIGURE 87 FIJI HOT TUB CURRENT AND FUTURE END USER ANALYSIS, 2025–2034, (USD MILLION)
FIGURE 88 INDONESIA HOT TUB CURRENT AND FUTURE TYPE ANALYSIS, 2025–2034, (USD MILLION)
FIGURE 89 INDONESIA HOT TUB CURRENT AND FUTURE END USER ANALYSIS, 2025–2034, (USD MILLION)
FIGURE 90 SOUTH KOREA HOT TUB CURRENT AND FUTURE TYPE ANALYSIS, 2025–2034, (USD MILLION)
FIGURE 91 SOUTH KOREA HOT TUB CURRENT AND FUTURE END USER ANALYSIS, 2025–2034, (USD MILLION)
FIGURE 92 REST OF EAST ASIA AND PACIFIC HOT TUB CURRENT AND FUTURE TYPE ANALYSIS, 2025–2034, (USD MILLION)
FIGURE 93 REST OF EAST ASIA AND PACIFIC HOT TUB CURRENT AND FUTURE END USER ANALYSIS, 2025–2034, (USD MILLION)
FIGURE 94 SEA AND SOUTH ASIA HOT TUB CURRENT AND FUTURE MARKET VOLUME SHARE REGIONAL ANALYSIS, 2025–2034, (USD MILLION)
FIGURE 95 BANGLADESH HOT TUB CURRENT AND FUTURE TYPE ANALYSIS, 2025–2034, (USD MILLION)
FIGURE 96 BANGLADESH HOT TUB CURRENT AND FUTURE END USER ANALYSIS, 2025–2034, (USD MILLION)
FIGURE 97 NEW ZEALAND HOT TUB CURRENT AND FUTURE TYPE ANALYSIS, 2025–2034, (USD MILLION)
FIGURE 98 NEW ZEALAND HOT TUB CURRENT AND FUTURE END USER ANALYSIS, 2025–2034, (USD MILLION)
FIGURE 99 INDIA HOT TUB CURRENT AND FUTURE TYPE ANALYSIS, 2025–2034, (USD MILLION)
FIGURE 100 INDIA HOT TUB CURRENT AND FUTURE END USER ANALYSIS, 2025–2034, (USD MILLION)
FIGURE 101 SINGAPORE HOT TUB CURRENT AND FUTURE TYPE ANALYSIS, 2025–2034, (USD MILLION)
FIGURE 102 SINGAPORE HOT TUB CURRENT AND FUTURE END USER ANALYSIS, 2025–2034, (USD MILLION)
FIGURE 103 THAILAND HOT TUB CURRENT AND FUTURE TYPE ANALYSIS, 2025–2034, (USD MILLION)
FIGURE 104 THAILAND HOT TUB CURRENT AND FUTURE END USER ANALYSIS, 2025–2034, (USD MILLION)
FIGURE 105 TAIWAN HOT TUB CURRENT AND FUTURE TYPE ANALYSIS, 2025–2034, (USD MILLION)
FIGURE 106 TAIWAN HOT TUB CURRENT AND FUTURE END USER ANALYSIS, 2025–2034, (USD MILLION)
FIGURE 107 MALAYSIA HOT TUB CURRENT AND FUTURE TYPE ANALYSIS, 2025–2034, (USD MILLION)
FIGURE 108 MALAYSIA HOT TUB CURRENT AND FUTURE END USER ANALYSIS, 2025–2034, (USD MILLION)
FIGURE 109 REST OF SEA AND SOUTH ASIA HOT TUB CURRENT AND FUTURE TYPE ANALYSIS, 2025–2034, (USD MILLION)
FIGURE 110 REST OF SEA AND SOUTH ASIA HOT TUB CURRENT AND FUTURE END USER ANALYSIS, 2025–2034, (USD MILLION)
FIGURE 111 MIDDLE EAST AND AFRICA HOT TUB CURRENT AND FUTURE MARKET VOLUME SHARE REGIONAL ANALYSIS, 2025–2034, (USD MILLION)
FIGURE 112 GCC COUNTRIES HOT TUB CURRENT AND FUTURE TYPE ANALYSIS, 2025–2034, (USD MILLION)
FIGURE 113 GCC COUNTRIES HOT TUB CURRENT AND FUTURE END USER ANALYSIS, 2025–2034, (USD MILLION)
FIGURE 114 SAUDI ARABIA HOT TUB CURRENT AND FUTURE TYPE ANALYSIS, 2025–2034, (USD MILLION)
FIGURE 115 SAUDI ARABIA HOT TUB CURRENT AND FUTURE END USER ANALYSIS, 2025–2034, (USD MILLION)
FIGURE 116 UAE HOT TUB CURRENT AND FUTURE TYPE ANALYSIS, 2025–2034, (USD MILLION)
FIGURE 117 UAE HOT TUB CURRENT AND FUTURE END USER ANALYSIS, 2025–2034, (USD MILLION)
FIGURE 118 BAHRAIN HOT TUB CURRENT AND FUTURE TYPE ANALYSIS, 2025–2034, (USD MILLION)
FIGURE 119 BAHRAIN HOT TUB CURRENT AND FUTURE END USER ANALYSIS, 2025–2034, (USD MILLION)
FIGURE 120 KUWAIT HOT TUB CURRENT AND FUTURE TYPE ANALYSIS, 2025–2034, (USD MILLION)
FIGURE 121 KUWAIT HOT TUB CURRENT AND FUTURE END USER ANALYSIS, 2025–2034, (USD MILLION)
FIGURE 122 OMAN HOT TUB CURRENT AND FUTURE TYPE ANALYSIS, 2025–2034, (USD MILLION)
FIGURE 123 OMAN HOT TUB CURRENT AND FUTURE END USER ANALYSIS, 2025–2034, (USD MILLION)
FIGURE 124 QATAR HOT TUB CURRENT AND FUTURE TYPE ANALYSIS, 2025–2034, (USD MILLION)
FIGURE 125 QATAR HOT TUB CURRENT AND FUTURE END USER ANALYSIS, 2025–2034, (USD MILLION)
FIGURE 126 EGYPT HOT TUB CURRENT AND FUTURE TYPE ANALYSIS, 2025–2034, (USD MILLION)
FIGURE 127 EGYPT HOT TUB CURRENT AND FUTURE END USER ANALYSIS, 2025–2034, (USD MILLION)
FIGURE 128 NIGERIA HOT TUB CURRENT AND FUTURE TYPE ANALYSIS, 2025–2034, (USD MILLION)
FIGURE 129 NIGERIA HOT TUB CURRENT AND FUTURE END USER ANALYSIS, 2025–2034, (USD MILLION)
FIGURE 130 SOUTH AFRICA HOT TUB CURRENT AND FUTURE TYPE ANALYSIS, 2025–2034, (USD MILLION)
FIGURE 131 SOUTH AFRICA HOT TUB CURRENT AND FUTURE END USER ANALYSIS, 2025–2034, (USD MILLION)
FIGURE 132 ISRAEL HOT TUB CURRENT AND FUTURE TYPE ANALYSIS, 2025–2034, (USD MILLION)
FIGURE 133 ISRAEL HOT TUB CURRENT AND FUTURE END USER ANALYSIS, 2025–2034, (USD MILLION)
FIGURE 134 REST OF MEA HOT TUB CURRENT AND FUTURE TYPE ANALYSIS, 2025–2034, (USD MILLION)
FIGURE 135 REST OF MEA HOT TUB CURRENT AND FUTURE END USER ANALYSIS, 2025–2034, (USD MILLION)
FIGURE 136 U. S. MARKET SHARE ANALYSIS BY TYPE (2024)
FIGURE 137 U. S. MARKET SHARE ANALYSIS BY END USER (2024)
FIGURE 138 CANADA MARKET SHARE ANALYSIS BY TYPE (2024)
FIGURE 139 CANADA MARKET SHARE ANALYSIS BY END USER (2024)
FIGURE 140 MEXICO MARKET SHARE ANALYSIS BY TYPE (2024)
FIGURE 141 MEXICO MARKET SHARE ANALYSIS BY END USER (2024)
FIGURE 142 CHINA MARKET SHARE ANALYSIS BY TYPE (2024)
FIGURE 143 CHINA MARKET SHARE ANALYSIS BY END USER (2024)
FIGURE 144 JAPAN MARKET SHARE ANALYSIS BY TYPE (2024)
FIGURE 145 JAPAN MARKET SHARE ANALYSIS BY END USER (2024)
FIGURE 146 INDIA MARKET SHARE ANALYSIS BY TYPE (2024)
FIGURE 147 INDIA MARKET SHARE ANALYSIS BY END USER (2024)
FIGURE 148 SOUTH KOREA MARKET SHARE ANALYSIS BY TYPE (2024)
FIGURE 149 SOUTH KOREA MARKET SHARE ANALYSIS BY END USER (2024)
FIGURE 150 SAUDI ARABIA MARKET SHARE ANALYSIS BY TYPE (2024)
FIGURE 151 SAUDI ARABIA MARKET SHARE ANALYSIS BY END USER (2024)
FIGURE 152 UAE MARKET SHARE ANALYSIS BY TYPE (2024)
FIGURE 153 UAE MARKET SHARE ANALYSIS BY END USER (2024)
FIGURE 154 EGYPT MARKET SHARE ANALYSIS BY TYPE (2024)
FIGURE 155 EGYPT MARKET SHARE ANALYSIS BY END USER (2024)
FIGURE 156 NIGERIA MARKET SHARE ANALYSIS BY TYPE (2024)
FIGURE 157 NIGERIA MARKET SHARE ANALYSIS BY END USER (2024)
FIGURE 158 SOUTH AFRICA MARKET SHARE ANALYSIS BY TYPE (2024)
FIGURE 159 SOUTH AFRICA MARKET SHARE ANALYSIS BY END USER (2024)
FIGURE 160 GERMANY MARKET SHARE ANALYSIS BY TYPE (2024)
FIGURE 161 GERMANY MARKET SHARE ANALYSIS BY END USER (2024)
FIGURE 162 FRANCE MARKET SHARE ANALYSIS BY TYPE (2024)
FIGURE 163 FRANCE MARKET SHARE ANALYSIS BY END USER (2024)
FIGURE 164 UK MARKET SHARE ANALYSIS BY TYPE (2024)
FIGURE 165 UK MARKET SHARE ANALYSIS BY END USER (2024)
FIGURE 166 SPAIN MARKET SHARE ANALYSIS BY TYPE (2024)
FIGURE 167 SPAIN MARKET SHARE ANALYSIS BY END USER (2024)
FIGURE 168 ITALY MARKET SHARE ANALYSIS BY TYPE (2024)
FIGURE 169 ITALY MARKET SHARE ANALYSIS BY END USER (2024)
FIGURE 170 BRAZIL MARKET SHARE ANALYSIS BY TYPE (2024)
FIGURE 171 BRAZIL MARKET SHARE ANALYSIS BY END USER (2024)
FIGURE 172 ARGENTINA MARKET SHARE ANALYSIS BY TYPE (2024)
FIGURE 173 ARGENTINA MARKET SHARE ANALYSIS BY END USER (2024)
FIGURE 174 COLUMBIA MARKET SHARE ANALYSIS BY TYPE (2024)
FIGURE 175 COLUMBIA MARKET SHARE ANALYSIS BY END USER (2024)
FIGURE 176 GLOBAL HOT TUB CURRENT AND FUTURE MARKET KEY COUNTRY LEVEL ANALYSIS, 2024–2034, (USD MILLION)
FIGURE 177 FINANCIAL OVERVIEW:
Key Player Analysis
Jacuzzi Brands LLC: Jacuzzi Brands LLC holds the dominant position in the global hot tub market, commanding an estimated 30% share and annual turnover near USD 500 million. Founded in 1915 in Berkeley, California, the company has become so closely associated with the product category that its brand name is listed in both the Oxford and Webster dictionaries as a synonym for hot tubs. Jacuzzi operates under a multi-brand portfolio that includes Jacuzzi, Sundance Spas, Dimension One Spas, Hydropool, ThermoSpas, and BathWraps. This portfolio structure allows the company to address the full price spectrum, from budget-friendly Dream Maker and Sunrise Spas (acquired in February 2020 through the purchase of LMI FLA Holdings and Leisure Manufacturing) to premium hydrotherapy systems. The company operates eight factories, with its largest production facility located in Italy, making it the largest hot tub manufacturer in Europe. In the U.S. market, Jacuzzi Brands and Masco Corporation jointly capture close to 75% of domestic manufacturing revenue, underscoring the degree of market concentration.
Since Investindustrial completed its acquisition of Jacuzzi Brands in February 2019, the company has operated under a growth mandate focused on product development, brand expansion, and international market penetration. Investindustrial, a European investment group with EUR 6.8 billion in raised fund capital, brought Nottingham Spirk Design Associates on board as a minority shareholder and product design partner, a collaboration that has generated over 250 patent-backed inventions to date. In 2024, Jacuzzi launched a smart tub system with smartphone app control and Alexa voice integration, aligning with the industry trend toward IoT-enabled products. The company has also introduced AI-integrated models with auto-adjusting water temperature and self-cleaning filtration, which reportedly reduce maintenance requirements by up to 50%. On the sanitation front, Jacuzzi deployed UV-C technology capable of eliminating 99% of bacteria without chemical treatment. These moves position the company at the forefront of the technology adoption curve as California's energy mandates take effect in 2025 and 2026. Jacuzzi's core differentiator remains the combination of unmatched global brand recognition, a vertically integrated multi-brand architecture, and the financial backing to invest in R&D and dealer network expansion across North America, Europe, and Asia.
Nordic Hot Tubs: Nordic Hot Tubs operates as a niche player anchored firmly in the value segment of the hot tub market. Founded in 1995 and headquartered in Grand Rapids, Michigan, the company builds all of its products by hand in the United States. Nordic generates estimated annual revenue of approximately USD 4.2 million with a workforce of around 51 employees. The company's strategic identity is captured by its STAR philosophy: Simple, Therapeutic, Affordable, and Reliable. This positioning targets first-time buyers and budget-conscious families who want genuine hydrotherapy without the premium price tag. Nordic's product lineup spans five distinct tiers: Luxury (Rendezvous LS, Encore LS, Jubilee LS), Sport, Modern, Classic, and an All-In 110V Plug-N-Play series. The Plug-N-Play models are particularly significant in the portable segment, which now accounts for roughly 35% of total market sales, as they require no special electrical installation and lower the barrier to entry for residential consumers.
Nordic's core differentiator is its proprietary Dual Therapy System (DTS), which combines high-flow water movement with a circular motion to target muscle and joint areas that competitors' standard jet configurations often miss. The Robb Report, widely regarded as an authority on premium products, has named Nordic one of the top five spas in the world; a notable distinction for a brand competing primarily on affordability. In 2024, Nordic completed a full product redesign featuring updated cabinet aesthetics, new pinpoint lighting, and improved exterior spotlights. The company expanded its international dealer footprint into Europe, with authorized dealers operating in the Netherlands and other markets. Strategically, Nordic has undergone a recent leadership transition following the departure of CEO Rick Gallagher, and Monomoy Capital Partners holds an ownership stake, positioning the company for potential expansion through strategic retail partnerships, particularly with wellness and home improvement channels. Nordic's small scale limits its R&D budget relative to Jacuzzi or Bullfrog, but its lean operations, domestic manufacturing, and focused value proposition give it a defensible position in a market where over 73% of buyers cite health and therapy as a primary purchase motivation.
Bullfrog Spas: Bullfrog Spas holds an estimated 20% share of the global hot tub market and operates as the primary challenger to Jacuzzi's dominance. Headquartered in Herriman, Utah, the company manufactures all of its products domestically from a state-of-the-art facility that opened in 2020. Bullfrog's entire product strategy centers on a single patented technology: the JetPak Therapy System. Invented by founder David Ludlow in the early 1990s, the system eliminates up to 90% of the traditional plumbing found in conventional hot tubs by using modular, interchangeable jetted seats. Each spa offers up to 16 distinct JetPak configurations, giving consumers full control over massage type, intensity, and seat placement. This modular architecture produces three measurable advantages. First, reduced plumbing means fewer potential leak points, making Bullfrog spas nearly leak-proof. Second, less internal friction translates to stronger jet pressure at lower energy consumption. Third, the system is future-proof: owners can swap in new JetPak designs as they are released without replacing the entire unit. The JetPak system has driven a 15% sales increase in Bullfrog's premium segment.
Bullfrog's manufacturing strategy is a deliberate counterpoint to the industry's offshore production trend. CEO Dan Sjoblom has stated that the vast majority of Bullfrog's components are sourced domestically, a ratio well above the industry average. This insulates the company from tariff volatility and global supply chain disruptions while maintaining shorter lead times. The company practices lean, Six Sigma, and just-in-time manufacturing methodologies; each spa is built to order based on JetPak configurations, colors, and designs. Over the past year, Bullfrog has accelerated its retail expansion by opening six new factory-owned stores, including locations in Park City (Utah), Illinois, and North Carolina, bringing its total to 25 factory-direct outlets. The company also supports a dealer network with near coast-to-coast coverage in North America and has begun expanding into Europe and the United Kingdom. Bullfrog's additional structural advantage is the EnduraFrame, a molded ABS plastic base that contains no wood or metal, eliminating rot and corrosion. In 2020, the company introduced an augmented reality feature allowing customers to visualize a 3D spa model in their own backyards before purchase. With its focus on U.S.-based production, proprietary technology, and controlled retail expansion, Bullfrog is well-positioned to capture share as the market shifts toward customization, energy efficiency, and domestic manufacturing resilience. Market Key Players
Jacuzzi Brands
Nordic Hot Tubs
Bullfrog Spas
Coast Hot Tubs
PDC Spas
Blue Falls Manufacturing
Caldera Spas
Artesian Spas
Canadian Spa Company
Cal Spas
Other Key Players
Driver:
Health and Wellness Priorities Driving Strong Hot Tub Market Growth
As of 2025, the global hot tub market is gaining momentum from the accelerated consumer shift toward wellness-driven lifestyles. Rising awareness of hydrotherapy’s therapeutic benefits—ranging from stress relief and muscle recovery to improved circulation and sleep quality—has positioned hot tubs as more than luxury amenities; they are increasingly perceived as integral wellness investments. In markets like North America and Europe, over 70% of buyers now cite “health benefits” as a primary purchasing factor. The industry is capitalizing on this demand with advanced hydrotherapy systems, ergonomic designs, and precision temperature controls, creating strong differentiation and reinforcing long-term adoption. For investors and manufacturers, this driver signals sustained volume growth, particularly in the residential sector, where ownership rates continue to expand in parallel with the wellness economy.
Restraint:
High Costs and Maintenance Barriers Limiting Market Penetration
Despite favorable demand dynamics, affordability remains a structural restraint. Premium hot tubs often require upfront investments exceeding USD 5,000–10,000, while installation costs—especially for fixed or custom units—can add another 10–15% to the purchase price. Beyond acquisition, annual maintenance expenses for chemicals, cleaning, and electricity average USD 500–800 per unit, which poses a barrier in price-sensitive markets. This financial burden is particularly restrictive in emerging economies where discretionary spending is lower, slowing adoption outside high-income geographies. Unless manufacturers expand financing models or introduce cost-optimized, energy-efficient solutions, this restraint could cap penetration rates and hinder market diversification.
Opportunity:
Technological Advancements Creating New Opportunities in Smart Hot Tubs
Technological innovation presents one of the most compelling growth levers for 2025 and beyond. Smart hot tubs equipped with IoT integration, app-based controls, predictive maintenance alerts, and automated water treatment systems are rapidly gaining traction. Energy efficiency is a parallel opportunity, with new insulation materials and heat pump technologies reducing operating costs by up to 30%. By 2030, the smart wellness segment—including hot tubs and connected spa devices—is projected to exceed USD 2.5 billion globally, with a CAGR above 7%. Companies that align with sustainability priorities while delivering convenience and personalization stand to capture premium margins and loyalty from tech-savvy and eco-conscious buyers.
Trend:
Rising Residential Adoption Emerging as the Dominant Market Trend
The most prominent trend shaping the market in 2025 is the surge in residential adoption as households prioritize private wellness infrastructure. With nearly 8% of U.S. adults already owning a hot tub and a rising proportion of middle-income households in APAC entering the market, the residential sector is outpacing commercial growth. Compact portable models are broadening accessibility, while luxury fixed installations are increasingly integrated into high-value renovations and outdoor living projects. This trend aligns with the larger trajectory of home-based leisure spending, signaling that hot tubs are evolving from discretionary indulgences to durable wellness assets. For stakeholders, the trend underscores a pivot toward direct-to-consumer strategies, omnichannel retailing, and value-added aftersales services as core growth drivers.
Recent Developments
Dec 2024 – Arctic Spas (Blue Falls Manufacturing): Expanded the availability and marketing of its Spa Boy® smart water-care platform, adding Wi-Fi app control for remote monitoring of temperature and chemical balance to reduce maintenance touchpoints. Strengthens Arctic Spas’ positioning in connected, low-touch ownership for cold-climate and premium buyers. Mar 2025 –Watkins Wellness (Caldera Spas / Hot Spring): Rolled out app upgrades that deliver full remote control of temperature and jets and integrate FreshWater® IQ for hourly water testing, status notifications, and AI-assisted troubleshooting; dealers report the software refresh paired with FreshWater IQ to cut routine water-care time significantly. Enhances stickiness of the Caldera/Hot Spring ecosystem and supports premium pricing for smart, energy-efficient spas. Apr 2025 – Jacuzzi Spa: Appointed Robert P. Baird Jr. as Chief Executive Officer to accelerate global execution in premium wellness and drive product/brand investments. Leadership transition signals renewed operating focus and potential M&A or channel expansion in the company’s core North American and European markets. Jun 2025 –Platinum Spas (Superior Wellness): Launched a six-model Luxury Collection with intelligent water-care (PlatinumGuru™), next-gen insulation, and award-winning designs, with a global rollout in summer 2025. The line targets mid-to-premium buyers and is expected to lift average selling prices and margins across EMEA and North America. Jul 2025 –Master Spas: Announced the “Summer of St. Jude” campaign (Jul–Sep), a dealer-led fundraising initiative targeting USD 250,000 for pediatric cancer research tied to every product sold. Deepens brand equity and dealer engagement while aligning with wellness-centric consumers. Sep 2025 –Arctic Spas (Blue Falls Manufacturing): Kicked off a fall wellness push highlighting year-round usage of Arctic Spas hot tubs and All-Weather Pools, reinforcing the brand’s cold-climate engineering and seasonal demand capture. Supports Q4 sell-through and positions dealers for pre-winter upgrades.
Frequently Asked Questions
How big is the Hot Tub Market?
The Hot Tub Market will rise from USD 4.36 Bn in 2024 to nearly USD 8.95 Bn by 2034, driven by wellness lifestyles, hydrotherapy demand, and smart energy-efficient designs.
Who are the major players in the Hot Tub Market?
Jacuzzi Brands, Nordic Hot Tubs, Bullfrog Spas, Coast Hot Tubs, PDC Spas, Blue Falls Manufacturing, Caldera Spas, Artesian Spas, Canadian Spa Company, Cal Spas, Other Key Players
Which segments covered the Hot Tub Market?
By Type (Portable Hot Tubs, Fixed Hot Tubs), By End-User (Residential, Commercial), By Distribution Channel (Offline, Online)
How can this market research report help my business make strategic decisions?
Our market research reports provide actionable intelligence, including verified market size data, CAGR projections, competitive benchmarking, and segment-level opportunity analysis. These insights support strategic planning, investment decisions, product development, and market entry strategies for enterprises and startups alike.
How frequently is the data updated?
We continuously monitor industry developments and update our reports to reflect regulatory changes, technological advancements, and macroeconomic shifts. Updated editions ensure you receive the latest market intelligence.