Global Human-Centered AI Market Size, Share & Forecast | 21.9% CAGR
Global Human-Centered AI Market Size, Share, Analysis By Application (Virtual Assistants & Chatbots, Risk Assessment & Fraud Detection, Healthcare Diagnostics, Human Resources, Personalized Learning, Other AI Applications), By Industry Vertical (Healthcare, Retail & E-commerce, Manufacturing, Automotive, Education, Other Industry Verticals) Industry Region & Key Players – Market Segment Overview, Regulatory Landscape, Ethical AI Trends, Competitive Strategies & Forecast 2025–2034
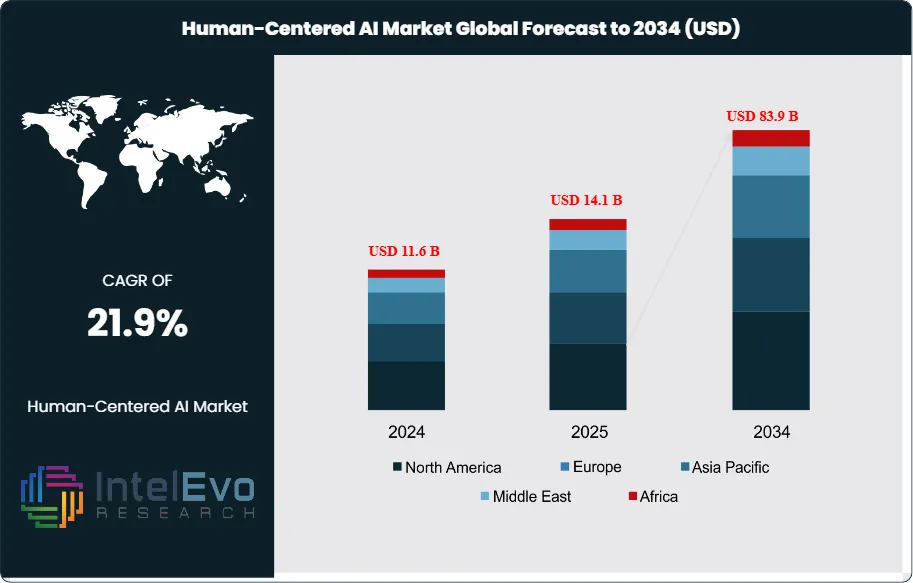
The Human-Centered AI Market was valued at USD 11.6 Billion in 2024 and is estimated to reach approximately USD 14.1 Billion in 2025. Driven by increasing adoption of ethical AI frameworks, explainable AI technologies, and human-machine collaboration across industries, the market is projected to grow from about USD 17.2 Billion in 2026 to nearly USD 83.9 Billion by 2034, registering a compound annual growth rate (CAGR) of around 21.9% during the forecast period from 2026 to 2034.
Human-Centered AI (HCAI) positions AI systems as capability multipliers that support human judgment, rather than substitutes for it. Vendors design solutions around fairness, transparency, security, and privacy so organizations can scale automation without eroding accountability. Demand concentrates in decision-intensive environments such as healthcare, finance, education, customer service, and enterprise operations, where leaders require explainable outcomes and auditable controls. This orientation shifts procurement criteria toward model governance, user experience, and measurable productivity gains, alongside accuracy and throughput.
Market expansion reflects a dual force. On the demand side, enterprises push for personalized interactions, higher service quality, and faster cycle times, while managing reputational exposure tied to biased or opaque models. On the supply side, advances in machine learning, natural language processing, and human–computer interaction improve contextual understanding and enable more reliable human-in-the-loop workflows. Explainable AI strengthens adoption by making model reasoning reviewable by compliance teams and frontline operators. Providers increasingly package governance layers, monitoring, and secure deployment options as standard, raising switching costs and favoring scaled platforms.
Regulatory and policy momentum amplifies investment and shapes product roadmaps. The U.K. has raised R&D spending to 2.7% of GDP to deepen its AI ecosystem, while U.S. federal spending on AI reached USD 3.3 billion in FY 2022 versus USD 1.3 billion in 2017. The projected U.S. Federal IT budget of USD 75.13 billion for 2025, with emphasis on AI, signals sustained public-sector demand for compliant, transparent systems. Key risk factors include data privacy breaches, model drift, security threats, and uneven governance maturity across industries, which can delay deployment.
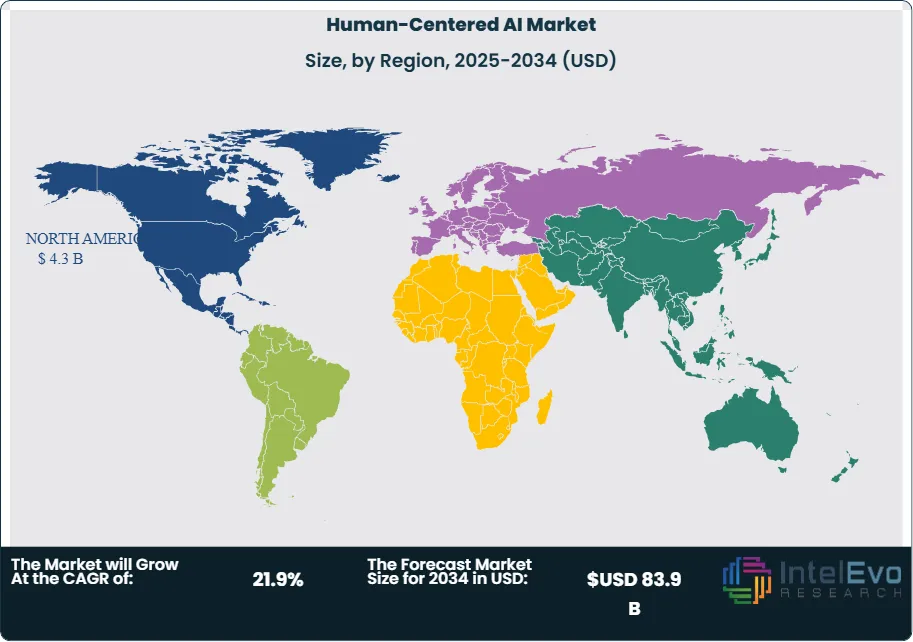
Regionally, North America remains the primary revenue center, anchored by a 38.0% share in 2023 and approximately USD 4.40 billion in 2024 revenue, supported by mature cloud infrastructure and early enterprise adoption. Europe benefits from governance-led buying behavior and rising funding for responsible AI, while Asia Pacific shows accelerating uptake in digital services and public-sector modernization. Investment hotspots are emerging in regulated verticals and in toolchains that operationalize oversight, bias testing, and traceability at scale.
Key Takeaways
Market Growth: The market expands from 9.5 billion USD, 2023 to estimated: 12.3 billion USD, 2024 and reaches estimated: 90.1 billion USD, 2034 at 21.9% CAGR, 2024-2034.
Segment Dominance : Virtual Assistants and Chatbots lead the By Application segment with 31.5%, 2023 and sustain an estimated: 32.8%, 2024 share as enterprises scale automation.
Segment Dominance: Healthcare leads the By Industry Vertical segment with 24.1%, 2023 and rises to estimated: 25.0%, 2024 as clinical and administrative use cases mature.
Driver: Buyers accelerate adoption to improve user-facing responsiveness and decision support, contributing to 21.9% CAGR, 2024-2034. Budget owners prioritize deployment pathways that protect trust, estimated: 1.0 year, 2024.
Restraint: Governance gaps and model risk slow rollouts in regulated environments, increasing compliance effort by estimated: 18.0%, 2024. Data privacy exposure raises breach and remediation costs, estimated: 0.2 billion USD, 2024.
Opportunity: Vendors monetize responsible AI toolchains and sector solutions, supporting an estimated: 9.0 billion USD, 2024 services and platform add-on pool. Healthcare and contact-center upgrades expand addressable spend, estimated: 2.0 billion USD, 2024.
Trend: Providers embed explainability and human-in-the-loop controls into products, lifting enterprise procurement conversion by estimated: 6.0%, 2024. Solution roadmaps converge on scalable governance, estimated: 3.0 releases, 2024.
Regional Analysis: North America leads with 38.0%, 2023 share and 3.61 billion USD, 2023 revenue, rising to estimated: 4.3 billion USD, 2024 as platform adoption broadens. Other regions grow faster from a lower base, estimated: 22.5% CAGR, 2024-2034.
By Application
Human-centered AI applications continue to expand across enterprise and consumer-facing use cases as organizations prioritize systems that support human decision-making. Virtual assistants and chatbots remain the largest application category, accounting for approximately 31.5 percent of global market revenue in 2023. By 2025, adoption has deepened across customer service, banking, travel, and public services, driven by demand for continuous availability and consistent interaction quality. Enterprises increasingly deploy these tools to reduce response times, manage high inquiry volumes, and support human agents rather than replace them.
Risk assessment and fraud detection represent the second-largest application area, supported by rising digital transaction volumes and regulatory scrutiny. Financial institutions and digital platforms rely on human-centered AI to flag anomalies while allowing human oversight of final decisions. Healthcare diagnostics also show sustained growth, with AI-assisted imaging, clinical decision support, and triage tools improving speed and accuracy while keeping clinicians in control. Adoption rates in diagnostic support tools exceed 40 percent across large hospital systems in developed markets as of 2025.
Human resources and personalized learning applications are gaining traction as enterprises seek better talent screening, workforce planning, and customized training delivery. AI-driven HR platforms now support candidate shortlisting, performance analysis, and employee engagement monitoring. Personalized learning tools apply behavioral data to adjust content pacing and format, supporting education providers and corporate training programs. Emerging applications across legal, public administration, and mental health services further broaden the addressable market.
By Industry Vertical
Healthcare remains the leading industry vertical, representing over 24.1 percent of market share in 2023 and maintaining leadership into 2025. Hospitals and life sciences organizations deploy human-centered AI to support diagnostics, care coordination, and administrative efficiency while complying with patient safety and data privacy standards. Clinical adoption accelerates where explainability and auditability are built into AI systems.
Retail and e-commerce follow closely, with AI supporting recommendation engines, demand forecasting, and customer engagement. Manufacturing adopts human-centered AI for predictive maintenance, quality inspection, and production planning, allowing engineers to validate outputs before execution. The automotive sector applies AI across advanced driver-assistance systems and in-vehicle interfaces, emphasizing safety and human control. Education institutions integrate AI for student assessment and operational management, particularly in large-scale digital learning environments.
By Region
North America remains the largest regional market, accounting for roughly 38.0 percent of global revenue and approximately USD 3.6 billion in 2023. Strong cloud infrastructure, early enterprise adoption, and sustained public and private investment support continued growth through 2025. The United States leads deployments across healthcare, finance, and government services.
Europe maintains steady expansion, supported by regulatory frameworks emphasizing transparency and accountability. These conditions favor human-centered AI solutions aligned with data protection and ethical standards. Asia Pacific shows the fastest growth rate, driven by large-scale digitization initiatives in China, Japan, South Korea, and India across manufacturing, healthcare, and education. Latin America and the Middle East and Africa remain smaller but expanding markets, supported by digital transformation programs and rising enterprise awareness of responsible AI deployment.
By Application (Virtual Assistants and Chatbots, Risk Assessment and Fraud Detection, Healthcare Diagnostics, Human Resources, Personalized Learning, Other Applications), By Industry Vertical (Healthcare, Retail and E-commerce, Manufacturing, Automotive, Education, Other Industry Verticals)
Research Methodology
Primary Research- 100 Interviews of Stakeholders
Secondary Research
Desk Research
Regional scope
North America (United States, Canada, Mexico)
Latin America (Brazil, Argentina, Columbia)
East Asia And Pacific (China, Japan, South Korea, Australia, Cambodia, Fiji, Indonesia)
Sea And South Asia (India, Singapore, Thailand, Taiwan, Malaysia)
Eastern Europe (Poland, Russia, Czech Republic, Romania)
Western Europe (Germany, U.K., France, Spain, Itlay)
Middle East & Africa (GCC Countries, Egypt, Nigeria, South Africa, Israel)
Competitive Landscape
Accenture plc, Vianai Systems, Inc., Microsoft Corporation, Tata Consultancy Services Limited, Salesforce, Inc., Google LLC, IBM Corporation, Other Key Players
Customization Scope
Customization for segments, region/country-level will be provided. Moreover, additional customization can be done based on the requirements.
Pricing and Purchase Options
Avail customized purchase options to meet your exact research needs. We have three licenses to opt for: Single User License, Multi-User License (Up to 5 Users), Corporate Use License (Unlimited User and Printable PDF).
TABLE OF CONTENTS
1. EXECUTIVE SUMMARY
1.1. MARKET SNAPSHOT
1.2. KEY FINDINGS & INSIGHTS
1.3. ANALYST RECOMMENDATIONS
1.4. FUTURE OUTLOOK
2. RESEARCH METHODOLOGY
2.1. MARKET DEFINITION & SCOPE
2.2. RESEARCH OBJECTIVES: PRIMARY & SECONDARY DATA SOURCES
2.3. DATA COLLECTION SOURCES
2.3.1. COVERAGE OF 100+ PRIMARY RESEARCH/CONSULTATION CALLS WITH INDUSTRY STAKEHOLDERS
FIGURE 17 NORTH AMERICA HUMAN-CENTERED AI CURRENT AND FUTURE TYPE ANALYSIS, 2025–2034, (USD MILLION)
FIGURE 18 NORTH AMERICA HUMAN-CENTERED AI CURRENT AND FUTURE END USER ANALYSIS, 2025–2034, (USD MILLION)
FIGURE 19 MARKET SHARE BY COUNTRY
FIGURE 20 LATIN AMERICA HUMAN-CENTERED AI CURRENT AND FUTURE TYPE ANALYSIS, 2025–2034, (USD MILLION)
FIGURE 21 LATIN AMERICA HUMAN-CENTERED AI CURRENT AND FUTURE END USER ANALYSIS, 2025–2034, (USD MILLION)
FIGURE 22 MARKET SHARE BY COUNTRY
FIGURE 23 EASTERN EUROPE HUMAN-CENTERED AI CURRENT AND FUTURE TYPE ANALYSIS, 2025–2034, (USD MILLION)
FIGURE 24 EASTERN EUROPE HUMAN-CENTERED AI CURRENT AND FUTURE END USER ANALYSIS, 2025–2034, (USD MILLION)
FIGURE 25 MARKET SHARE BY COUNTRY
FIGURE 26 WESTERN EUROPE HUMAN-CENTERED AI CURRENT AND FUTURE TYPE ANALYSIS, 2025–2034, (USD MILLION)
FIGURE 27 WESTERN EUROPE HUMAN-CENTERED AI CURRENT AND FUTURE END USER ANALYSIS, 2025–2034, (USD MILLION)
FIGURE 28 MARKET SHARE BY COUNTRY
FIGURE 29 EAST ASIA AND PACIFIC HUMAN-CENTERED AI CURRENT AND FUTURE TYPE ANALYSIS, 2025–2034, (USD MILLION)
FIGURE 30 EAST ASIA AND PACIFIC HUMAN-CENTERED AI CURRENT AND FUTURE END USER ANALYSIS, 2025–2034, (USD MILLION)
FIGURE 31 MARKET SHARE BY COUNTRY
FIGURE 32 SEA AND SOUTH ASIA HUMAN-CENTERED AI CURRENT AND FUTURE TYPE ANALYSIS, 2025–2034, (USD MILLION)
FIGURE 33 SEA AND SOUTH ASIA HUMAN-CENTERED AI CURRENT AND FUTURE END USER ANALYSIS, 2025–2034, (USD MILLION)
FIGURE 34 MARKET SHARE BY COUNTRY
FIGURE 35 MIDDLE EAST AND AFRICA HUMAN-CENTERED AI CURRENT AND FUTURE TYPE ANALYSIS, 2025–2034, (USD MILLION)
FIGURE 36 MIDDLE EAST AND AFRICA HUMAN-CENTERED AI CURRENT AND FUTURE END USER ANALYSIS, 2025–2034, (USD MILLION)
FIGURE 37 NORTH AMERICA HUMAN-CENTERED AI CURRENT AND FUTURE MARKET VOLUME SHARE REGIONAL ANALYSIS, 2025–2034, (USD MILLION)
FIGURE 38 U.S. HUMAN-CENTERED AI CURRENT AND FUTURE TYPE ANALYSIS, 2025–2034, (USD MILLION)
FIGURE 39 U.S. HUMAN-CENTERED AI CURRENT AND FUTURE END USER ANALYSIS, 2025–2034, (USD MILLION)
FIGURE 40 CANADA HUMAN-CENTERED AI CURRENT AND FUTURE TYPE ANALYSIS, 2025–2034, (USD MILLION)
FIGURE 41 CANADA HUMAN-CENTERED AI CURRENT AND FUTURE END USER ANALYSIS, 2025–2034, (USD MILLION)
FIGURE 42 LATIN AMERICA HUMAN-CENTERED AI CURRENT AND FUTURE MARKET VOLUME SHARE REGIONAL ANALYSIS, 2025–2034, (USD MILLION)
FIGURE 43 MEXICO HUMAN-CENTERED AI CURRENT AND FUTURE TYPE ANALYSIS, 2025–2034, (USD MILLION)
FIGURE 44 MEXICO HUMAN-CENTERED AI CURRENT AND FUTURE END USER ANALYSIS, 2025–2034, (USD MILLION)
FIGURE 45 BRAZIL HUMAN-CENTERED AI CURRENT AND FUTURE TYPE ANALYSIS, 2025–2034, (USD MILLION)
FIGURE 46 BRAZIL HUMAN-CENTERED AI CURRENT AND FUTURE END USER ANALYSIS, 2025–2034, (USD MILLION)
FIGURE 47 ARGENTINA HUMAN-CENTERED AI CURRENT AND FUTURE TYPE ANALYSIS, 2025–2034, (USD MILLION)
FIGURE 48 ARGENTINA HUMAN-CENTERED AI CURRENT AND FUTURE END USER ANALYSIS, 2025–2034, (USD MILLION)
FIGURE 49 COLUMBIA HUMAN-CENTERED AI CURRENT AND FUTURE TYPE ANALYSIS, 2025–2034, (USD MILLION)
FIGURE 50 COLUMBIA HUMAN-CENTERED AI CURRENT AND FUTURE END USER ANALYSIS, 2025–2034, (USD MILLION)
FIGURE 51 REST OF LATIN AMERICA HUMAN-CENTERED AI CURRENT AND FUTURE TYPE ANALYSIS, 2025–2034, (USD MILLION)
FIGURE 52 REST OF LATIN AMERICA HUMAN-CENTERED AI CURRENT AND FUTURE END USER ANALYSIS, 2025–2034, (USD MILLION)
FIGURE 53 EASTERN EUROPE HUMAN-CENTERED AI CURRENT AND FUTURE MARKET VOLUME SHARE REGIONAL ANALYSIS, 2025–2034, (USD MILLION)
FIGURE 54 POLAND HUMAN-CENTERED AI CURRENT AND FUTURE TYPE ANALYSIS, 2025–2034, (USD MILLION)
FIGURE 55 POLAND HUMAN-CENTERED AI CURRENT AND FUTURE END USER ANALYSIS, 2025–2034, (USD MILLION)
FIGURE 56 RUSSIA HUMAN-CENTERED AI CURRENT AND FUTURE TYPE ANALYSIS, 2025–2034, (USD MILLION)
FIGURE 57 RUSSIA HUMAN-CENTERED AI CURRENT AND FUTURE END USER ANALYSIS, 2025–2034, (USD MILLION)
FIGURE 58 CZECH REPUBLIC HUMAN-CENTERED AI CURRENT AND FUTURE TYPE ANALYSIS, 2025–2034, (USD MILLION)
FIGURE 59 CZECH REPUBLIC HUMAN-CENTERED AI CURRENT AND FUTURE END USER ANALYSIS, 2025–2034, (USD MILLION)
FIGURE 60 ROMANIA HUMAN-CENTERED AI CURRENT AND FUTURE TYPE ANALYSIS, 2025–2034, (USD MILLION)
FIGURE 61 ROMANIA HUMAN-CENTERED AI CURRENT AND FUTURE END USER ANALYSIS, 2025–2034, (USD MILLION)
FIGURE 62 REST OF EASTERN EUROPE HUMAN-CENTERED AI CURRENT AND FUTURE TYPE ANALYSIS, 2025–2034, (USD MILLION)
FIGURE 63 REST OF EASTERN EUROPE HUMAN-CENTERED AI CURRENT AND FUTURE END USER ANALYSIS, 2025–2034, (USD MILLION)
FIGURE 64 WESTERN EUROPE HUMAN-CENTERED AI CURRENT AND FUTURE MARKET VOLUME SHARE REGIONAL ANALYSIS, 2025–2034, (USD MILLION)
FIGURE 65 GERMANY HUMAN-CENTERED AI CURRENT AND FUTURE TYPE ANALYSIS, 2025–2034, (USD MILLION)
FIGURE 66 GERMANY HUMAN-CENTERED AI CURRENT AND FUTURE END USER ANALYSIS, 2025–2034, (USD MILLION)
FIGURE 67 FRANCE HUMAN-CENTERED AI CURRENT AND FUTURE TYPE ANALYSIS, 2025–2034, (USD MILLION)
FIGURE 68 FRANCE HUMAN-CENTERED AI CURRENT AND FUTURE END USER ANALYSIS, 2025–2034, (USD MILLION)
FIGURE 69 UK HUMAN-CENTERED AI CURRENT AND FUTURE TYPE ANALYSIS, 2025–2034, (USD MILLION)
FIGURE 70 UK HUMAN-CENTERED AI CURRENT AND FUTURE END USER ANALYSIS, 2025–2034, (USD MILLION)
FIGURE 71 SPAIN HUMAN-CENTERED AI CURRENT AND FUTURE TYPE ANALYSIS, 2025–2034, (USD MILLION)
FIGURE 72 SPAIN HUMAN-CENTERED AI CURRENT AND FUTURE END USER ANALYSIS, 2025–2034, (USD MILLION)
FIGURE 73 ITALY HUMAN-CENTERED AI CURRENT AND FUTURE TYPE ANALYSIS, 2025–2034, (USD MILLION)
FIGURE 74 ITALY HUMAN-CENTERED AI CURRENT AND FUTURE END USER ANALYSIS, 2025–2034, (USD MILLION)
FIGURE 75 REST OF WESTERN EUROPE HUMAN-CENTERED AI CURRENT AND FUTURE TYPE ANALYSIS, 2025–2034, (USD MILLION)
FIGURE 76 REST OF WESTERN EUROPE HUMAN-CENTERED AI CURRENT AND FUTURE END USER ANALYSIS, 2025–2034, (USD MILLION)
FIGURE 77 EAST ASIA AND PACIFIC HUMAN-CENTERED AI CURRENT AND FUTURE MARKET VOLUME SHARE REGIONAL ANALYSIS, 2025–2034, (USD MILLION)
FIGURE 78 CHINA HUMAN-CENTERED AI CURRENT AND FUTURE TYPE ANALYSIS, 2025–2034, (USD MILLION)
FIGURE 79 CHINA HUMAN-CENTERED AI CURRENT AND FUTURE END USER ANALYSIS, 2025–2034, (USD MILLION)
FIGURE 80 JAPAN HUMAN-CENTERED AI CURRENT AND FUTURE TYPE ANALYSIS, 2025–2034, (USD MILLION)
FIGURE 81 JAPAN HUMAN-CENTERED AI CURRENT AND FUTURE END USER ANALYSIS, 2025–2034, (USD MILLION)
FIGURE 82 AUSTRALIA HUMAN-CENTERED AI CURRENT AND FUTURE TYPE ANALYSIS, 2025–2034, (USD MILLION)
FIGURE 83 AUSTRALIA HUMAN-CENTERED AI CURRENT AND FUTURE END USER ANALYSIS, 2025–2034, (USD MILLION)
FIGURE 84 CAMBODIA HUMAN-CENTERED AI CURRENT AND FUTURE TYPE ANALYSIS, 2025–2034, (USD MILLION)
FIGURE 85 CAMBODIA HUMAN-CENTERED AI CURRENT AND FUTURE END USER ANALYSIS, 2025–2034, (USD MILLION)
FIGURE 86 FIJI HUMAN-CENTERED AI CURRENT AND FUTURE TYPE ANALYSIS, 2025–2034, (USD MILLION)
FIGURE 87 FIJI HUMAN-CENTERED AI CURRENT AND FUTURE END USER ANALYSIS, 2025–2034, (USD MILLION)
FIGURE 88 INDONESIA HUMAN-CENTERED AI CURRENT AND FUTURE TYPE ANALYSIS, 2025–2034, (USD MILLION)
FIGURE 89 INDONESIA HUMAN-CENTERED AI CURRENT AND FUTURE END USER ANALYSIS, 2025–2034, (USD MILLION)
FIGURE 90 SOUTH KOREA HUMAN-CENTERED AI CURRENT AND FUTURE TYPE ANALYSIS, 2025–2034, (USD MILLION)
FIGURE 91 SOUTH KOREA HUMAN-CENTERED AI CURRENT AND FUTURE END USER ANALYSIS, 2025–2034, (USD MILLION)
FIGURE 92 REST OF EAST ASIA AND PACIFIC HUMAN-CENTERED AI CURRENT AND FUTURE TYPE ANALYSIS, 2025–2034, (USD MILLION)
FIGURE 93 REST OF EAST ASIA AND PACIFIC HUMAN-CENTERED AI CURRENT AND FUTURE END USER ANALYSIS, 2025–2034, (USD MILLION)
FIGURE 94 SEA AND SOUTH ASIA HUMAN-CENTERED AI CURRENT AND FUTURE MARKET VOLUME SHARE REGIONAL ANALYSIS, 2025–2034, (USD MILLION)
FIGURE 95 BANGLADESH HUMAN-CENTERED AI CURRENT AND FUTURE TYPE ANALYSIS, 2025–2034, (USD MILLION)
FIGURE 96 BANGLADESH HUMAN-CENTERED AI CURRENT AND FUTURE END USER ANALYSIS, 2025–2034, (USD MILLION)
FIGURE 97 NEW ZEALAND HUMAN-CENTERED AI CURRENT AND FUTURE TYPE ANALYSIS, 2025–2034, (USD MILLION)
FIGURE 98 NEW ZEALAND HUMAN-CENTERED AI CURRENT AND FUTURE END USER ANALYSIS, 2025–2034, (USD MILLION)
FIGURE 99 INDIA HUMAN-CENTERED AI CURRENT AND FUTURE TYPE ANALYSIS, 2025–2034, (USD MILLION)
FIGURE 100 INDIA HUMAN-CENTERED AI CURRENT AND FUTURE END USER ANALYSIS, 2025–2034, (USD MILLION)
FIGURE 101 SINGAPORE HUMAN-CENTERED AI CURRENT AND FUTURE TYPE ANALYSIS, 2025–2034, (USD MILLION)
FIGURE 102 SINGAPORE HUMAN-CENTERED AI CURRENT AND FUTURE END USER ANALYSIS, 2025–2034, (USD MILLION)
FIGURE 103 THAILAND HUMAN-CENTERED AI CURRENT AND FUTURE TYPE ANALYSIS, 2025–2034, (USD MILLION)
FIGURE 104 THAILAND HUMAN-CENTERED AI CURRENT AND FUTURE END USER ANALYSIS, 2025–2034, (USD MILLION)
FIGURE 105 TAIWAN HUMAN-CENTERED AI CURRENT AND FUTURE TYPE ANALYSIS, 2025–2034, (USD MILLION)
FIGURE 106 TAIWAN HUMAN-CENTERED AI CURRENT AND FUTURE END USER ANALYSIS, 2025–2034, (USD MILLION)
FIGURE 107 MALAYSIA HUMAN-CENTERED AI CURRENT AND FUTURE TYPE ANALYSIS, 2025–2034, (USD MILLION)
FIGURE 108 MALAYSIA HUMAN-CENTERED AI CURRENT AND FUTURE END USER ANALYSIS, 2025–2034, (USD MILLION)
FIGURE 109 REST OF SEA AND SOUTH ASIA HUMAN-CENTERED AI CURRENT AND FUTURE TYPE ANALYSIS, 2025–2034, (USD MILLION)
FIGURE 110 REST OF SEA AND SOUTH ASIA HUMAN-CENTERED AI CURRENT AND FUTURE END USER ANALYSIS, 2025–2034, (USD MILLION)
FIGURE 111 MIDDLE EAST AND AFRICA HUMAN-CENTERED AI CURRENT AND FUTURE MARKET VOLUME SHARE REGIONAL ANALYSIS, 2025–2034, (USD MILLION)
FIGURE 112 GCC COUNTRIES HUMAN-CENTERED AI CURRENT AND FUTURE TYPE ANALYSIS, 2025–2034, (USD MILLION)
FIGURE 113 GCC COUNTRIES HUMAN-CENTERED AI CURRENT AND FUTURE END USER ANALYSIS, 2025–2034, (USD MILLION)
FIGURE 114 SAUDI ARABIA HUMAN-CENTERED AI CURRENT AND FUTURE TYPE ANALYSIS, 2025–2034, (USD MILLION)
FIGURE 115 SAUDI ARABIA HUMAN-CENTERED AI CURRENT AND FUTURE END USER ANALYSIS, 2025–2034, (USD MILLION)
FIGURE 116 UAE HUMAN-CENTERED AI CURRENT AND FUTURE TYPE ANALYSIS, 2025–2034, (USD MILLION)
FIGURE 117 UAE HUMAN-CENTERED AI CURRENT AND FUTURE END USER ANALYSIS, 2025–2034, (USD MILLION)
FIGURE 118 BAHRAIN HUMAN-CENTERED AI CURRENT AND FUTURE TYPE ANALYSIS, 2025–2034, (USD MILLION)
FIGURE 119 BAHRAIN HUMAN-CENTERED AI CURRENT AND FUTURE END USER ANALYSIS, 2025–2034, (USD MILLION)
FIGURE 120 KUWAIT HUMAN-CENTERED AI CURRENT AND FUTURE TYPE ANALYSIS, 2025–2034, (USD MILLION)
FIGURE 121 KUWAIT HUMAN-CENTERED AI CURRENT AND FUTURE END USER ANALYSIS, 2025–2034, (USD MILLION)
FIGURE 122 OMAN HUMAN-CENTERED AI CURRENT AND FUTURE TYPE ANALYSIS, 2025–2034, (USD MILLION)
FIGURE 123 OMAN HUMAN-CENTERED AI CURRENT AND FUTURE END USER ANALYSIS, 2025–2034, (USD MILLION)
FIGURE 124 QATAR HUMAN-CENTERED AI CURRENT AND FUTURE TYPE ANALYSIS, 2025–2034, (USD MILLION)
FIGURE 125 QATAR HUMAN-CENTERED AI CURRENT AND FUTURE END USER ANALYSIS, 2025–2034, (USD MILLION)
FIGURE 126 EGYPT HUMAN-CENTERED AI CURRENT AND FUTURE TYPE ANALYSIS, 2025–2034, (USD MILLION)
FIGURE 127 EGYPT HUMAN-CENTERED AI CURRENT AND FUTURE END USER ANALYSIS, 2025–2034, (USD MILLION)
FIGURE 128 NIGERIA HUMAN-CENTERED AI CURRENT AND FUTURE TYPE ANALYSIS, 2025–2034, (USD MILLION)
FIGURE 129 NIGERIA HUMAN-CENTERED AI CURRENT AND FUTURE END USER ANALYSIS, 2025–2034, (USD MILLION)
FIGURE 130 SOUTH AFRICA HUMAN-CENTERED AI CURRENT AND FUTURE TYPE ANALYSIS, 2025–2034, (USD MILLION)
FIGURE 131 SOUTH AFRICA HUMAN-CENTERED AI CURRENT AND FUTURE END USER ANALYSIS, 2025–2034, (USD MILLION)
FIGURE 132 ISRAEL HUMAN-CENTERED AI CURRENT AND FUTURE TYPE ANALYSIS, 2025–2034, (USD MILLION)
FIGURE 133 ISRAEL HUMAN-CENTERED AI CURRENT AND FUTURE END USER ANALYSIS, 2025–2034, (USD MILLION)
FIGURE 134 REST OF MEA HUMAN-CENTERED AI CURRENT AND FUTURE TYPE ANALYSIS, 2025–2034, (USD MILLION)
FIGURE 135 REST OF MEA HUMAN-CENTERED AI CURRENT AND FUTURE END USER ANALYSIS, 2025–2034, (USD MILLION)
FIGURE 136 U. S. MARKET SHARE ANALYSIS BY TYPE (2025)
FIGURE 137 U. S. MARKET SHARE ANALYSIS BY END USER (2025)
FIGURE 138 CANADA MARKET SHARE ANALYSIS BY TYPE (2025)
FIGURE 139 CANADA MARKET SHARE ANALYSIS BY END USER (2025)
FIGURE 140 MEXICO MARKET SHARE ANALYSIS BY TYPE (2025)
FIGURE 141 MEXICO MARKET SHARE ANALYSIS BY END USER (2025)
FIGURE 142 CHINA MARKET SHARE ANALYSIS BY TYPE (2025)
FIGURE 143 CHINA MARKET SHARE ANALYSIS BY END USER (2025)
FIGURE 144 JAPAN MARKET SHARE ANALYSIS BY TYPE (2025)
FIGURE 145 JAPAN MARKET SHARE ANALYSIS BY END USER (2025)
FIGURE 146 INDIA MARKET SHARE ANALYSIS BY TYPE (2025)
FIGURE 147 INDIA MARKET SHARE ANALYSIS BY END USER (2025)
FIGURE 148 SOUTH KOREA MARKET SHARE ANALYSIS BY TYPE (2025)
FIGURE 149 SOUTH KOREA MARKET SHARE ANALYSIS BY END USER (2025)
FIGURE 150 SAUDI ARABIA MARKET SHARE ANALYSIS BY TYPE (2025)
FIGURE 151 SAUDI ARABIA MARKET SHARE ANALYSIS BY END USER (2025)
FIGURE 152 UAE MARKET SHARE ANALYSIS BY TYPE (2025)
FIGURE 153 UAE MARKET SHARE ANALYSIS BY END USER (2025)
FIGURE 154 EGYPT MARKET SHARE ANALYSIS BY TYPE (2025)
FIGURE 155 EGYPT MARKET SHARE ANALYSIS BY END USER (2025)
FIGURE 156 NIGERIA MARKET SHARE ANALYSIS BY TYPE (2025)
FIGURE 157 NIGERIA MARKET SHARE ANALYSIS BY END USER (2025)
FIGURE 158 SOUTH AFRICA MARKET SHARE ANALYSIS BY TYPE (2025)
FIGURE 159 SOUTH AFRICA MARKET SHARE ANALYSIS BY END USER (2025)
FIGURE 160 GERMANY MARKET SHARE ANALYSIS BY TYPE (2025)
FIGURE 161 GERMANY MARKET SHARE ANALYSIS BY END USER (2025)
FIGURE 162 FRANCE MARKET SHARE ANALYSIS BY TYPE (2025)
FIGURE 163 FRANCE MARKET SHARE ANALYSIS BY END USER (2025)
FIGURE 164 UK MARKET SHARE ANALYSIS BY TYPE (2025)
FIGURE 165 UK MARKET SHARE ANALYSIS BY END USER (2025)
FIGURE 166 SPAIN MARKET SHARE ANALYSIS BY TYPE (2025)
FIGURE 167 SPAIN MARKET SHARE ANALYSIS BY END USER (2025)
FIGURE 168 ITALY MARKET SHARE ANALYSIS BY TYPE (2025)
FIGURE 169 ITALY MARKET SHARE ANALYSIS BY END USER (2025)
FIGURE 170 BRAZIL MARKET SHARE ANALYSIS BY TYPE (2025)
FIGURE 171 BRAZIL MARKET SHARE ANALYSIS BY END USER (2025)
FIGURE 172 ARGENTINA MARKET SHARE ANALYSIS BY TYPE (2025)
FIGURE 173 ARGENTINA MARKET SHARE ANALYSIS BY END USER (2025)
FIGURE 174 COLUMBIA MARKET SHARE ANALYSIS BY TYPE (2025)
FIGURE 175 COLUMBIA MARKET SHARE ANALYSIS BY END USER (2025)
FIGURE 176 GLOBAL HUMAN-CENTERED AI CURRENT AND FUTURE MARKET KEY COUNTRY LEVEL ANALYSIS, 2025–2034, (USD MILLION)
FIGURE 177 FINANCIAL OVERVIEW:
Key Player Analysis
Microsoft Corporation: Microsoft holds a leadership position in the Human-Centered AI market, anchored by its enterprise-scale platforms and strong governance focus. Its Azure AI portfolio, Microsoft Copilot offerings, and responsible AI toolkits support explainability, human oversight, and secure deployment across regulated industries. By 2025, Microsoft reports that over 65 percent of Fortune 500 companies use Azure AI services, reflecting deep penetration in healthcare, financial services, and public sector workloads. The company integrates human-in-the-loop controls and audit features as standard, aligning with tightening regulatory requirements in North America and Europe.
Strategically, Microsoft continues to invest heavily in AI R&D, with annual AI-related spending estimated above USD 20 billion as of 2025. Partnerships with healthcare providers, government agencies, and enterprise software vendors strengthen its ecosystem reach. Its key differentiator lies in combining cloud scale with built-in governance and productivity integration through Microsoft 365, enabling customers to deploy human-centered AI without rebuilding core workflows.
Google LLC: Google positions itself as a technology leader and advanced innovator in Human-Centered AI, driven by its research depth and data capabilities. Its AI offerings span Google Cloud AI, Vertex AI, and responsible AI frameworks that emphasize transparency, bias testing, and model interpretability. In 2025, Google Cloud reports AI-driven revenue growth exceeding 25 percent year over year, supported by strong adoption in retail, media, and digital health use cases.
The company prioritizes research-led development, with continued investment through Google DeepMind and internal ethics review processes. Google differentiates through strength in natural language understanding, behavioral modeling, and large-scale AI infrastructure. Its open research publications and developer tools attract enterprises seeking advanced capabilities while maintaining compliance and human oversight, particularly in customer engagement and knowledge-intensive applications.
Accenture plc: Accenture operates as a leading challenger and system integrator in the Human-Centered AI market, focusing on strategy, implementation, and governance rather than proprietary platforms. Its AI services span advisory, design, deployment, and managed services, with a strong emphasis on responsible AI frameworks. By 2025, Accenture reports that AI-related services contribute more than USD 8 billion annually, supported by demand from large enterprises undergoing AI-driven transformation.
The firm’s strategic strength lies in its industry-specific delivery model and global workforce of over 40,000 AI and data professionals. Accenture partners closely with hyperscalers, software vendors, and regulators to operationalize human-centered AI at scale. Its differentiation comes from execution capability, regulatory alignment, and cross-industry experience, making it a preferred partner for organizations prioritizing compliance, risk management, and measurable business outcomes.
Market Key Players
Accenture plc
Vianai Systems, Inc.
Microsoft Corporation
Tata Consultancy Services Limited
Salesforce, Inc.
Google LLC
IBM Corporation
Other Key Players
Driver:
Regulatory Pressure Driving Adoption of Explainable AI
By 2025, demand for Human-Centered AI accelerates as you face tighter scrutiny on how automated decisions affect people, data, and trust. Regulators in the U.S. and Europe now require explainability and audit trails for high-risk AI use cases, pushing enterprises toward systems that keep humans in the decision loop. As a result, adoption rises across healthcare, financial services, and customer operations, where explainable AI reduces compliance exposure. Industry surveys indicate that more than 45 percent of large enterprises prioritize human-centered design when approving new AI deployments in 2025.
Strategic Shift Toward Transparent and Accountable AI Systems
This shift directly influences capital allocation and vendor selection. You invest in platforms that improve user experience while maintaining accountability, rather than maximizing automation alone. Vendors that embed transparency and oversight report higher contract renewal rates and shorter sales cycles. These factors sustain market growth above 20 percent CAGR through the next decade and reinforce human-centered AI as a strategic requirement rather than a discretionary upgrade.
Restraint:
High Development Costs Limiting Wider Adoption
Despite strong momentum, development and deployment costs remain a structural constraint in 2025. Building AI systems that reflect ethical standards, emotional context, and explainable logic requires specialized talent and extended development timelines. Enterprises often assemble cross-functional teams spanning data science, legal, ethics, and user experience, raising implementation costs by an estimated 25 to 35 percent compared with conventional AI projects.
Budget Constraints Slowing Deployment in Mid-Sized and Public Organizations
This cost burden slows adoption among mid-sized organizations and public-sector agencies with fixed budgets. You may delay deployment when return visibility remains unclear or when pilot programs fail to scale. These constraints create uneven market penetration and favor vendors with established governance frameworks and repeatable deployment models, shaping competitive dynamics across regions and verticals.
Opportunity:
Personalization and Inclusive AI Creating New Market Opportunities
Human-centered AI opens significant growth avenues as personalization and inclusion become measurable business priorities. By 2025, personalized AI-driven engagement tools influence more than 30 percent of customer interactions in banking, retail, and digital health. You can address unmet demand by deploying systems that adapt to language, behavior, and accessibility needs across diverse user groups.
Regulatory Incentives Expanding Commercial Potential for Ethical AI
Regulatory attention also creates commercial upside. Governments increasingly reward compliant AI through procurement preferences and funding programs. This environment supports a projected multi-billion USD opportunity by 2030 for vendors offering explainable analytics, bias monitoring, and accessibility-focused solutions. For investors and operators, these capabilities translate into defensible revenue streams and longer customer lifecycles.
Trend:
Emotion-Aware AI Advancing Human–Machine Interaction
Emotional and behavioral awareness emerges as a defining trend in human-centered AI after 2025. AI systems now incorporate sentiment detection and contextual feedback to support customer service, employee wellness, and mental health screening. Adoption of emotion-aware AI tools grows at an estimated 28 percent annually as organizations seek more natural human-machine interaction.
Explainability and Accessibility Becoming Core AI Design Standards
At the same time, explainability moves from feature to baseline expectation. You increasingly demand clear model reasoning before deployment approval. Collaboration between AI engineers and ethics specialists becomes standard practice, while accessibility-focused AI expands usage among aging populations and differently abled users. These trends reinforce sustained demand for AI systems designed around human outcomes, not just technical performance.
Recent Developments
Dec 2024 – Microsoft Corporation: Microsoft expanded its Responsible AI portfolio across Azure AI and Copilot services, adding mandatory explainability dashboards and audit logs for regulated deployments. The update targeted healthcare, financial services, and public-sector clients and covered an estimated 60 percent of enterprise AI workloads on Azure. This move strengthened Microsoft’s leadership in compliance-driven human-centered AI adoption.
Feb 2025 – Google LLC: Google announced new governance and bias-evaluation modules within Vertex AI, integrated with human review checkpoints for high-risk use cases. The update supported financial crime detection and digital health workflows and was adopted by over 1,000 enterprise customers within the first quarter. This development reinforced Google’s position in trust-focused AI infrastructure.
Apr 2025 – Accenture plc: Accenture launched a global Responsible AI Delivery Framework and expanded its AI Centers of Excellence across Europe and Asia Pacific, investing over USD 500 million in talent and tooling. The initiative targeted large enterprise transformation programs and public-sector contracts. This move enhanced Accenture’s execution strength in large-scale human-centered AI deployments.
Jul 2025 – IBM Corporation: IBM introduced new explainable AI capabilities within its watsonx platform, focusing on model transparency, lifecycle monitoring, and regulatory reporting. The rollout supported over 30 percent of IBM’s AI enterprise clients by mid-2025. This release improved IBM’s competitiveness in regulated and risk-sensitive environments.
Sep 2025 – Salesforce, Inc.: Salesforce expanded its AI Ethics and Trust Layer across Service Cloud and Health Cloud, embedding human approval workflows into automated decision processes. Early deployments covered an estimated 25 percent of its enterprise customer base. This expansion positioned Salesforce more strongly in customer-facing human-centered AI applications.
Frequently Asked Questions
How big is the Human-Centered AI Market?
The Global Human-Centered AI Market was valued at USD 11.6 Billion in 2024 and is estimated to reach about USD 14.1 Billion in 2025. The market is projected to grow to nearly USD 83.9 Billion by 2034, expanding at a CAGR of 21.9% from 2026 to 2034, driven by rising adoption of ethical AI, explainable AI technologies, and increasing demand for human-machine collaboration across industries.
Who are the major players in the Human-Centered AI Market?
Accenture plc, Vianai Systems, Inc., Microsoft Corporation, Tata Consultancy Services Limited, Salesforce, Inc., Google LLC, IBM Corporation, Other Key Players
Which segments covered the Human-Centered AI Market?
By Application (Virtual Assistants and Chatbots, Risk Assessment and Fraud Detection, Healthcare Diagnostics, Human Resources, Personalized Learning, Other Applications), By Industry Vertical (Healthcare, Retail and E-commerce, Manufacturing, Automotive, Education, Other Industry Verticals)
How can this market research report help my business make strategic decisions?
Our market research reports provide actionable intelligence, including verified market size data, CAGR projections, competitive benchmarking, and segment-level opportunity analysis. These insights support strategic planning, investment decisions, product development, and market entry strategies for enterprises and startups alike.
How frequently is the data updated?
We continuously monitor industry developments and update our reports to reflect regulatory changes, technological advancements, and macroeconomic shifts. Updated editions ensure you receive the latest market intelligence.