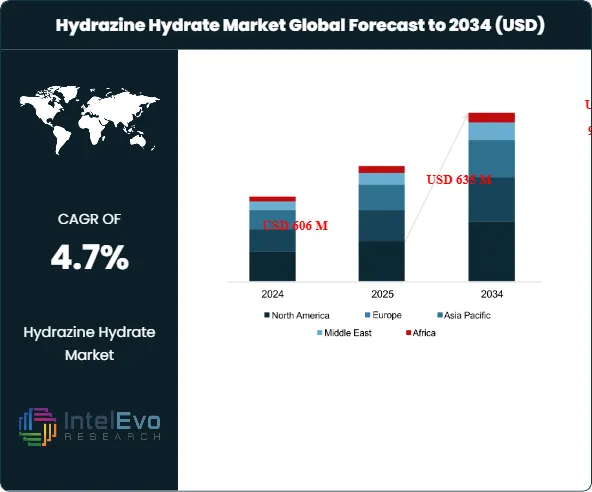
The Hydrazine Hydrate Market was valued at USD 606 Million in 2024 and is projected to reach approximately USD 966 Million by 2034. The market is estimated to grow to around USD 635 Million in 2025. Based on projected expansion from 2026 onward, the industry is expected to register a compound annual growth rate (CAGR) of approximately 4.7% during 2026–2034.
Hydrazine hydrate (N₂H₄·H₂O) remains a core intermediate across water treatment, pharmaceuticals, and agrochemicals due to its high reactivity and reducing behavior. Demand tracks industrial water reuse mandates, tighter boiler-water specifications, and steady growth in drug synthesis routes that require hydrazine derivatives. Water treatment applications account for an estimated 34–38% of global revenue in 2024, supported by rising municipal and industrial purification volumes. Pharmaceuticals contribute roughly 22–26%, while agrochemicals represent about 18–22%, with the balance linked to polymers, blowing agents, and specialty chemicals.
Supply stays concentrated among a limited group of producers with integrated chemical value chains. Asia-Pacific leads capacity and consumption and represents about 44–48% of 2024 revenue, driven by China and India’s expanding manufacturing base and upgrading wastewater infrastructure. North America holds an estimated 23–27% share, supported by refinery, power, and specialty chemical demand, while Europe contributes 18–22% amid tighter compliance requirements and disciplined procurement. Emerging investment hotspots include India’s industrial corridors, Southeast Asia’s electronics and water-reuse buildout, and Middle East desalination-linked chemical demand, where local storage and distribution assets improve service levels and reduce logistics risk.
Regulatory pressure shapes both cost and operating models. Hydrazine hydrate faces stringent handling, exposure, transport, and storage rules across major jurisdictions, which elevates compliance spending and favors suppliers with strong EHS systems. Risk concentrates around hazardous-material incidents, permitting delays, and feedstock and energy volatility that can compress margins during tight supply. Producers increasingly deploy automation, advanced process controls, and digital quality systems to stabilize output and reduce exposure. AI-enabled predictive maintenance and demand sensing improve plant uptime and inventory planning, while digital batch tracking supports audit readiness and lowers recall risk for pharmaceutical-grade material. These dynamics sustain a market that grows steadily, rewards scale and compliance capability, and prioritizes secure, high-purity supply.
Key Takeaways
Market Growth: The market expands at a 4.9% CAGR, 2024-2034. It scales from estimated: 0.6 billion USD, 2024 to estimated: 1.0 billion USD, 2034.
Segment Dominance: The 60-86% concentration band leads revenue with estimated: 45.0% share, 2024. It retains leadership through estimated: 47.0% share, 2034.
Segment Dominance: Polymerization & blowing agents hold the largest application share at estimated: 32.0% share, 2024. Water treatment follows at estimated: 28.0% share, 2024.
Driver: Water treatment upgrades and industrial oxygen-scavenging demand lift consumption with estimated: 5.0% volume growth, 2024. Pharma and agrochemical synthesis sustain demand with estimated: 0.2 billion USD, 2024.
Restraint: Safety-driven regulation and handling controls raise compliance costs by estimated: 8.0% of opex, 2024. Feedstock volatility increases price swings by estimated: 12.0% YoY, 2024.
Opportunity: R&D improves safer formulations and process controls, supporting estimated: 0.1 billion USD, 2034 in incremental value. New end-uses expand addressable demand by estimated: 6.0% CAGR, 2024-2034.
Trend: Producers adopt cleaner synthesis and digital quality systems, driving estimated: 15.0% efficiency gains, 2024. Automation and AI-based monitoring cut downtime by estimated: 10.0% reduction, 2024.
Regional Analysis: Asia Pacific leads with 54.0% revenue share, 2024. Regional revenue reaches estimated: 0.3 billion USD, 2024.
By Type
Hydrazine hydrate demand in 2025 and beyond remains structured around concentration grades, with the 60–85% segment continuing to generate the highest revenue contribution. This grade accounted for an estimated 45–48% of global market value in 2024, supported by its balance between reactivity, handling safety, and cost efficiency. Producers favor this range for large-volume industrial use, which keeps pricing stable and ensures consistent offtake across chemical value chains.
The 60–85% grade is widely applied in polymer processing, veterinary and specialty pharmaceuticals, and intermediate chemical synthesis. Aerospace-related use also remains relevant, particularly for emergency power units in military aircraft fleets, where controlled concentration levels are mandatory. Demand for 100% concentration stays limited to niche propulsion and laboratory applications, while 40–55% and 24–35% grades serve water treatment and corrosion control, where lower concentration reduces handling risk and regulatory exposure.
By Application
Polymerization and blowing agents remain the largest application segment for hydrazine hydrate, representing approximately 30–33% of global demand in 2024. Growth is tied to steady expansion in plastics, elastomers, and insulation materials, where hydrazine-based derivatives act as initiators and low-temperature foaming agents. Compounds such as azodicarbonamide and azobis derivatives continue to support volume growth in Asia-based polymer manufacturing hubs.
Water treatment forms the second-largest application, accounting for nearly 27–29% of consumption. Power generation, refinery operations, and industrial boilers rely on hydrazine hydrate as an oxygen scavenger to limit corrosion. Pharmaceutical and agrochemical uses collectively contribute about 35% of market volume, driven by demand for active intermediates in crop protection chemicals and drug synthesis. These segments show moderate but steady growth, with higher purity requirements supporting margin stability.
By End-Use
Industrial end-use dominates hydrazine hydrate consumption, accounting for more than 55% of global demand in 2024. Polymer producers, chemical processors, power plants, and aerospace maintenance facilities represent the core customer base. Capital investment in industrial manufacturing capacity across Asia Pacific and parts of the Middle East continues to sustain long-term demand.
Commercial and institutional use, primarily linked to water treatment systems and utilities, represents close to 30% of end-use demand. Residential exposure remains limited and indirect, largely tied to municipal water infrastructure rather than direct consumption. Regulatory oversight and safety constraints restrict broader downstream exposure, keeping end-use concentrated among regulated industrial buyers.
By Region
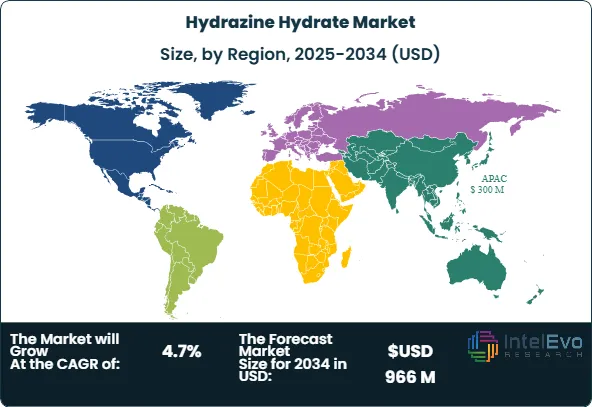
Asia Pacific remains the leading regional market, accounting for approximately 54% of global revenue in 2024, equivalent to over USD 300 million. China and India drive regional demand through expanding polymer production, agrochemical manufacturing, and infrastructure-led water treatment investment. Industrial growth policies and capacity additions continue to support regional dominance through the late 2020s.
North America ranks second with an estimated 23–25% market share. Stable demand from pharmaceuticals, agriculture, and power generation underpins regional growth, supported by established producers and distributors. Europe follows closely, shaped by strict chemical handling regulations and steady industrial demand. Latin America and the Middle East & Africa remain smaller markets but show gradual expansion tied to industrialization and water treatment investment, particularly in Gulf countries and Brazil.
By Concentration Level (100%, 60-85%, 40-55%, 24-35%), By Application (Water Treatment, Polymerization & Blowing Agents, Agrochemicals, Pharmaceuticals, Other Applications)
Research Methodology
Primary Research- 100 Interviews of Stakeholders
Secondary Research
Desk Research
Regional scope
North America (United States, Canada, Mexico)
Latin America (Brazil, Argentina, Columbia)
East Asia And Pacific (China, Japan, South Korea, Australia, Cambodia, Fiji, Indonesia)
Sea And South Asia (India, Singapore, Thailand, Taiwan, Malaysia)
Eastern Europe (Poland, Russia, Czech Republic, Romania)
Western Europe (Germany, U.K., France, Spain, Itlay)
Middle East & Africa (GCC Countries, Egypt, Nigeria, South Africa, Israel)
Competitive Landscape
Arkema Group, Japan Finechem Inc., Lonza Group Ltd, Arrow Fine Chemicals, LANXESS AG, Nippon Carbide Industries Co Inc., Alfa Aesar, Otsuka-MGC Chemical Company, LCG Science Group Holdings Limited, Other Key Players
Customization Scope
Customization for segments, region/country-level will be provided. Moreover, additional customization can be done based on the requirements.
Pricing and Purchase Options
Avail customized purchase options to meet your exact research needs. We have three licenses to opt for: Single User License, Multi-User License (Up to 5 Users), Corporate Use License (Unlimited User and Printable PDF).
TABLE OF CONTENTS
1. EXECUTIVE SUMMARY
1.1. MARKET SNAPSHOT
1.2. KEY FINDINGS & INSIGHTS
1.3. ANALYST RECOMMENDATIONS
1.4. FUTURE OUTLOOK
2. RESEARCH METHODOLOGY
2.1. MARKET DEFINITION & SCOPE
2.2. RESEARCH OBJECTIVES: PRIMARY & SECONDARY DATA SOURCES
2.3. DATA COLLECTION SOURCES
2.3.1. COVERAGE OF 100+ PRIMARY RESEARCH/CONSULTATION CALLS WITH INDUSTRY STAKEHOLDERS
FIGURE 17 NORTH AMERICA HYDRAZINE HYDRATECURRENT AND FUTURE TYPE ANALYSIS, 2025–2034, (USD MILLION)
FIGURE 18 NORTH AMERICA HYDRAZINE HYDRATECURRENT AND FUTURE END USER ANALYSIS, 2025–2034, (USD MILLION)
FIGURE 19 MARKET SHARE BY COUNTRY
FIGURE 20 LATIN AMERICA HYDRAZINE HYDRATECURRENT AND FUTURE TYPE ANALYSIS, 2025–2034, (USD MILLION)
FIGURE 21 LATIN AMERICA HYDRAZINE HYDRATECURRENT AND FUTURE END USER ANALYSIS, 2025–2034, (USD MILLION)
FIGURE 22 MARKET SHARE BY COUNTRY
FIGURE 23 EASTERN EUROPE HYDRAZINE HYDRATECURRENT AND FUTURE TYPE ANALYSIS, 2025–2034, (USD MILLION)
FIGURE 24 EASTERN EUROPE HYDRAZINE HYDRATECURRENT AND FUTURE END USER ANALYSIS, 2025–2034, (USD MILLION)
FIGURE 25 MARKET SHARE BY COUNTRY
FIGURE 26 WESTERN EUROPE HYDRAZINE HYDRATECURRENT AND FUTURE TYPE ANALYSIS, 2025–2034, (USD MILLION)
FIGURE 27 WESTERN EUROPE HYDRAZINE HYDRATECURRENT AND FUTURE END USER ANALYSIS, 2025–2034, (USD MILLION)
FIGURE 28 MARKET SHARE BY COUNTRY
FIGURE 29 EAST ASIA AND PACIFIC HYDRAZINE HYDRATECURRENT AND FUTURE TYPE ANALYSIS, 2025–2034, (USD MILLION)
FIGURE 30 EAST ASIA AND PACIFIC HYDRAZINE HYDRATECURRENT AND FUTURE END USER ANALYSIS, 2025–2034, (USD MILLION)
FIGURE 31 MARKET SHARE BY COUNTRY
FIGURE 32 SEA AND SOUTH ASIA HYDRAZINE HYDRATECURRENT AND FUTURE TYPE ANALYSIS, 2025–2034, (USD MILLION)
FIGURE 33 SEA AND SOUTH ASIA HYDRAZINE HYDRATECURRENT AND FUTURE END USER ANALYSIS, 2025–2034, (USD MILLION)
FIGURE 34 MARKET SHARE BY COUNTRY
FIGURE 35 MIDDLE EAST AND AFRICA HYDRAZINE HYDRATECURRENT AND FUTURE TYPE ANALYSIS, 2025–2034, (USD MILLION)
FIGURE 36 MIDDLE EAST AND AFRICA HYDRAZINE HYDRATECURRENT AND FUTURE END USER ANALYSIS, 2025–2034, (USD MILLION)
FIGURE 37 NORTH AMERICA HYDRAZINE HYDRATECURRENT AND FUTURE MARKET VOLUME SHARE REGIONAL ANALYSIS, 2025–2034, (USD MILLION)
FIGURE 38 U.S. HYDRAZINE HYDRATECURRENT AND FUTURE TYPE ANALYSIS, 2025–2034, (USD MILLION)
FIGURE 39 U.S. HYDRAZINE HYDRATECURRENT AND FUTURE END USER ANALYSIS, 2025–2034, (USD MILLION)
FIGURE 40 CANADA HYDRAZINE HYDRATECURRENT AND FUTURE TYPE ANALYSIS, 2025–2034, (USD MILLION)
FIGURE 41 CANADA HYDRAZINE HYDRATECURRENT AND FUTURE END USER ANALYSIS, 2025–2034, (USD MILLION)
FIGURE 42 LATIN AMERICA HYDRAZINE HYDRATECURRENT AND FUTURE MARKET VOLUME SHARE REGIONAL ANALYSIS, 2025–2034, (USD MILLION)
FIGURE 43 MEXICO HYDRAZINE HYDRATECURRENT AND FUTURE TYPE ANALYSIS, 2025–2034, (USD MILLION)
FIGURE 44 MEXICO HYDRAZINE HYDRATECURRENT AND FUTURE END USER ANALYSIS, 2025–2034, (USD MILLION)
FIGURE 45 BRAZIL HYDRAZINE HYDRATECURRENT AND FUTURE TYPE ANALYSIS, 2025–2034, (USD MILLION)
FIGURE 46 BRAZIL HYDRAZINE HYDRATECURRENT AND FUTURE END USER ANALYSIS, 2025–2034, (USD MILLION)
FIGURE 47 ARGENTINA HYDRAZINE HYDRATECURRENT AND FUTURE TYPE ANALYSIS, 2025–2034, (USD MILLION)
FIGURE 48 ARGENTINA HYDRAZINE HYDRATECURRENT AND FUTURE END USER ANALYSIS, 2025–2034, (USD MILLION)
FIGURE 49 COLUMBIA HYDRAZINE HYDRATECURRENT AND FUTURE TYPE ANALYSIS, 2025–2034, (USD MILLION)
FIGURE 50 COLUMBIA HYDRAZINE HYDRATECURRENT AND FUTURE END USER ANALYSIS, 2025–2034, (USD MILLION)
FIGURE 51 REST OF LATIN AMERICA HYDRAZINE HYDRATECURRENT AND FUTURE TYPE ANALYSIS, 2025–2034, (USD MILLION)
FIGURE 52 REST OF LATIN AMERICA HYDRAZINE HYDRATECURRENT AND FUTURE END USER ANALYSIS, 2025–2034, (USD MILLION)
FIGURE 53 EASTERN EUROPE HYDRAZINE HYDRATECURRENT AND FUTURE MARKET VOLUME SHARE REGIONAL ANALYSIS, 2025–2034, (USD MILLION)
FIGURE 54 POLAND HYDRAZINE HYDRATECURRENT AND FUTURE TYPE ANALYSIS, 2025–2034, (USD MILLION)
FIGURE 55 POLAND HYDRAZINE HYDRATECURRENT AND FUTURE END USER ANALYSIS, 2025–2034, (USD MILLION)
FIGURE 56 RUSSIA HYDRAZINE HYDRATECURRENT AND FUTURE TYPE ANALYSIS, 2025–2034, (USD MILLION)
FIGURE 57 RUSSIA HYDRAZINE HYDRATECURRENT AND FUTURE END USER ANALYSIS, 2025–2034, (USD MILLION)
FIGURE 58 CZECH REPUBLIC HYDRAZINE HYDRATECURRENT AND FUTURE TYPE ANALYSIS, 2025–2034, (USD MILLION)
FIGURE 59 CZECH REPUBLIC HYDRAZINE HYDRATECURRENT AND FUTURE END USER ANALYSIS, 2025–2034, (USD MILLION)
FIGURE 60 ROMANIA HYDRAZINE HYDRATECURRENT AND FUTURE TYPE ANALYSIS, 2025–2034, (USD MILLION)
FIGURE 61 ROMANIA HYDRAZINE HYDRATECURRENT AND FUTURE END USER ANALYSIS, 2025–2034, (USD MILLION)
FIGURE 62 REST OF EASTERN EUROPE HYDRAZINE HYDRATECURRENT AND FUTURE TYPE ANALYSIS, 2025–2034, (USD MILLION)
FIGURE 63 REST OF EASTERN EUROPE HYDRAZINE HYDRATECURRENT AND FUTURE END USER ANALYSIS, 2025–2034, (USD MILLION)
FIGURE 64 WESTERN EUROPE HYDRAZINE HYDRATECURRENT AND FUTURE MARKET VOLUME SHARE REGIONAL ANALYSIS, 2025–2034, (USD MILLION)
FIGURE 65 GERMANY HYDRAZINE HYDRATECURRENT AND FUTURE TYPE ANALYSIS, 2025–2034, (USD MILLION)
FIGURE 66 GERMANY HYDRAZINE HYDRATECURRENT AND FUTURE END USER ANALYSIS, 2025–2034, (USD MILLION)
FIGURE 67 FRANCE HYDRAZINE HYDRATECURRENT AND FUTURE TYPE ANALYSIS, 2025–2034, (USD MILLION)
FIGURE 68 FRANCE HYDRAZINE HYDRATECURRENT AND FUTURE END USER ANALYSIS, 2025–2034, (USD MILLION)
FIGURE 69 UK HYDRAZINE HYDRATECURRENT AND FUTURE TYPE ANALYSIS, 2025–2034, (USD MILLION)
FIGURE 70 UK HYDRAZINE HYDRATECURRENT AND FUTURE END USER ANALYSIS, 2025–2034, (USD MILLION)
FIGURE 71 SPAIN HYDRAZINE HYDRATECURRENT AND FUTURE TYPE ANALYSIS, 2025–2034, (USD MILLION)
FIGURE 72 SPAIN HYDRAZINE HYDRATECURRENT AND FUTURE END USER ANALYSIS, 2025–2034, (USD MILLION)
FIGURE 73 ITALY HYDRAZINE HYDRATECURRENT AND FUTURE TYPE ANALYSIS, 2025–2034, (USD MILLION)
FIGURE 74 ITALY HYDRAZINE HYDRATECURRENT AND FUTURE END USER ANALYSIS, 2025–2034, (USD MILLION)
FIGURE 75 REST OF WESTERN EUROPE HYDRAZINE HYDRATECURRENT AND FUTURE TYPE ANALYSIS, 2025–2034, (USD MILLION)
FIGURE 76 REST OF WESTERN EUROPE HYDRAZINE HYDRATECURRENT AND FUTURE END USER ANALYSIS, 2025–2034, (USD MILLION)
FIGURE 77 EAST ASIA AND PACIFIC HYDRAZINE HYDRATECURRENT AND FUTURE MARKET VOLUME SHARE REGIONAL ANALYSIS, 2025–2034, (USD MILLION)
FIGURE 78 CHINA HYDRAZINE HYDRATECURRENT AND FUTURE TYPE ANALYSIS, 2025–2034, (USD MILLION)
FIGURE 79 CHINA HYDRAZINE HYDRATECURRENT AND FUTURE END USER ANALYSIS, 2025–2034, (USD MILLION)
FIGURE 80 JAPAN HYDRAZINE HYDRATECURRENT AND FUTURE TYPE ANALYSIS, 2025–2034, (USD MILLION)
FIGURE 81 JAPAN HYDRAZINE HYDRATECURRENT AND FUTURE END USER ANALYSIS, 2025–2034, (USD MILLION)
FIGURE 82 AUSTRALIA HYDRAZINE HYDRATECURRENT AND FUTURE TYPE ANALYSIS, 2025–2034, (USD MILLION)
FIGURE 83 AUSTRALIA HYDRAZINE HYDRATECURRENT AND FUTURE END USER ANALYSIS, 2025–2034, (USD MILLION)
FIGURE 84 CAMBODIA HYDRAZINE HYDRATECURRENT AND FUTURE TYPE ANALYSIS, 2025–2034, (USD MILLION)
FIGURE 85 CAMBODIA HYDRAZINE HYDRATECURRENT AND FUTURE END USER ANALYSIS, 2025–2034, (USD MILLION)
FIGURE 86 FIJI HYDRAZINE HYDRATECURRENT AND FUTURE TYPE ANALYSIS, 2025–2034, (USD MILLION)
FIGURE 87 FIJI HYDRAZINE HYDRATECURRENT AND FUTURE END USER ANALYSIS, 2025–2034, (USD MILLION)
FIGURE 88 INDONESIA HYDRAZINE HYDRATECURRENT AND FUTURE TYPE ANALYSIS, 2025–2034, (USD MILLION)
FIGURE 89 INDONESIA HYDRAZINE HYDRATECURRENT AND FUTURE END USER ANALYSIS, 2025–2034, (USD MILLION)
FIGURE 90 SOUTH KOREA HYDRAZINE HYDRATECURRENT AND FUTURE TYPE ANALYSIS, 2025–2034, (USD MILLION)
FIGURE 91 SOUTH KOREA HYDRAZINE HYDRATECURRENT AND FUTURE END USER ANALYSIS, 2025–2034, (USD MILLION)
FIGURE 92 REST OF EAST ASIA AND PACIFIC HYDRAZINE HYDRATECURRENT AND FUTURE TYPE ANALYSIS, 2025–2034, (USD MILLION)
FIGURE 93 REST OF EAST ASIA AND PACIFIC HYDRAZINE HYDRATECURRENT AND FUTURE END USER ANALYSIS, 2025–2034, (USD MILLION)
FIGURE 94 SEA AND SOUTH ASIA HYDRAZINE HYDRATECURRENT AND FUTURE MARKET VOLUME SHARE REGIONAL ANALYSIS, 2025–2034, (USD MILLION)
FIGURE 95 BANGLADESH HYDRAZINE HYDRATECURRENT AND FUTURE TYPE ANALYSIS, 2025–2034, (USD MILLION)
FIGURE 96 BANGLADESH HYDRAZINE HYDRATECURRENT AND FUTURE END USER ANALYSIS, 2025–2034, (USD MILLION)
FIGURE 97 NEW ZEALAND HYDRAZINE HYDRATECURRENT AND FUTURE TYPE ANALYSIS, 2025–2034, (USD MILLION)
FIGURE 98 NEW ZEALAND HYDRAZINE HYDRATECURRENT AND FUTURE END USER ANALYSIS, 2025–2034, (USD MILLION)
FIGURE 99 INDIA HYDRAZINE HYDRATECURRENT AND FUTURE TYPE ANALYSIS, 2025–2034, (USD MILLION)
FIGURE 100 INDIA HYDRAZINE HYDRATECURRENT AND FUTURE END USER ANALYSIS, 2025–2034, (USD MILLION)
FIGURE 101 SINGAPORE HYDRAZINE HYDRATECURRENT AND FUTURE TYPE ANALYSIS, 2025–2034, (USD MILLION)
FIGURE 102 SINGAPORE HYDRAZINE HYDRATECURRENT AND FUTURE END USER ANALYSIS, 2025–2034, (USD MILLION)
FIGURE 103 THAILAND HYDRAZINE HYDRATECURRENT AND FUTURE TYPE ANALYSIS, 2025–2034, (USD MILLION)
FIGURE 104 THAILAND HYDRAZINE HYDRATECURRENT AND FUTURE END USER ANALYSIS, 2025–2034, (USD MILLION)
FIGURE 105 TAIWAN HYDRAZINE HYDRATECURRENT AND FUTURE TYPE ANALYSIS, 2025–2034, (USD MILLION)
FIGURE 106 TAIWAN HYDRAZINE HYDRATECURRENT AND FUTURE END USER ANALYSIS, 2025–2034, (USD MILLION)
FIGURE 107 MALAYSIA HYDRAZINE HYDRATECURRENT AND FUTURE TYPE ANALYSIS, 2025–2034, (USD MILLION)
FIGURE 108 MALAYSIA HYDRAZINE HYDRATECURRENT AND FUTURE END USER ANALYSIS, 2025–2034, (USD MILLION)
FIGURE 109 REST OF SEA AND SOUTH ASIA HYDRAZINE HYDRATECURRENT AND FUTURE TYPE ANALYSIS, 2025–2034, (USD MILLION)
FIGURE 110 REST OF SEA AND SOUTH ASIA HYDRAZINE HYDRATECURRENT AND FUTURE END USER ANALYSIS, 2025–2034, (USD MILLION)
FIGURE 111 MIDDLE EAST AND AFRICA HYDRAZINE HYDRATECURRENT AND FUTURE MARKET VOLUME SHARE REGIONAL ANALYSIS, 2025–2034, (USD MILLION)
FIGURE 112 GCC COUNTRIES HYDRAZINE HYDRATECURRENT AND FUTURE TYPE ANALYSIS, 2025–2034, (USD MILLION)
FIGURE 113 GCC COUNTRIES HYDRAZINE HYDRATECURRENT AND FUTURE END USER ANALYSIS, 2025–2034, (USD MILLION)
FIGURE 114 SAUDI ARABIA HYDRAZINE HYDRATECURRENT AND FUTURE TYPE ANALYSIS, 2025–2034, (USD MILLION)
FIGURE 115 SAUDI ARABIA HYDRAZINE HYDRATECURRENT AND FUTURE END USER ANALYSIS, 2025–2034, (USD MILLION)
FIGURE 116 UAE HYDRAZINE HYDRATECURRENT AND FUTURE TYPE ANALYSIS, 2025–2034, (USD MILLION)
FIGURE 117 UAE HYDRAZINE HYDRATECURRENT AND FUTURE END USER ANALYSIS, 2025–2034, (USD MILLION)
FIGURE 118 BAHRAIN HYDRAZINE HYDRATECURRENT AND FUTURE TYPE ANALYSIS, 2025–2034, (USD MILLION)
FIGURE 119 BAHRAIN HYDRAZINE HYDRATECURRENT AND FUTURE END USER ANALYSIS, 2025–2034, (USD MILLION)
FIGURE 120 KUWAIT HYDRAZINE HYDRATECURRENT AND FUTURE TYPE ANALYSIS, 2025–2034, (USD MILLION)
FIGURE 121 KUWAIT HYDRAZINE HYDRATECURRENT AND FUTURE END USER ANALYSIS, 2025–2034, (USD MILLION)
FIGURE 122 OMAN HYDRAZINE HYDRATECURRENT AND FUTURE TYPE ANALYSIS, 2025–2034, (USD MILLION)
FIGURE 123 OMAN HYDRAZINE HYDRATECURRENT AND FUTURE END USER ANALYSIS, 2025–2034, (USD MILLION)
FIGURE 124 QATAR HYDRAZINE HYDRATECURRENT AND FUTURE TYPE ANALYSIS, 2025–2034, (USD MILLION)
FIGURE 125 QATAR HYDRAZINE HYDRATECURRENT AND FUTURE END USER ANALYSIS, 2025–2034, (USD MILLION)
FIGURE 126 EGYPT HYDRAZINE HYDRATECURRENT AND FUTURE TYPE ANALYSIS, 2025–2034, (USD MILLION)
FIGURE 127 EGYPT HYDRAZINE HYDRATECURRENT AND FUTURE END USER ANALYSIS, 2025–2034, (USD MILLION)
FIGURE 128 NIGERIA HYDRAZINE HYDRATECURRENT AND FUTURE TYPE ANALYSIS, 2025–2034, (USD MILLION)
FIGURE 129 NIGERIA HYDRAZINE HYDRATECURRENT AND FUTURE END USER ANALYSIS, 2025–2034, (USD MILLION)
FIGURE 130 SOUTH AFRICA HYDRAZINE HYDRATECURRENT AND FUTURE TYPE ANALYSIS, 2025–2034, (USD MILLION)
FIGURE 131 SOUTH AFRICA HYDRAZINE HYDRATECURRENT AND FUTURE END USER ANALYSIS, 2025–2034, (USD MILLION)
FIGURE 132 ISRAEL HYDRAZINE HYDRATECURRENT AND FUTURE TYPE ANALYSIS, 2025–2034, (USD MILLION)
FIGURE 133 ISRAEL HYDRAZINE HYDRATECURRENT AND FUTURE END USER ANALYSIS, 2025–2034, (USD MILLION)
FIGURE 134 REST OF MEA HYDRAZINE HYDRATECURRENT AND FUTURE TYPE ANALYSIS, 2025–2034, (USD MILLION)
FIGURE 135 REST OF MEA HYDRAZINE HYDRATECURRENT AND FUTURE END USER ANALYSIS, 2025–2034, (USD MILLION)
FIGURE 136 U. S. MARKET SHARE ANALYSIS BY TYPE (2024)
FIGURE 137 U. S. MARKET SHARE ANALYSIS BY END USER (2024)
FIGURE 138 CANADA MARKET SHARE ANALYSIS BY TYPE (2024)
FIGURE 139 CANADA MARKET SHARE ANALYSIS BY END USER (2024)
FIGURE 140 MEXICO MARKET SHARE ANALYSIS BY TYPE (2024)
FIGURE 141 MEXICO MARKET SHARE ANALYSIS BY END USER (2024)
FIGURE 142 CHINA MARKET SHARE ANALYSIS BY TYPE (2024)
FIGURE 143 CHINA MARKET SHARE ANALYSIS BY END USER (2024)
FIGURE 144 JAPAN MARKET SHARE ANALYSIS BY TYPE (2024)
FIGURE 145 JAPAN MARKET SHARE ANALYSIS BY END USER (2024)
FIGURE 146 INDIA MARKET SHARE ANALYSIS BY TYPE (2024)
FIGURE 147 INDIA MARKET SHARE ANALYSIS BY END USER (2024)
FIGURE 148 SOUTH KOREA MARKET SHARE ANALYSIS BY TYPE (2024)
FIGURE 149 SOUTH KOREA MARKET SHARE ANALYSIS BY END USER (2024)
FIGURE 150 SAUDI ARABIA MARKET SHARE ANALYSIS BY TYPE (2024)
FIGURE 151 SAUDI ARABIA MARKET SHARE ANALYSIS BY END USER (2024)
FIGURE 152 UAE MARKET SHARE ANALYSIS BY TYPE (2024)
FIGURE 153 UAE MARKET SHARE ANALYSIS BY END USER (2024)
FIGURE 154 EGYPT MARKET SHARE ANALYSIS BY TYPE (2024)
FIGURE 155 EGYPT MARKET SHARE ANALYSIS BY END USER (2024)
FIGURE 156 NIGERIA MARKET SHARE ANALYSIS BY TYPE (2024)
FIGURE 157 NIGERIA MARKET SHARE ANALYSIS BY END USER (2024)
FIGURE 158 SOUTH AFRICA MARKET SHARE ANALYSIS BY TYPE (2024)
FIGURE 159 SOUTH AFRICA MARKET SHARE ANALYSIS BY END USER (2024)
FIGURE 160 GERMANY MARKET SHARE ANALYSIS BY TYPE (2024)
FIGURE 161 GERMANY MARKET SHARE ANALYSIS BY END USER (2024)
FIGURE 162 FRANCE MARKET SHARE ANALYSIS BY TYPE (2024)
FIGURE 163 FRANCE MARKET SHARE ANALYSIS BY END USER (2024)
FIGURE 164 UK MARKET SHARE ANALYSIS BY TYPE (2024)
FIGURE 165 UK MARKET SHARE ANALYSIS BY END USER (2024)
FIGURE 166 SPAIN MARKET SHARE ANALYSIS BY TYPE (2024)
FIGURE 167 SPAIN MARKET SHARE ANALYSIS BY END USER (2024)
FIGURE 168 ITALY MARKET SHARE ANALYSIS BY TYPE (2024)
FIGURE 169 ITALY MARKET SHARE ANALYSIS BY END USER (2024)
FIGURE 170 BRAZIL MARKET SHARE ANALYSIS BY TYPE (2024)
FIGURE 171 BRAZIL MARKET SHARE ANALYSIS BY END USER (2024)
FIGURE 172 ARGENTINA MARKET SHARE ANALYSIS BY TYPE (2024)
FIGURE 173 ARGENTINA MARKET SHARE ANALYSIS BY END USER (2024)
FIGURE 174 COLUMBIA MARKET SHARE ANALYSIS BY TYPE (2024)
FIGURE 175 COLUMBIA MARKET SHARE ANALYSIS BY END USER (2024)
FIGURE 176 GLOBAL HYDRAZINE HYDRATECURRENT AND FUTURE MARKET KEY COUNTRY LEVEL ANALYSIS, 2024–2034, (USD MILLION)
FIGURE 177 FINANCIAL OVERVIEW:
Key Player Analysis
LANXESS AG: LANXESS AG operates as a market leader in specialty chemicals with a focused presence in hydrazine hydrate for industrial water treatment, polymer processing, and agrochemical synthesis. As of 2025, the company commands an estimated 12–15% share of the global hydrazine hydrate supply, supported by strong manufacturing assets in Europe and Asia. Its portfolio emphasizes consistent purity grades and compliance with strict environmental and occupational standards, which positions the company well with regulated customers in power generation, refining, and specialty manufacturing.
Strategically, LANXESS continues to invest in process automation, digital plant controls, and emissions reduction across its chemical intermediates business. Capital expenditure over 2023–2025 exceeded an estimated EUR 400 million, with a portion directed toward efficiency upgrades and safety systems. These actions lower unit costs, improve yield stability, and reduce incident risk. Its long-term contracts with utilities and industrial clients provide revenue stability and limit exposure to short-term price volatility.
Arkema Group: Arkema Group positions itself as a strong challenger in the hydrazine hydrate market, with emphasis on downstream integration and specialty applications. The company supplies hydrazine derivatives used in polymerization initiators and blowing agents, serving customers in plastics, insulation, and performance materials. In 2025, Arkema-derived products linked to hydrazine chemistry generate an estimated USD 250–300 million in annual revenue across global markets.
Arkema’s strategy centers on regional expansion in Asia Pacific and targeted partnerships with polymer manufacturers to secure long-term demand. The company continues to increase R&D spending, estimated at 3.0% of annual sales, to improve reaction efficiency and reduce by-product formation. Its strong customer base in construction materials and automotive components provides volume resilience, while its sustainability roadmap supports continued access to regulated European markets.
Otsuka-MGC Chemical Company: Otsuka-MGC Chemical Company operates as a focused niche player with deep expertise in hydrazine hydrate and related fine chemicals. The company benefits from advanced production technology and tight quality control, making it a preferred supplier for pharmaceutical, electronics, and high-spec industrial customers. In 2025, it holds an estimated 8–10% share of global high-purity hydrazine hydrate demand.
Strategic priorities include capacity debottlenecking in Japan and selective exports to North America and Southeast Asia. The company invests steadily in R&D and digital monitoring systems to ensure batch consistency and regulatory compliance. Its differentiation lies in reliability, technical support, and long-standing customer relationships, which allow premium pricing in segments where quality tolerance remains narrow.
Market Key Players
Arkema Group
Japan Finechem Inc.
Lonza Group Ltd
Arrow Fine Chemicals
LANXESS AG
Nippon Carbide Industries Co Inc.
Alfa Aesar
Otsuka-MGC Chemical Company
LCG Science Group Holdings Limited
Other Key Players
Driver:
Rising Polymer Foam Production Boosting Hydrazine Demand
As of 2025, you are seeing sustained demand for hydrazine hydrate driven by expansion in polymer foam applications and energy systems. Polymerization and blowing agents account for roughly 32% of global hydrazine hydrate consumption, supported by steady growth in automotive interiors, furniture, packaging, and building insulation. Global polymer foam output is expanding at an estimated 5.2% CAGR through 2030, which directly increases demand for azodicarbonamide and related hydrazine-based foaming agents. Producers continue to add capacity in Asia Pacific to secure supply for high-volume polymer customers.
Fuel cell development adds a secondary growth vector. Hydrazine hydrate-based fuel cells attract interest due to high energy density and simplified storage compared with hydrogen. Pilot deployments in defense, backup power, and mobility segments are expanding, with niche fuel cell demand growing at an estimated 6.0% CAGR post-2025. For you as an investor or supplier, these applications strengthen long-term demand visibility beyond traditional chemical uses.
Restraint:
Toxicity and Safety Regulations Increasing Compliance Costs
Safety and toxicity constraints remain the most significant limitation on market expansion. Hydrazine hydrate is classified as hazardous, carcinogenic, and highly reactive, which increases regulatory oversight across production, transport, and end use. In 2025, compliance costs account for an estimated 8–10% of operating expenditure for producers in North America and Europe, directly affecting margins.
Stricter occupational exposure limits and environmental regulations also limit downstream adoption. You face higher insurance premiums, specialized storage requirements, and constrained permitting timelines. These factors slow capacity additions in regulated markets and shift incremental investment toward regions with established chemical handling infrastructure.
Opportunity:
Agrochemical Production Driving New Demand
Agricultural chemicals and aerospace propulsion present clear upside potential through the late 2020s. Hydrazine hydrate remains a key intermediate in herbicides and plant growth regulators, supporting rising food demand. Global agrochemical production is growing at approximately 4.5% annually, positioning this segment to add an estimated USD 120–150 million in incremental hydrazine hydrate demand by 2032.
Aerospace and Satellite Propulsion Creating Stable Demand
Aerospace and defense also offer long-cycle demand stability. Hydrazine-based monopropellants and bipropellants remain standard in satellite attitude control and emergency power systems. With annual satellite launches exceeding 2,500 units globally, you gain exposure to a high-barrier segment with predictable procurement cycles.
Trend:
Modernization of Water Treatment Applications
Water treatment modernization shapes current market direction. Industrial boilers, refineries, and power plants continue to rely on hydrazine hydrate for oxygen scavenging, while utilities seek higher efficiency and lower chemical consumption. Advanced dosing systems and process automation are reducing usage intensity by an estimated 10–12% per installation.
Process Efficiency and Digital Supply Chain Optimization
At the same time, manufacturers invest in process efficiency and digital supply chain controls to manage cost pressure. You benefit from improved yield consistency, lower downtime, and tighter inventory planning. These shifts favor established producers with capital resources and regulatory expertise, reinforcing industry concentration beyond 2025.
Recent Developments
Dec 2024 – LANXESS AG: LANXESS announced an expansion of hydrazine hydrate capacity at its European intermediates facility, adding an estimated 15,000 metric tons per year and involving capital expenditure of over USD 60 million. This move strengthens supply reliability for water treatment and polymer customers in Europe and North America while improving compliance with tightening safety standards.
Feb 2025 – Arkema Group: Arkema entered a long-term supply and technology cooperation agreement with a major Asian polymer producer to support hydrazine-based blowing agent demand, covering roughly 20% of the partner’s regional requirements. The agreement secures downstream demand and reinforces Arkema’s position in high-volume polymer applications across Asia Pacific.
Apr 2025 – Otsuka-MGC Chemical Company: Otsuka-MGC commissioned a debottlenecking project at its Japanese hydrazine hydrate unit, raising high-purity output by approximately 10%. The upgrade targets pharmaceutical and electronics customers and supports premium pricing in regulated end markets.
Jul 2025 – Lonza Group: Lonza expanded its fine chemicals portfolio with enhanced hydrazine hydrate derivatives for pharmaceutical synthesis, supported by an estimated USD 25 million investment in process control and quality systems. The initiative increases Lonza’s exposure to high-margin drug intermediates and contract manufacturing demand.
Sep 2025 – Weifang Yaxing Chemical Co., Ltd.: Weifang Yaxing announced a new export-focused production line in China with annual capacity exceeding 20,000 metric tons, aimed at Southeast Asia and the Middle East. This expansion improves cost competitiveness and increases supply availability in fast-growing industrial and agrochemical markets.