Global Hyperloop Market Growth to USD 112.4 Bn by 2034 | CAGR 41.6%
Global Hyperloop Infrastructure and Service Market Size, Share, Analysis Report By Component (Capsule, Tube, Propulsion System), Transportation Type (Passenger, Cargo/Freight), Technology (Magnetic Levitation, Electric Propulsion), Region and Key Players - Industry Segment Overview, Market Dynamics, Competitive Strategies, Trends and Forecast 2025-2034
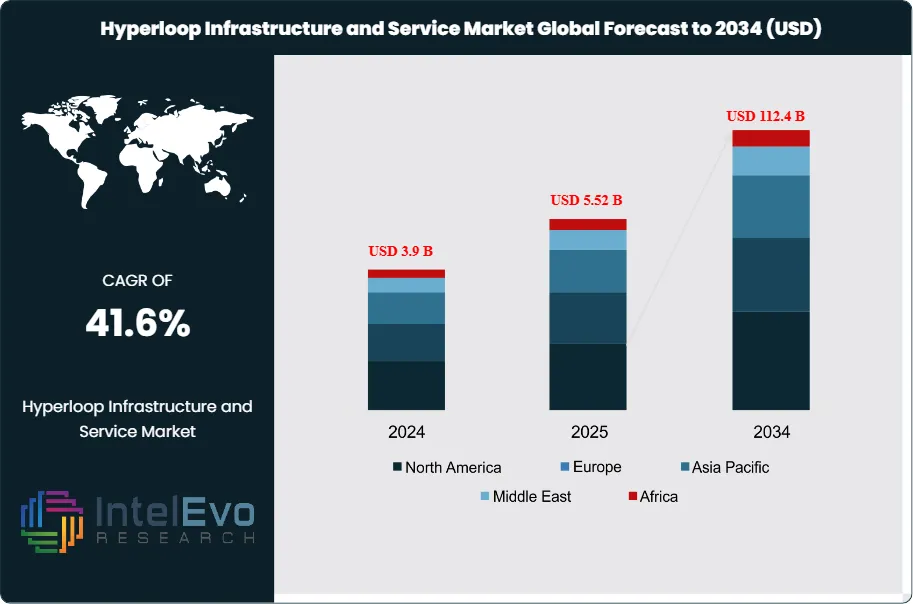
The Global Hyperloop Infrastructure and Service Market size is expected to be worth around USD 112.4 billion by 2034, up from approximately USD 3.9 billion in 2024, growing at a remarkable CAGR of 41.6% during the forecast period from 2025 to 2034. This exponential growth highlights the transformative potential of hyperloop technology in revolutionizing high-speed transportation, reducing travel times, and enabling sustainable mobility solutions across major regions.
The Global Hyperloop Infrastructure and Service Market encompasses an innovative transportation system designed to transport passengers and cargo at high speeds through low-pressure tubes. This technology relies on magnetic levitation and electric propulsion to reduce air resistance and friction, enabling efficient travel. As of 2023, the market was valued at approximately USD 2.65 billion, reflecting a growing interest in sustainable transportation solutions amid rising urbanization and congestion in existing transport systems. Market dynamics are heavily influenced by the need for efficient travel solutions, advancements in propulsion technologies, and increasing investments from both public and private sectors, which aim to commercialize hyperloop technology rapidly.
Several factors drive growth in the hyperloop market. Increasing demand for rapid transit solutions to address urban congestion and improve travel times is a primary motivator. Furthermore, global efforts to reduce carbon emissions and enhance energy efficiency are bolstering interest in hyperloop systems, which promise to provide a sustainable alternative to conventional transport modes. Technological advancements in magnetic levitation and electric propulsion systems are also key growth drivers, enabling the construction of viable hyperloop networks. Additionally, public and private investments, along with collaborations between technology firms and transportation agencies, are accelerating research, development, and the implementation of hyperloop infrastructure.
North America and Europe are expected to be significant markets for hyperloop infrastructure, driven by substantial investment in advanced transportation technologies. The United States has been at the forefront of hyperloop development, with several companies conducting feasibility studies and pilot projects. Meanwhile, countries like the United Kingdom and Germany are exploring hyperloop concepts to enhance their transportation networks. Asia-Pacific is also emerging as a potential market, with increasing interest in high-speed transportation solutions and supportive government policies aimed at modernizing infrastructure.
The COVID-19 pandemic impacted the hyperloop market, causing temporary disruptions in research and development activities due to lockdowns and restrictions. However, it also highlighted the need for safer, faster, and more efficient transportation systems, leading to renewed interest in hyperloop technology post-pandemic. As economies recover, investments are expected to rebound, driving the market forward and potentially accelerating the commercialization of hyperloop services as a sustainable transport alternative.
Key Takeaways:
Market Growth: The global hyperloop infrastructure and service market is expected to reach USD 112.4 billion by 2034, growing at a remarkable CAGR of 41.60%, driven by increasing investments in innovative transportation systems and sustainable mobility solutions.
Component Analysis: The capsule segment is a vital component of hyperloop systems, designed to transport passengers and cargo through vacuum tubes at high speeds. Continuous advancements in materials and aerodynamic designs are enhancing the performance and efficiency of these capsules.
Transportation Type Analysis: Passenger transportation is a key segment, anticipated to dominate the market due to the rising demand for faster, environmentally friendly transit solutions, particularly in urban areas where hyperloop systems offer significant travel-time reductions.
Driver: Growing urbanization, rising traffic congestion, and the need for faster, more efficient transportation solutions are key drivers for hyperloop market growth. Governments and private firms are investing heavily in hyperloop projects to enhance mobility and sustainability.
Restraint: High initial costs associated with building hyperloop infrastructure and regulatory hurdles pose challenges to market expansion. The requirement for large-scale investments in R&D and construction is limiting broader adoption.
Opportunity: Increasing focus on sustainable transportation and technological advancements in propulsion systems offer immense opportunities for market players. Hyperloop systems can significantly reduce travel times and carbon emissions, attracting both public and private investments.
Trend: Electric propulsion and magnetic levitation technologies are leading trends, making hyperloop systems highly efficient and eco-friendly.
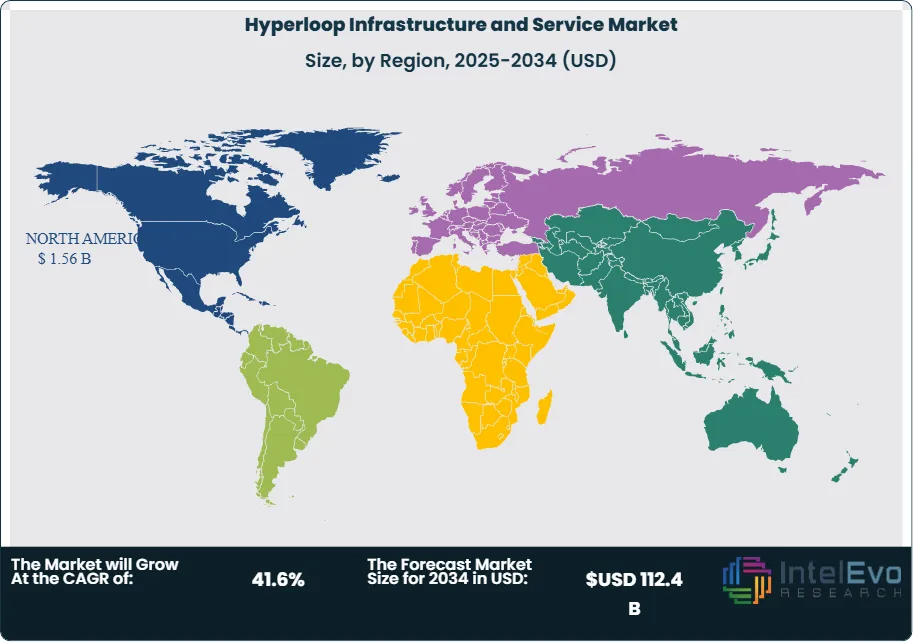
Regional Analysis: North America and Europe are expected to lead the market due to strong investments and infrastructure development, while Asia-Pacific is emerging as a key region with growing interest in advanced transportation solutions.
Infrastructure Type:
The component segment of the hyperloop market includes three primary elements: capsules, tubes, and propulsion systems. Capsules are responsible for transporting passengers or cargo within a low-pressure tube environment at extremely high speeds, reducing air resistance and friction. Tubes, made from advanced materials like reinforced steel or concrete, create the vacuum environment necessary for hyperloop travel. Propulsion systems, powered by electric motors and magnetic levitation, are essential for driving the capsule through the tube efficiently. Each of these components is crucial to the overall performance and safety of the hyperloop system. Continuous advancements in materials, safety protocols, and energy-efficient technologies are improving the reliability and cost-effectiveness of hyperloop infrastructure, making it a more attractive option for future transportation networks.
Service Type:
The hyperloop market is segmented into passenger and cargo/freight transportation types. The passenger segment is expected to dominate, driven by increasing urbanization and the need for faster travel times over long distances. Hyperloop systems offer the promise of drastically reducing travel time between cities, which has garnered interest from government bodies and private firms. On the other hand, the cargo/freight segment holds substantial potential, particularly in logistics and supply chain industries. Hyperloop technology can revolutionize freight transport by reducing delivery times, improving efficiency, and cutting costs. As global trade continues to expand, companies are increasingly exploring hyperloop solutions for high-speed, low-emission freight transport.
Technology:
The technology segment of the hyperloop market is primarily categorized into magnetic levitation and electric propulsion. Magnetic levitation, or maglev, lifts the hyperloop capsule above the tracks, reducing friction and allowing for smoother, faster transit. This technology is already in use in some high-speed trains, making it a natural fit for hyperloop systems. Electric propulsion systems, meanwhile, provide the thrust necessary to propel capsules at extremely high speeds through the vacuum tubes. Innovations in these technologies are making hyperloop systems more energy-efficient and cost-effective. The combination of maglev and electric propulsion ensures a nearly frictionless, low-energy travel experience, making hyperloop one of the most advanced transportation systems under development.
Region Analysis:
North America Dominates with 40% Market Share in Hyperloop Infrastructure and Service Market: North America is currently the leading region in the hyperloop infrastructure and service market, holding approximately 40% of the market share. This dominance is driven by significant investments in hyperloop technology by both private companies and government initiatives, particularly in the United States. Several pilot projects, such as those by Virgin Hyperloop, are under development, focusing on commercializing the technology for both passenger and freight transportation. The region's advanced transportation infrastructure, coupled with a strong emphasis on reducing carbon emissions and improving travel efficiency, makes North America a favorable environment for hyperloop development. Additionally, partnerships between hyperloop companies and transportation agencies are accelerating feasibility studies, further solidifying the region's leadership in the market.
Asia-Pacific is emerging as the fastest-growing region in the hyperloop market, driven by rapid urbanization, increasing population density, and the need for faster, more efficient transportation solutions. Countries like India and China are at the forefront, investing heavily in hyperloop projects to reduce congestion and travel times between major cities. In particular, India has seen growing interest from companies like Hyperloop One, which is working on building hyperloop routes between high-traffic corridors. The region's large, growing economies, coupled with government initiatives aimed at modernizing infrastructure and enhancing sustainability, are creating a fertile ground for hyperloop development. Other regions like Europe and the Middle East are also making progress, but Asia-Pacific's growth potential stands out due to its strategic importance and demand for innovative transport solutions.
By Infrastructure Type (Tube Infrastructure, Propulsion Systems, Capsule/Pods, Control Systems, Other Supporting Infrastructure), By Technology (Magnetic Levitation, Electric Propulsion), By Service Model (Passenger Travel Services, Freight & Logistics Services), By Speed Category (Up to 700 km/h, Above 700 km/h), By End-User (Government & Municipal Bodies, Commercial Enterprises, Logistics & Transportation Companies, Individual Commuters)
Research Methodology
Primary Research- 100 Interviews of Stakeholders
Secondary Research
Desk Research
Regional scope
North America (United States, Canada, Mexico)
Latin America (Brazil, Argentina, Columbia)
East Asia And Pacific (China, Japan, South Korea, Australia, Cambodia, Fiji, Indonesia)
Sea And South Asia (India, Singapore, Thailand, Taiwan, Malaysia)
Eastern Europe (Poland, Russia, Czech Republic, Romania)
Western Europe (Germany, U.K., France, Spain, Itlay)
Middle East & Africa (GCC Countries, Egypt, Nigeria, South Africa, Israel)
Customization for segments, region/country-level will be provided. Moreover, additional customization can be done based on the requirements.
Pricing and Purchase Options
Avail customized purchase options to meet your exact research needs. We have three licenses to opt for: Single User License, Multi-User License (Up to 5 Users), Corporate Use License (Unlimited User and Printable PDF).
TABLE OF CONTENTS
1. EXECUTIVE SUMMARY
1.1. MARKET SNAPSHOT
1.2. KEY FINDINGS & INSIGHTS
1.3. ANALYST RECOMMENDATIONS
1.4. FUTURE OUTLOOK
2. RESEARCH METHODOLOGY
2.1. MARKET DEFINITION & SCOPE
2.2. RESEARCH OBJECTIVES: PRIMARY & SECONDARY DATA SOURCES
2.3. DATA COLLECTION SOURCES
2.3.1. COVERAGE OF 100+ PRIMARY RESEARCH/CONSULTATION CALLS WITH INDUSTRY STAKEHOLDERS
FIGURE 17 NORTH AMERICA HYPERLOOP INFRASTRUCTURE AND SERVICE CURRENT AND FUTURE TYPE ANALYSIS, 2025–2034, (USD MILLION)
FIGURE 18 NORTH AMERICA HYPERLOOP INFRASTRUCTURE AND SERVICE CURRENT AND FUTURE END USER ANALYSIS, 2025–2034, (USD MILLION)
FIGURE 19 MARKET SHARE BY COUNTRY
FIGURE 20 LATIN AMERICA HYPERLOOP INFRASTRUCTURE AND SERVICE CURRENT AND FUTURE TYPE ANALYSIS, 2025–2034, (USD MILLION)
FIGURE 21 LATIN AMERICA HYPERLOOP INFRASTRUCTURE AND SERVICE CURRENT AND FUTURE END USER ANALYSIS, 2025–2034, (USD MILLION)
FIGURE 22 MARKET SHARE BY COUNTRY
FIGURE 23 EASTERN EUROPE HYPERLOOP INFRASTRUCTURE AND SERVICE CURRENT AND FUTURE TYPE ANALYSIS, 2025–2034, (USD MILLION)
FIGURE 24 EASTERN EUROPE HYPERLOOP INFRASTRUCTURE AND SERVICE CURRENT AND FUTURE END USER ANALYSIS, 2025–2034, (USD MILLION)
FIGURE 25 MARKET SHARE BY COUNTRY
FIGURE 26 WESTERN EUROPE HYPERLOOP INFRASTRUCTURE AND SERVICE CURRENT AND FUTURE TYPE ANALYSIS, 2025–2034, (USD MILLION)
FIGURE 27 WESTERN EUROPE HYPERLOOP INFRASTRUCTURE AND SERVICE CURRENT AND FUTURE END USER ANALYSIS, 2025–2034, (USD MILLION)
FIGURE 28 MARKET SHARE BY COUNTRY
FIGURE 29 EAST ASIA AND PACIFIC HYPERLOOP INFRASTRUCTURE AND SERVICE CURRENT AND FUTURE TYPE ANALYSIS, 2025–2034, (USD MILLION)
FIGURE 30 EAST ASIA AND PACIFIC HYPERLOOP INFRASTRUCTURE AND SERVICE CURRENT AND FUTURE END USER ANALYSIS, 2025–2034, (USD MILLION)
FIGURE 31 MARKET SHARE BY COUNTRY
FIGURE 32 SEA AND SOUTH ASIA HYPERLOOP INFRASTRUCTURE AND SERVICE CURRENT AND FUTURE TYPE ANALYSIS, 2025–2034, (USD MILLION)
FIGURE 33 SEA AND SOUTH ASIA HYPERLOOP INFRASTRUCTURE AND SERVICE CURRENT AND FUTURE END USER ANALYSIS, 2025–2034, (USD MILLION)
FIGURE 34 MARKET SHARE BY COUNTRY
FIGURE 35 MIDDLE EAST AND AFRICA HYPERLOOP INFRASTRUCTURE AND SERVICE CURRENT AND FUTURE TYPE ANALYSIS, 2025–2034, (USD MILLION)
FIGURE 36 MIDDLE EAST AND AFRICA HYPERLOOP INFRASTRUCTURE AND SERVICE CURRENT AND FUTURE END USER ANALYSIS, 2025–2034, (USD MILLION)
FIGURE 37 NORTH AMERICA HYPERLOOP INFRASTRUCTURE AND SERVICE CURRENT AND FUTURE MARKET VOLUME SHARE REGIONAL ANALYSIS, 2025–2034, (USD MILLION)
FIGURE 38 U.S. HYPERLOOP INFRASTRUCTURE AND SERVICE CURRENT AND FUTURE TYPE ANALYSIS, 2025–2034, (USD MILLION)
FIGURE 39 U.S. HYPERLOOP INFRASTRUCTURE AND SERVICE CURRENT AND FUTURE END USER ANALYSIS, 2025–2034, (USD MILLION)
FIGURE 40 CANADA HYPERLOOP INFRASTRUCTURE AND SERVICE CURRENT AND FUTURE TYPE ANALYSIS, 2025–2034, (USD MILLION)
FIGURE 41 CANADA HYPERLOOP INFRASTRUCTURE AND SERVICE CURRENT AND FUTURE END USER ANALYSIS, 2025–2034, (USD MILLION)
FIGURE 42 LATIN AMERICA HYPERLOOP INFRASTRUCTURE AND SERVICE CURRENT AND FUTURE MARKET VOLUME SHARE REGIONAL ANALYSIS, 2025–2034, (USD MILLION)
FIGURE 43 MEXICO HYPERLOOP INFRASTRUCTURE AND SERVICE CURRENT AND FUTURE TYPE ANALYSIS, 2025–2034, (USD MILLION)
FIGURE 44 MEXICO HYPERLOOP INFRASTRUCTURE AND SERVICE CURRENT AND FUTURE END USER ANALYSIS, 2025–2034, (USD MILLION)
FIGURE 45 BRAZIL HYPERLOOP INFRASTRUCTURE AND SERVICE CURRENT AND FUTURE TYPE ANALYSIS, 2025–2034, (USD MILLION)
FIGURE 46 BRAZIL HYPERLOOP INFRASTRUCTURE AND SERVICE CURRENT AND FUTURE END USER ANALYSIS, 2025–2034, (USD MILLION)
FIGURE 47 ARGENTINA HYPERLOOP INFRASTRUCTURE AND SERVICE CURRENT AND FUTURE TYPE ANALYSIS, 2025–2034, (USD MILLION)
FIGURE 48 ARGENTINA HYPERLOOP INFRASTRUCTURE AND SERVICE CURRENT AND FUTURE END USER ANALYSIS, 2025–2034, (USD MILLION)
FIGURE 49 COLUMBIA HYPERLOOP INFRASTRUCTURE AND SERVICE CURRENT AND FUTURE TYPE ANALYSIS, 2025–2034, (USD MILLION)
FIGURE 50 COLUMBIA HYPERLOOP INFRASTRUCTURE AND SERVICE CURRENT AND FUTURE END USER ANALYSIS, 2025–2034, (USD MILLION)
FIGURE 51 REST OF LATIN AMERICA HYPERLOOP INFRASTRUCTURE AND SERVICE CURRENT AND FUTURE TYPE ANALYSIS, 2025–2034, (USD MILLION)
FIGURE 52 REST OF LATIN AMERICA HYPERLOOP INFRASTRUCTURE AND SERVICE CURRENT AND FUTURE END USER ANALYSIS, 2025–2034, (USD MILLION)
FIGURE 53 EASTERN EUROPE HYPERLOOP INFRASTRUCTURE AND SERVICE CURRENT AND FUTURE MARKET VOLUME SHARE REGIONAL ANALYSIS, 2025–2034, (USD MILLION)
FIGURE 54 POLAND HYPERLOOP INFRASTRUCTURE AND SERVICE CURRENT AND FUTURE TYPE ANALYSIS, 2025–2034, (USD MILLION)
FIGURE 55 POLAND HYPERLOOP INFRASTRUCTURE AND SERVICE CURRENT AND FUTURE END USER ANALYSIS, 2025–2034, (USD MILLION)
FIGURE 56 RUSSIA HYPERLOOP INFRASTRUCTURE AND SERVICE CURRENT AND FUTURE TYPE ANALYSIS, 2025–2034, (USD MILLION)
FIGURE 57 RUSSIA HYPERLOOP INFRASTRUCTURE AND SERVICE CURRENT AND FUTURE END USER ANALYSIS, 2025–2034, (USD MILLION)
FIGURE 58 CZECH REPUBLIC HYPERLOOP INFRASTRUCTURE AND SERVICE CURRENT AND FUTURE TYPE ANALYSIS, 2025–2034, (USD MILLION)
FIGURE 59 CZECH REPUBLIC HYPERLOOP INFRASTRUCTURE AND SERVICE CURRENT AND FUTURE END USER ANALYSIS, 2025–2034, (USD MILLION)
FIGURE 60 ROMANIA HYPERLOOP INFRASTRUCTURE AND SERVICE CURRENT AND FUTURE TYPE ANALYSIS, 2025–2034, (USD MILLION)
FIGURE 61 ROMANIA HYPERLOOP INFRASTRUCTURE AND SERVICE CURRENT AND FUTURE END USER ANALYSIS, 2025–2034, (USD MILLION)
FIGURE 62 REST OF EASTERN EUROPE HYPERLOOP INFRASTRUCTURE AND SERVICE CURRENT AND FUTURE TYPE ANALYSIS, 2025–2034, (USD MILLION)
FIGURE 63 REST OF EASTERN EUROPE HYPERLOOP INFRASTRUCTURE AND SERVICE CURRENT AND FUTURE END USER ANALYSIS, 2025–2034, (USD MILLION)
FIGURE 64 WESTERN EUROPE HYPERLOOP INFRASTRUCTURE AND SERVICE CURRENT AND FUTURE MARKET VOLUME SHARE REGIONAL ANALYSIS, 2025–2034, (USD MILLION)
FIGURE 65 GERMANY HYPERLOOP INFRASTRUCTURE AND SERVICE CURRENT AND FUTURE TYPE ANALYSIS, 2025–2034, (USD MILLION)
FIGURE 66 GERMANY HYPERLOOP INFRASTRUCTURE AND SERVICE CURRENT AND FUTURE END USER ANALYSIS, 2025–2034, (USD MILLION)
FIGURE 67 FRANCE HYPERLOOP INFRASTRUCTURE AND SERVICE CURRENT AND FUTURE TYPE ANALYSIS, 2025–2034, (USD MILLION)
FIGURE 68 FRANCE HYPERLOOP INFRASTRUCTURE AND SERVICE CURRENT AND FUTURE END USER ANALYSIS, 2025–2034, (USD MILLION)
FIGURE 69 UK HYPERLOOP INFRASTRUCTURE AND SERVICE CURRENT AND FUTURE TYPE ANALYSIS, 2025–2034, (USD MILLION)
FIGURE 70 UK HYPERLOOP INFRASTRUCTURE AND SERVICE CURRENT AND FUTURE END USER ANALYSIS, 2025–2034, (USD MILLION)
FIGURE 71 SPAIN HYPERLOOP INFRASTRUCTURE AND SERVICE CURRENT AND FUTURE TYPE ANALYSIS, 2025–2034, (USD MILLION)
FIGURE 72 SPAIN HYPERLOOP INFRASTRUCTURE AND SERVICE CURRENT AND FUTURE END USER ANALYSIS, 2025–2034, (USD MILLION)
FIGURE 73 ITALY HYPERLOOP INFRASTRUCTURE AND SERVICE CURRENT AND FUTURE TYPE ANALYSIS, 2025–2034, (USD MILLION)
FIGURE 74 ITALY HYPERLOOP INFRASTRUCTURE AND SERVICE CURRENT AND FUTURE END USER ANALYSIS, 2025–2034, (USD MILLION)
FIGURE 75 REST OF WESTERN EUROPE HYPERLOOP INFRASTRUCTURE AND SERVICE CURRENT AND FUTURE TYPE ANALYSIS, 2025–2034, (USD MILLION)
FIGURE 76 REST OF WESTERN EUROPE HYPERLOOP INFRASTRUCTURE AND SERVICE CURRENT AND FUTURE END USER ANALYSIS, 2025–2034, (USD MILLION)
FIGURE 77 EAST ASIA AND PACIFIC HYPERLOOP INFRASTRUCTURE AND SERVICE CURRENT AND FUTURE MARKET VOLUME SHARE REGIONAL ANALYSIS, 2025–2034, (USD MILLION)
FIGURE 78 CHINA HYPERLOOP INFRASTRUCTURE AND SERVICE CURRENT AND FUTURE TYPE ANALYSIS, 2025–2034, (USD MILLION)
FIGURE 79 CHINA HYPERLOOP INFRASTRUCTURE AND SERVICE CURRENT AND FUTURE END USER ANALYSIS, 2025–2034, (USD MILLION)
FIGURE 80 JAPAN HYPERLOOP INFRASTRUCTURE AND SERVICE CURRENT AND FUTURE TYPE ANALYSIS, 2025–2034, (USD MILLION)
FIGURE 81 JAPAN HYPERLOOP INFRASTRUCTURE AND SERVICE CURRENT AND FUTURE END USER ANALYSIS, 2025–2034, (USD MILLION)
FIGURE 82 AUSTRALIA HYPERLOOP INFRASTRUCTURE AND SERVICE CURRENT AND FUTURE TYPE ANALYSIS, 2025–2034, (USD MILLION)
FIGURE 83 AUSTRALIA HYPERLOOP INFRASTRUCTURE AND SERVICE CURRENT AND FUTURE END USER ANALYSIS, 2025–2034, (USD MILLION)
FIGURE 84 CAMBODIA HYPERLOOP INFRASTRUCTURE AND SERVICE CURRENT AND FUTURE TYPE ANALYSIS, 2025–2034, (USD MILLION)
FIGURE 85 CAMBODIA HYPERLOOP INFRASTRUCTURE AND SERVICE CURRENT AND FUTURE END USER ANALYSIS, 2025–2034, (USD MILLION)
FIGURE 86 FIJI HYPERLOOP INFRASTRUCTURE AND SERVICE CURRENT AND FUTURE TYPE ANALYSIS, 2025–2034, (USD MILLION)
FIGURE 87 FIJI HYPERLOOP INFRASTRUCTURE AND SERVICE CURRENT AND FUTURE END USER ANALYSIS, 2025–2034, (USD MILLION)
FIGURE 88 INDONESIA HYPERLOOP INFRASTRUCTURE AND SERVICE CURRENT AND FUTURE TYPE ANALYSIS, 2025–2034, (USD MILLION)
FIGURE 89 INDONESIA HYPERLOOP INFRASTRUCTURE AND SERVICE CURRENT AND FUTURE END USER ANALYSIS, 2025–2034, (USD MILLION)
FIGURE 90 SOUTH KOREA HYPERLOOP INFRASTRUCTURE AND SERVICE CURRENT AND FUTURE TYPE ANALYSIS, 2025–2034, (USD MILLION)
FIGURE 91 SOUTH KOREA HYPERLOOP INFRASTRUCTURE AND SERVICE CURRENT AND FUTURE END USER ANALYSIS, 2025–2034, (USD MILLION)
FIGURE 92 REST OF EAST ASIA AND PACIFIC HYPERLOOP INFRASTRUCTURE AND SERVICE CURRENT AND FUTURE TYPE ANALYSIS, 2025–2034, (USD MILLION)
FIGURE 93 REST OF EAST ASIA AND PACIFIC HYPERLOOP INFRASTRUCTURE AND SERVICE CURRENT AND FUTURE END USER ANALYSIS, 2025–2034, (USD MILLION)
FIGURE 94 SEA AND SOUTH ASIA HYPERLOOP INFRASTRUCTURE AND SERVICE CURRENT AND FUTURE MARKET VOLUME SHARE REGIONAL ANALYSIS, 2025–2034, (USD MILLION)
FIGURE 95 BANGLADESH HYPERLOOP INFRASTRUCTURE AND SERVICE CURRENT AND FUTURE TYPE ANALYSIS, 2025–2034, (USD MILLION)
FIGURE 96 BANGLADESH HYPERLOOP INFRASTRUCTURE AND SERVICE CURRENT AND FUTURE END USER ANALYSIS, 2025–2034, (USD MILLION)
FIGURE 97 NEW ZEALAND HYPERLOOP INFRASTRUCTURE AND SERVICE CURRENT AND FUTURE TYPE ANALYSIS, 2025–2034, (USD MILLION)
FIGURE 98 NEW ZEALAND HYPERLOOP INFRASTRUCTURE AND SERVICE CURRENT AND FUTURE END USER ANALYSIS, 2025–2034, (USD MILLION)
FIGURE 99 INDIA HYPERLOOP INFRASTRUCTURE AND SERVICE CURRENT AND FUTURE TYPE ANALYSIS, 2025–2034, (USD MILLION)
FIGURE 100 INDIA HYPERLOOP INFRASTRUCTURE AND SERVICE CURRENT AND FUTURE END USER ANALYSIS, 2025–2034, (USD MILLION)
FIGURE 101 SINGAPORE HYPERLOOP INFRASTRUCTURE AND SERVICE CURRENT AND FUTURE TYPE ANALYSIS, 2025–2034, (USD MILLION)
FIGURE 102 SINGAPORE HYPERLOOP INFRASTRUCTURE AND SERVICE CURRENT AND FUTURE END USER ANALYSIS, 2025–2034, (USD MILLION)
FIGURE 103 THAILAND HYPERLOOP INFRASTRUCTURE AND SERVICE CURRENT AND FUTURE TYPE ANALYSIS, 2025–2034, (USD MILLION)
FIGURE 104 THAILAND HYPERLOOP INFRASTRUCTURE AND SERVICE CURRENT AND FUTURE END USER ANALYSIS, 2025–2034, (USD MILLION)
FIGURE 105 TAIWAN HYPERLOOP INFRASTRUCTURE AND SERVICE CURRENT AND FUTURE TYPE ANALYSIS, 2025–2034, (USD MILLION)
FIGURE 106 TAIWAN HYPERLOOP INFRASTRUCTURE AND SERVICE CURRENT AND FUTURE END USER ANALYSIS, 2025–2034, (USD MILLION)
FIGURE 107 MALAYSIA HYPERLOOP INFRASTRUCTURE AND SERVICE CURRENT AND FUTURE TYPE ANALYSIS, 2025–2034, (USD MILLION)
FIGURE 108 MALAYSIA HYPERLOOP INFRASTRUCTURE AND SERVICE CURRENT AND FUTURE END USER ANALYSIS, 2025–2034, (USD MILLION)
FIGURE 109 REST OF SEA AND SOUTH ASIA HYPERLOOP INFRASTRUCTURE AND SERVICE CURRENT AND FUTURE TYPE ANALYSIS, 2025–2034, (USD MILLION)
FIGURE 110 REST OF SEA AND SOUTH ASIA HYPERLOOP INFRASTRUCTURE AND SERVICE CURRENT AND FUTURE END USER ANALYSIS, 2025–2034, (USD MILLION)
FIGURE 111 MIDDLE EAST AND AFRICA HYPERLOOP INFRASTRUCTURE AND SERVICE CURRENT AND FUTURE MARKET VOLUME SHARE REGIONAL ANALYSIS, 2025–2034, (USD MILLION)
FIGURE 112 GCC COUNTRIES HYPERLOOP INFRASTRUCTURE AND SERVICE CURRENT AND FUTURE TYPE ANALYSIS, 2025–2034, (USD MILLION)
FIGURE 113 GCC COUNTRIES HYPERLOOP INFRASTRUCTURE AND SERVICE CURRENT AND FUTURE END USER ANALYSIS, 2025–2034, (USD MILLION)
FIGURE 114 SAUDI ARABIA HYPERLOOP INFRASTRUCTURE AND SERVICE CURRENT AND FUTURE TYPE ANALYSIS, 2025–2034, (USD MILLION)
FIGURE 115 SAUDI ARABIA HYPERLOOP INFRASTRUCTURE AND SERVICE CURRENT AND FUTURE END USER ANALYSIS, 2025–2034, (USD MILLION)
FIGURE 116 UAE HYPERLOOP INFRASTRUCTURE AND SERVICE CURRENT AND FUTURE TYPE ANALYSIS, 2025–2034, (USD MILLION)
FIGURE 117 UAE HYPERLOOP INFRASTRUCTURE AND SERVICE CURRENT AND FUTURE END USER ANALYSIS, 2025–2034, (USD MILLION)
FIGURE 118 BAHRAIN HYPERLOOP INFRASTRUCTURE AND SERVICE CURRENT AND FUTURE TYPE ANALYSIS, 2025–2034, (USD MILLION)
FIGURE 119 BAHRAIN HYPERLOOP INFRASTRUCTURE AND SERVICE CURRENT AND FUTURE END USER ANALYSIS, 2025–2034, (USD MILLION)
FIGURE 120 KUWAIT HYPERLOOP INFRASTRUCTURE AND SERVICE CURRENT AND FUTURE TYPE ANALYSIS, 2025–2034, (USD MILLION)
FIGURE 121 KUWAIT HYPERLOOP INFRASTRUCTURE AND SERVICE CURRENT AND FUTURE END USER ANALYSIS, 2025–2034, (USD MILLION)
FIGURE 122 OMAN HYPERLOOP INFRASTRUCTURE AND SERVICE CURRENT AND FUTURE TYPE ANALYSIS, 2025–2034, (USD MILLION)
FIGURE 123 OMAN HYPERLOOP INFRASTRUCTURE AND SERVICE CURRENT AND FUTURE END USER ANALYSIS, 2025–2034, (USD MILLION)
FIGURE 124 QATAR HYPERLOOP INFRASTRUCTURE AND SERVICE CURRENT AND FUTURE TYPE ANALYSIS, 2025–2034, (USD MILLION)
FIGURE 125 QATAR HYPERLOOP INFRASTRUCTURE AND SERVICE CURRENT AND FUTURE END USER ANALYSIS, 2025–2034, (USD MILLION)
FIGURE 126 EGYPT HYPERLOOP INFRASTRUCTURE AND SERVICE CURRENT AND FUTURE TYPE ANALYSIS, 2025–2034, (USD MILLION)
FIGURE 127 EGYPT HYPERLOOP INFRASTRUCTURE AND SERVICE CURRENT AND FUTURE END USER ANALYSIS, 2025–2034, (USD MILLION)
FIGURE 128 NIGERIA HYPERLOOP INFRASTRUCTURE AND SERVICE CURRENT AND FUTURE TYPE ANALYSIS, 2025–2034, (USD MILLION)
FIGURE 129 NIGERIA HYPERLOOP INFRASTRUCTURE AND SERVICE CURRENT AND FUTURE END USER ANALYSIS, 2025–2034, (USD MILLION)
FIGURE 130 SOUTH AFRICA HYPERLOOP INFRASTRUCTURE AND SERVICE CURRENT AND FUTURE TYPE ANALYSIS, 2025–2034, (USD MILLION)
FIGURE 131 SOUTH AFRICA HYPERLOOP INFRASTRUCTURE AND SERVICE CURRENT AND FUTURE END USER ANALYSIS, 2025–2034, (USD MILLION)
FIGURE 132 ISRAEL HYPERLOOP INFRASTRUCTURE AND SERVICE CURRENT AND FUTURE TYPE ANALYSIS, 2025–2034, (USD MILLION)
FIGURE 133 ISRAEL HYPERLOOP INFRASTRUCTURE AND SERVICE CURRENT AND FUTURE END USER ANALYSIS, 2025–2034, (USD MILLION)
FIGURE 134 REST OF MEA HYPERLOOP INFRASTRUCTURE AND SERVICE CURRENT AND FUTURE TYPE ANALYSIS, 2025–2034, (USD MILLION)
FIGURE 135 REST OF MEA HYPERLOOP INFRASTRUCTURE AND SERVICE CURRENT AND FUTURE END USER ANALYSIS, 2025–2034, (USD MILLION)
FIGURE 136 U. S. MARKET SHARE ANALYSIS BY TYPE (2024)
FIGURE 137 U. S. MARKET SHARE ANALYSIS BY END USER (2024)
FIGURE 138 CANADA MARKET SHARE ANALYSIS BY TYPE (2024)
FIGURE 139 CANADA MARKET SHARE ANALYSIS BY END USER (2024)
FIGURE 140 MEXICO MARKET SHARE ANALYSIS BY TYPE (2024)
FIGURE 141 MEXICO MARKET SHARE ANALYSIS BY END USER (2024)
FIGURE 142 CHINA MARKET SHARE ANALYSIS BY TYPE (2024)
FIGURE 143 CHINA MARKET SHARE ANALYSIS BY END USER (2024)
FIGURE 144 JAPAN MARKET SHARE ANALYSIS BY TYPE (2024)
FIGURE 145 JAPAN MARKET SHARE ANALYSIS BY END USER (2024)
FIGURE 146 INDIA MARKET SHARE ANALYSIS BY TYPE (2024)
FIGURE 147 INDIA MARKET SHARE ANALYSIS BY END USER (2024)
FIGURE 148 SOUTH KOREA MARKET SHARE ANALYSIS BY TYPE (2024)
FIGURE 149 SOUTH KOREA MARKET SHARE ANALYSIS BY END USER (2024)
FIGURE 150 SAUDI ARABIA MARKET SHARE ANALYSIS BY TYPE (2024)
FIGURE 151 SAUDI ARABIA MARKET SHARE ANALYSIS BY END USER (2024)
FIGURE 152 UAE MARKET SHARE ANALYSIS BY TYPE (2024)
FIGURE 153 UAE MARKET SHARE ANALYSIS BY END USER (2024)
FIGURE 154 EGYPT MARKET SHARE ANALYSIS BY TYPE (2024)
FIGURE 155 EGYPT MARKET SHARE ANALYSIS BY END USER (2024)
FIGURE 156 NIGERIA MARKET SHARE ANALYSIS BY TYPE (2024)
FIGURE 157 NIGERIA MARKET SHARE ANALYSIS BY END USER (2024)
FIGURE 158 SOUTH AFRICA MARKET SHARE ANALYSIS BY TYPE (2024)
FIGURE 159 SOUTH AFRICA MARKET SHARE ANALYSIS BY END USER (2024)
FIGURE 160 GERMANY MARKET SHARE ANALYSIS BY TYPE (2024)
FIGURE 161 GERMANY MARKET SHARE ANALYSIS BY END USER (2024)
FIGURE 162 FRANCE MARKET SHARE ANALYSIS BY TYPE (2024)
FIGURE 163 FRANCE MARKET SHARE ANALYSIS BY END USER (2024)
FIGURE 164 UK MARKET SHARE ANALYSIS BY TYPE (2024)
FIGURE 165 UK MARKET SHARE ANALYSIS BY END USER (2024)
FIGURE 166 SPAIN MARKET SHARE ANALYSIS BY TYPE (2024)
FIGURE 167 SPAIN MARKET SHARE ANALYSIS BY END USER (2024)
FIGURE 168 ITALY MARKET SHARE ANALYSIS BY TYPE (2024)
FIGURE 169 ITALY MARKET SHARE ANALYSIS BY END USER (2024)
FIGURE 170 BRAZIL MARKET SHARE ANALYSIS BY TYPE (2024)
FIGURE 171 BRAZIL MARKET SHARE ANALYSIS BY END USER (2024)
FIGURE 172 ARGENTINA MARKET SHARE ANALYSIS BY TYPE (2024)
FIGURE 173 ARGENTINA MARKET SHARE ANALYSIS BY END USER (2024)
FIGURE 174 COLUMBIA MARKET SHARE ANALYSIS BY TYPE (2024)
FIGURE 175 COLUMBIA MARKET SHARE ANALYSIS BY END USER (2024)
FIGURE 176 GLOBAL HYPERLOOP INFRASTRUCTURE AND SERVICE CURRENT AND FUTURE MARKET KEY COUNTRY LEVEL ANALYSIS, 2024–2034, (USD MILLION)
FIGURE 177 FINANCIAL OVERVIEW:
Key Players Analysis:
Virgin Hyperloop: Virgin Hyperloop, headquartered in Los Angeles, California, is a leader in hyperloop development. It focuses on creating high-speed, sustainable transportation solutions, achieving successful test runs of its passenger pods. Virgin’s strategy revolves around innovation and partnerships, such as collaborations with DP World, to revolutionize cargo transport and passenger travel globally.
Hyperloop Transportation Technologies (HTT): HTT, based in Playa Vista, California, combines crowdsourcing with advanced technology to develop its hyperloop systems. HTT uses passive magnetic levitation technology for efficient travel and collaborates with global governments to construct viable routes. HTT’s strategy is to lead through technological innovation and sustainable energy solutions, aiming to be a key player in futuristic transport infrastructure.
Elon Musk's The Boring Company: Founded by Elon Musk, The Boring Company is based in Hawthorne, California. While primarily focused on tunnel construction, the company plays a key role in advancing hyperloop technology. Its business strategy includes leveraging Musk’s expertise in engineering to create cost-effective underground transportation systems, including hyperloop integration for urban mobility.
TransPod: TransPod, headquartered in Toronto, Canada, is a prominent player in hyperloop technology. The company is working on a full-scale, high-speed transportation system that aims to reduce travel times and energy consumption. Its strategy is to collaborate with global partners and governments to build hyperloop corridors, targeting both passenger and freight transport sectors.
Hardt Hyperloop: Hardt Hyperloop, based in the Netherlands, focuses on sustainable and efficient hyperloop systems. Their technology is centered around safety and energy efficiency, making hyperloop transport feasible across Europe. The company's strategy is to lead the hyperloop market in Europe by partnering with governments and industries to develop a continent-wide network of hyperloop routes.
Zeleros Hyperloop: Zeleros, a Spanish company based in Valencia, designs hyperloop systems for both passenger and freight transport. Their technology incorporates magnetic levitation and electric propulsion systems to minimize energy consumption. Zeleros’ strategy involves building scalable infrastructure and collaborating with European authorities to become the leading hyperloop provider across Europe.
Arrivo Corporation: Arrivo, previously headquartered in Los Angeles, focuses on next-generation transportation solutions, including the development of high-speed transport pods. The company aimed to implement its hyperloop systems within urban environments to reduce traffic congestion. Arrivo’s business strategy centered on integrating hyperloop technology into existing city transport frameworks, though the company has since shut down.
SpaceX Hyperloop: SpaceX, founded by Elon Musk and based in Hawthorne, California, is instrumental in conceptualizing hyperloop technology. While SpaceX does not directly commercialize hyperloop systems, it has hosted hyperloop design competitions to stimulate technological advancements. SpaceX’s strategy revolves around open innovation, encouraging global talent to develop hyperloop concepts and further space exploration goals.
DGW Hyperloop: DGWHyperloop, based in India, focuses on building hyperloop systems for the Indian subcontinent. The company aims to connect cities and reduce travel time between major urban centers. DGWHyperloop’s business strategy involves leveraging public-private partnerships and collaborating with Indian government bodies to create a hyperloop ecosystem that boosts regional transportation.
AECOM Hyperloop: AECOM, headquartered in Los Angeles, California, is a multinational infrastructure consulting firm with a dedicated focus on hyperloop technology. AECOM works on integrating hyperloop systems into urban infrastructure projects and has been involved in various feasibility studies and project designs globally. Their strategy includes sustainable transportation development and smart city planning through hyperloop integration.
Market Key Players
Virgin Hyperloop
Hyperloop Transportation Technologies (HTT)
Elon Musk's The Boring Company
TransPod
Hardt Hyperloop
Zeleros Hyperloop
Arrivo Corporation
SpaceX Hyperloop
DGWHyperloop
AECOM Hyperloop
Hyperloop India
Tesla Hyperloop
VicHyper
Swisspod Technologies
Hyper Chariot
FluxJet (TransPod subsidiary)
EPFLoop
Nevomo
Hyperloop One
Euroloop
Spacetrain
Driver:
Demand for Efficient Transportation
The growing need for efficient and time-saving transportation solutions is one of the key drivers of the hyperloop market. With increasing urbanization and the continuous expansion of metropolitan areas, traditional transportation systems are unable to meet the rising demand for fast and reliable transit. Hyperloop technology offers a unique solution by significantly reducing travel time between cities, potentially reaching speeds of up to 700 mph. This ability to cover large distances quickly and with minimal energy consumption positions hyperloop as a game-changing solution for future mobility, catering to both passenger and freight transportation needs. As a result, governments and private companies are investing heavily in hyperloop projects to revolutionize intercity travel.
Sustainability and Reduced Emissions
As global concerns around climate change and carbon emissions continue to grow, the push for sustainable transportation is becoming a significant driver in the hyperloop market. Hyperloop systems are designed to be energy-efficient, operating with minimal emissions compared to traditional transportation methods like cars, trains, and airplanes. Using electric propulsion and magnetic levitation, hyperloop vehicles can move through low-pressure tubes, significantly reducing energy consumption. This focus on sustainability aligns with global environmental goals, encouraging governments and businesses to invest in hyperloop as a long-term solution for eco-friendly transportation. The reduction in greenhouse gas emissions, coupled with hyperloop's potential for energy-efficient travel, is accelerating its adoption globally.
Technological Advancements in Transportation
Rapid advancements in transportation technologies, including electric propulsion, magnetic levitation, and materials science, are driving the development of the hyperloop market. The integration of cutting-edge innovations allows hyperloop systems to achieve high-speed, low-friction travel, which is not possible with conventional rail or road transportation. Magnetic levitation, in particular, eliminates the need for wheels, reducing wear and tear while increasing efficiency and speed. Furthermore, developments in tube design, such as using lightweight yet durable materials, enhance the safety and performance of hyperloop infrastructure. These advancements are making hyperloop systems more viable and attractive as a transportation option for both passengers and cargo.
Restraints:
High Initial Costs
The substantial initial investment required for the development and construction of hyperloop infrastructure poses a significant restraint to market growth. Building the necessary vacuum tubes, propulsion systems, and stations involves massive capital expenditure, which can deter potential investors. Additionally, the cost of research and development (R&D) to advance hyperloop technology is high, adding to the financial burden. Governments and companies may hesitate to invest in such large-scale projects without clear short-term returns. Moreover, the long construction timelines and complexities associated with hyperloop systems further amplify the cost challenges, making it difficult to secure funding for widespread adoption.
Regulatory and Safety Concerns
The hyperloop market faces significant regulatory challenges, as safety standards, zoning laws, and environmental regulations need to be developed and refined before full-scale adoption. Being a novel transportation system, hyperloop lacks established regulatory frameworks, requiring governments to create new laws to ensure safety and operational efficiency. Additionally, public safety concerns regarding traveling at extremely high speeds in a vacuum-sealed environment add another layer of complexity. Hyperloop technology will need to undergo extensive safety testing to gain public trust and regulatory approval, which could delay commercialization. These regulatory hurdles, coupled with potential public resistance, slow down market expansion and hinder large-scale development.
Opportunities:
Emerging Markets in Developing Regions
Developing regions, particularly in Asia-Pacific and Latin America, present significant growth opportunities for the hyperloop market. Countries such as India, China, and Brazil are experiencing rapid urbanization and industrialization, leading to increased demand for efficient and modern transportation solutions. The need to connect cities and reduce traffic congestion makes hyperloop systems an appealing option for governments looking to invest in next-generation infrastructure. These regions also face mounting environmental challenges, further driving the demand for sustainable and energy-efficient transportation. As emerging economies continue to expand, they offer fertile ground for hyperloop projects, potentially accelerating the global adoption of this innovative transportation technology.
Public-Private Partnerships and Investment
The hyperloop market is benefiting from growing public-private partnerships, as governments and private companies collaborate to develop and deploy hyperloop systems. Governments are increasingly recognizing the potential benefits of hyperloop technology for reducing travel time, improving logistics, and boosting economic growth. As a result, they are providing regulatory support and funding for feasibility studies and pilot projects. At the same time, private companies, including tech firms and transportation giants, are investing heavily in hyperloop technology to gain a competitive edge in the future of mobility. These collaborations present significant opportunities for scaling up hyperloop infrastructure and accelerating its commercial deployment.
Trend:
Integration of AI and IoT in Hyperloop Systems
One of the key trends in the hyperloop market is the integration of artificial intelligence (AI) and the Internet of Things (IoT) into hyperloop infrastructure. AI is being used to optimize hyperloop operations, enhance safety features, and ensure energy efficiency by monitoring capsule speeds and tube conditions in real-time. IoT devices are essential for providing seamless communication between the hyperloop system and its control centers, enabling precise management of capsule movements and infrastructure maintenance. This fusion of AI and IoT is making hyperloop systems smarter and more reliable, positioning them as a futuristic, automated transportation option.
Recent Development:
In March 2024: Swisspod Technologies and TuTr Hyperloop signed a Memorandum of Understanding (MoU) with the governments of Switzerland and India to advance the development of Hyperloop technology in India. The collaboration focuses on sustainable high-speed transportation solutions, with plans to design and fund a testing center in India to refine the technology and explore its commercial viability.
In February 2024: Hardt Hyperloop announced a partnership with Tata Steel to collaborate on innovative steel solutions designed for hyperloop systems. This partnership will enhance the development of sustainable and energy-efficient infrastructure for high-speed transport, focusing on lightweight and durable materials.
Frequently Asked Questions
How big is the Hyperloop Infrastructure and Service Market?
Discover the Global Hyperloop Infrastructure & Service Market projected to hit USD 112.4 Bn by 2034, growing at 41.6% CAGR. Driving the future of high-speed transport.
Who are the major players in the Hyperloop Infrastructure and Service Market?
Which segments covered the Hyperloop Infrastructure and Service Market?
By Infrastructure Type (Tube Infrastructure, Propulsion Systems, Capsule/Pods, Control Systems, Other Supporting Infrastructure), By Technology (Magnetic Levitation, Electric Propulsion), By Service Model (Passenger Travel Services, Freight & Logistics Services), By Speed Category (Up to 700 km/h, Above 700 km/h), By End-User (Government & Municipal Bodies, Commercial Enterprises, Logistics & Transportation Companies, Individual Commuters)
How can this market research report help my business make strategic decisions?
Our market research reports provide actionable intelligence, including verified market size data, CAGR projections, competitive benchmarking, and segment-level opportunity analysis. These insights support strategic planning, investment decisions, product development, and market entry strategies for enterprises and startups alike.
How frequently is the data updated?
We continuously monitor industry developments and update our reports to reflect regulatory changes, technological advancements, and macroeconomic shifts. Updated editions ensure you receive the latest market intelligence.

 Aerospace And Defence
 Agriculture
 Automotive And Transportation
 Banking And Finance
 Business
 Chemicals And Materials
 Consumer And Retail
 Electronics And Semiconductors
 Food And Beverages
 Machinery & Equipments
 Manufacturing And Construction
 Medical Devices
 Others
 Pharmaceuticals And Healthcare
 Power And Energy
 Sports
 Technology

, Transportation Type (Passenger, Cargo/Freight), Technology (Magnetic Levitation, Electric Propulsion), Region and Key Players - Industry Segment Overview, Market Dynamics, Competitive Strategies, Trends and Forecast 2025-2034")
, Transportation Type (Passenger, Cargo/Freight), Technology (Magnetic Levitation, Electric Propulsion), Region and Key Players - Industry Segment Overview, Market Dynamics, Competitive Strategies, Trends and Forecast 2025-2034")
, Transportation Type (Passenger, Cargo/Freight), Technology (Magnetic Levitation, Electric Propulsion), Region and Key Players - Industry Segment Overview, Market Dynamics, Competitive Strategies, Trends and Forecast 2025-2034")
, Transportation Type (Passenger, Cargo/Freight), Technology (Magnetic Levitation, Electric Propulsion), Region and Key Players - Industry Segment Overview, Market Dynamics, Competitive Strategies, Trends and Forecast 2025-2034")
