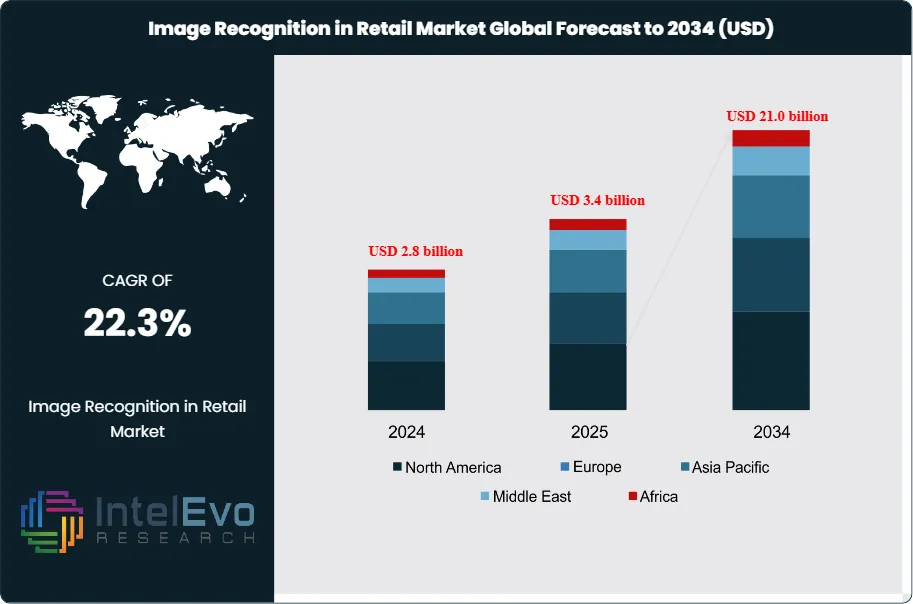
The Image Recognition in Retail Market is estimated at USD 2.8 billion in 2024 and is on track to reach roughly USD 21.0 billion by 2034, implying a compound annual growth rate of 22.3% over 2024–2034. This rapid expansion is driven by retailers’ increasing adoption of AI-powered visual analytics to enhance in-store experience, optimize shelf management, and reduce theft through automated loss prevention systems. Growing integration with smart cameras, computer vision, and real-time data platforms is further accelerating deployment across supermarkets, fashion stores, and omnichannel retail formats, positioning image recognition as a core enabler of next-generation retail intelligence.
Image recognition is moving from pilot to scaled deployment in retail formats worldwide. Large chains use computer vision to automate shelf monitoring, loss prevention, and queue management, while digital-native players embed visual search in apps to shorten the path from discovery to purchase. Rising labor costs, margin pressure, and elevated expectations for seamless journeys create strong demand-side pull. On the supply side, rapid advances in deep-learning algorithms, cloud infrastructure, and edge-compute cameras are lowering unit costs and enabling deployment across mid-sized and specialty retailers.
Strategic focus is shifting from isolated use cases to integrated smart store platforms. Retailers combine image data with transaction logs and loyalty profiles to generate near real-time insights on traffic flows, planogram compliance, and promotion performance. Early adopters report shrinkage reductions of 15–20%, inventory accuracy improvements of 3–5 percentage points, and uplift in conversion when visual search and recommendation engines guide product discovery. At the same time, vendors differentiate through accuracy rates that now approach 96% in controlled conditions, application-specific models, and flexible pricing that blends licenses with outcome-based contracts.
Regulation and risk shape adoption patterns. Data-privacy regimes in Europe and parts of Asia impose strict rules on biometric and in-store video analytics, forcing retailers to invest in consent management, anonymization, and secure data storage. Cybersecurity, algorithmic bias, and the risk of operational disruption during rollout remain key board-level concerns. Vendors respond with on-device processing, explainable AI modules, and governance features that document model behavior and audit trails.
North America currently accounts for an estimated 35% of global spending, supported by large-format retailers and technology partnerships. Europe holds roughly 27%, with emphasis on compliance and store modernization. Asia-Pacific represents the most dynamic growth corridor, with forecast CAGRs above 25% as China, Japan, South Korea, and India accelerate investment in autonomous stores, computer-vision-based payments, and augmented reality overlays. Venture and corporate investors increasingly target platform providers that can extend image recognition beyond stores into logistics, last-mile delivery, and media-rich commerce ecosystems.
Key Takeaways
Market Growth: The Image Recognition in Retail Market stands at estimated: USD 2.8 billion, 2024 and is on course to reach USD 21.0 billion, 2034. This trajectory implies a rapid expansion at a CAGR of 22.3%, 2024-2034.
Component: The Software segment leads overall spending with a 47.0% share, 2023, reflecting strong demand for AI-driven recognition engines. This segment is likely to maintain a commanding position with an estimated: 21.0% CAGR, 2024-2034 as retailers scale analytics and automation.
Deployment: Cloud deployment models dominate the architecture mix with a 60.0% share, 2023 in the image recognition in retail sector. Cloud-based solutions are projected to rise further to estimated: 75.0% share, 2030 as enterprises consolidate workloads and pursue scalable rollouts.
Driver: High automation needs and advanced analytics requirements act as primary growth catalysts, aligned with the 22.5% CAGR, 2024-2034. Adoption among large retail chains is expected to reach estimated: 40.0% penetration, 2026 as they prioritize store intelligence and loss reduction.
Restraint: Data-privacy, integration complexity, and upfront investment continue to slow full-scale rollout, delaying an estimated: 20.0% of planned projects, 2024. Compliance and security spending tied to image data governance is projected to reach estimated: 0.3 billion USD, 2024.
Opportunity: Object Recognition applications already hold a 30.6% share, 2023, while Visual Product Search accounts for 30.5% share, 2023, creating strong cross-sell potential. Combined, these use cases could unlock an estimated: 6.0 billion USD revenue pool, 2030 as retailers enhance discovery and navigation.
Trend: Vendors and retailers increasingly favor end-to-end platforms that bundle software, cloud services, and vertical models, lifting platform-based deals to estimated: 55.0% of new contracts, 2025. Continuous model upgrades aim to sustain accuracy levels above 96.0%, 2024 in production-grade deployments.
RegionalAnalysis: North America leads with estimated: 35.0% share, 2024, followed by Europe at estimated: 28.0% share, 2024 driven by compliance-focused innovation. Asia Pacific exhibits the fastest expansion with an estimated: 27.0% CAGR, 2024-2034 as China, India, and Southeast Asia accelerate AI-led store modernization.
By Component
The software segment continues to sit at the core of image recognition in retail. In 2023 it accounted for more than 47% of global revenue and is expected to retain a similar or slightly higher share through 2025 as retailers deepen spending on computer vision models, API-based recognition engines, and analytics platforms. You see software acting as the main layer that ingests visual data from cameras and smartphones, runs AI models, and feeds results into merchandising, pricing, and loyalty systems. Vendors increasingly ship modular platforms that support rapid updates, which is crucial as models need retraining on new product assortments and store formats.
Hardware spending grows at a steadier pace but still forms a significant cost base, especially where you deploy dedicated cameras, sensors, and edge gateways. Retailers move from basic CCTV to high-resolution IP cameras capable of supporting real-time analytics, which keeps hardware replacement cycles active over 2025 to 2028. Services, including integration, model training, managed operations, and consulting, gain share as many retailers lack in-house AI teams. By 2025 services already represent an estimated 25 to 30% of total project value, particularly in multi-country rollouts that require localization and compliance support.
By Deployment
Cloud deployment has emerged as the preferred model for image recognition in retail. In 2023, cloud-based solutions accounted for more than 60% of deployments and are set to exceed 70% by 2027 as more retailers seek flexible consumption models and central management of models and data. You benefit from the ability to run heavy training workloads in the cloud while pushing lighter inference tasks to the edge, which helps control latency and bandwidth.
On-premises deployment still holds relevance in high-volume or high-sensitivity environments such as large hypermarkets, fuel retail, and jurisdictions with strict data residency rules. These deployments often combine local servers with edge devices to keep video streams on-site while sharing only aggregated metadata to central systems. Over 2025 to 2030, many enterprises move to hybrid architectures, keeping 20 to 30% of workloads on-premises for compliance and latency reasons while shifting the rest to cloud platforms to tap into advanced AI tooling and managed services.
By Technology
Object recognition holds the largest technology share within image recognition in retail. In 2023 it represented more than 30.6% of the market and it continues to grow as you apply it to shelf monitoring, automated replenishment, and fraud detection. Accurate object recognition reduces manual audits, improves on-shelf availability, and supports new formats such as cashierless stores and smart trolleys. Retailers report double-digit reductions in out-of-stock rates when object recognition integrates with inventory and ordering systems.
Facial recognition, code recognition, digital image processing, and other technologies address specific use cases such as access control, loyalty identification, and legacy barcode workflows. Adoption of facial recognition remains uneven because of privacy concerns and regulation, particularly in Europe and parts of North America, which slows broader deployment. Digital image processing and hybrid approaches that anonymize individuals while tracking behavior at a cohort level gain traction, helping you extract insights on traffic patterns and category engagement without storing identifiable data.
By Application
Visual product search is one of the most visible applications to end customers. In 2023 it held more than 30.5% share of application-level revenue and has grown further through 2025 as fashion, beauty, and home retailers add camera-based search to apps and mobile sites. Instead of typing long descriptions, shoppers take a photo and receive similar items, which increases session time and conversion rates. Retailers also use this function in-store, allowing staff to match items from catalog images or social media posts quickly.
Security and surveillance, vision analytics, and marketing and advertising form a broad second cluster of applications. Loss prevention teams use image recognition to identify suspicious behavior and reduce shrink, while store operations teams track queue lengths, heat maps, and dwell times. Vision analytics feeds real-time content triggers on digital signage so that you can run campaigns tailored to time of day, store zone, or observed demographics. As adoption grows, many retailers consolidate these applications on a shared platform to reduce duplication and ensure that insights flow across merchandising, operations, and marketing.
By Region
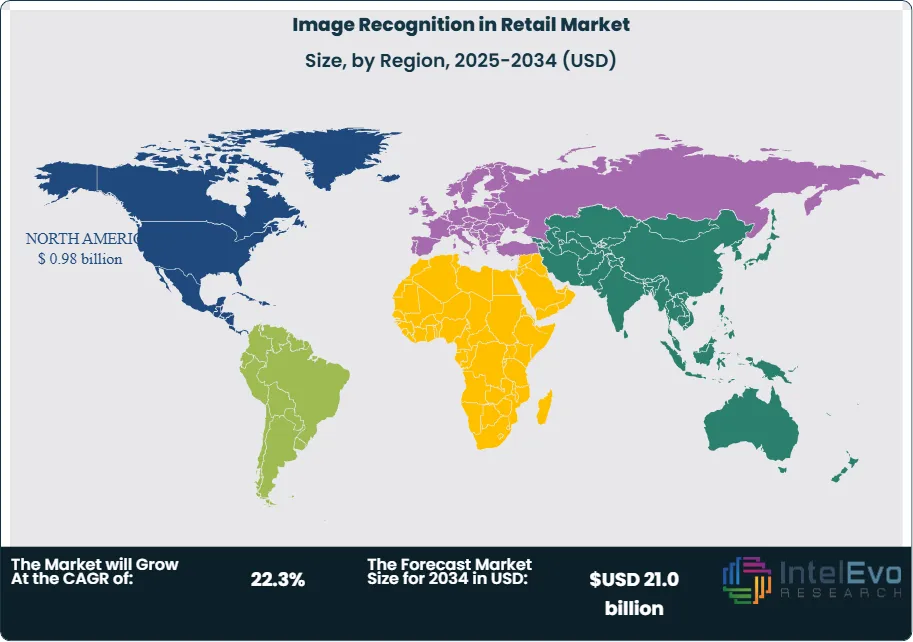
North America held more than 34.1% of the market in 2023 and remains the largest regional user through 2025, supported by big-box chains, strong technology ecosystems, and high labor costs that favor automation. Most major U.S. and Canadian retailers are past the pilot stage in at least one image recognition use case, such as planogram compliance or self-checkout monitoring. You also see deep collaboration between retailers and cloud hyperscalers that bundle vision services into broader data and analytics deals.
Europe ranks as the second largest region, with strong adoption in grocery and fashion but tighter constraints from data protection rules such as GDPR. Retailers in markets like the United Kingdom, Germany, and the Nordics invest heavily in privacy-by-design approaches and consent management. Asia Pacific shows the fastest growth, led by China, Japan, South Korea, and India, where mobile-first commerce and dense urban retail formats create strong demand for automated shelf tracking and visual search. Latin America and the Middle East & Africa remain smaller in absolute terms but present rising interest from modern trade and mall operators, often working with international platforms and regional system integrators to close capability gaps.
By Component, Software, Hardware, Services, By Deployment, On-Premises, Cloud, By Technology, Object Recognition, Code Recognition, Digital Image Processing, Facial Recognition, Other Technologies, By Application, Visual Product Search, Security and Surveillance, Vision Analytics, Marketing and Advertising, Other Applications
Research Methodology
Primary Research- 100 Interviews of Stakeholders
Secondary Research
Desk Research
Regional scope
North America (United States, Canada, Mexico)
Latin America (Brazil, Argentina, Columbia)
East Asia And Pacific (China, Japan, South Korea, Australia, Cambodia, Fiji, Indonesia)
Sea And South Asia (India, Singapore, Thailand, Taiwan, Malaysia)
Eastern Europe (Poland, Russia, Czech Republic, Romania)
Western Europe (Germany, U.K., France, Spain, Itlay)
Middle East & Africa (GCC Countries, Egypt, Nigeria, South Africa, Israel)
Customization for segments, region/country-level will be provided. Moreover, additional customization can be done based on the requirements.
Pricing and Purchase Options
Avail customized purchase options to meet your exact research needs. We have three licenses to opt for: Single User License, Multi-User License (Up to 5 Users), Corporate Use License (Unlimited User and Printable PDF).
TABLE OF CONTENTS
1. EXECUTIVE SUMMARY
1.1. MARKET SNAPSHOT
1.2. KEY FINDINGS & INSIGHTS
1.3. ANALYST RECOMMENDATIONS
1.4. FUTURE OUTLOOK
2. RESEARCH METHODOLOGY
2.1. MARKET DEFINITION & SCOPE
2.2. RESEARCH OBJECTIVES: PRIMARY & SECONDARY DATA SOURCES
2.3. DATA COLLECTION SOURCES
2.3.1. COVERAGE OF 100+ PRIMARY RESEARCH/CONSULTATION CALLS WITH INDUSTRY STAKEHOLDERS
FIGURE 17 NORTH AMERICA IMAGE RECOGNITION IN RETAIL CURRENT AND FUTURE TYPE ANALYSIS, 2025–2034, (USD MILLION)
FIGURE 18 NORTH AMERICA IMAGE RECOGNITION IN RETAIL CURRENT AND FUTURE END USER ANALYSIS, 2025–2034, (USD MILLION)
FIGURE 19 MARKET SHARE BY COUNTRY
FIGURE 20 LATIN AMERICA IMAGE RECOGNITION IN RETAIL CURRENT AND FUTURE TYPE ANALYSIS, 2025–2034, (USD MILLION)
FIGURE 21 LATIN AMERICA IMAGE RECOGNITION IN RETAIL CURRENT AND FUTURE END USER ANALYSIS, 2025–2034, (USD MILLION)
FIGURE 22 MARKET SHARE BY COUNTRY
FIGURE 23 EASTERN EUROPE IMAGE RECOGNITION IN RETAIL CURRENT AND FUTURE TYPE ANALYSIS, 2025–2034, (USD MILLION)
FIGURE 24 EASTERN EUROPE IMAGE RECOGNITION IN RETAIL CURRENT AND FUTURE END USER ANALYSIS, 2025–2034, (USD MILLION)
FIGURE 25 MARKET SHARE BY COUNTRY
FIGURE 26 WESTERN EUROPE IMAGE RECOGNITION IN RETAIL CURRENT AND FUTURE TYPE ANALYSIS, 2025–2034, (USD MILLION)
FIGURE 27 WESTERN EUROPE IMAGE RECOGNITION IN RETAIL CURRENT AND FUTURE END USER ANALYSIS, 2025–2034, (USD MILLION)
FIGURE 28 MARKET SHARE BY COUNTRY
FIGURE 29 EAST ASIA AND PACIFIC IMAGE RECOGNITION IN RETAIL CURRENT AND FUTURE TYPE ANALYSIS, 2025–2034, (USD MILLION)
FIGURE 30 EAST ASIA AND PACIFIC IMAGE RECOGNITION IN RETAIL CURRENT AND FUTURE END USER ANALYSIS, 2025–2034, (USD MILLION)
FIGURE 31 MARKET SHARE BY COUNTRY
FIGURE 32 SEA AND SOUTH ASIA IMAGE RECOGNITION IN RETAIL CURRENT AND FUTURE TYPE ANALYSIS, 2025–2034, (USD MILLION)
FIGURE 33 SEA AND SOUTH ASIA IMAGE RECOGNITION IN RETAIL CURRENT AND FUTURE END USER ANALYSIS, 2025–2034, (USD MILLION)
FIGURE 34 MARKET SHARE BY COUNTRY
FIGURE 35 MIDDLE EAST AND AFRICA IMAGE RECOGNITION IN RETAIL CURRENT AND FUTURE TYPE ANALYSIS, 2025–2034, (USD MILLION)
FIGURE 36 MIDDLE EAST AND AFRICA IMAGE RECOGNITION IN RETAIL CURRENT AND FUTURE END USER ANALYSIS, 2025–2034, (USD MILLION)
FIGURE 37 NORTH AMERICA IMAGE RECOGNITION IN RETAIL CURRENT AND FUTURE MARKET VOLUME SHARE REGIONAL ANALYSIS, 2025–2034, (USD MILLION)
FIGURE 38 U.S. IMAGE RECOGNITION IN RETAIL CURRENT AND FUTURE TYPE ANALYSIS, 2025–2034, (USD MILLION)
FIGURE 39 U.S. IMAGE RECOGNITION IN RETAIL CURRENT AND FUTURE END USER ANALYSIS, 2025–2034, (USD MILLION)
FIGURE 40 CANADA IMAGE RECOGNITION IN RETAIL CURRENT AND FUTURE TYPE ANALYSIS, 2025–2034, (USD MILLION)
FIGURE 41 CANADA IMAGE RECOGNITION IN RETAIL CURRENT AND FUTURE END USER ANALYSIS, 2025–2034, (USD MILLION)
FIGURE 42 LATIN AMERICA IMAGE RECOGNITION IN RETAIL CURRENT AND FUTURE MARKET VOLUME SHARE REGIONAL ANALYSIS, 2025–2034, (USD MILLION)
FIGURE 43 MEXICO IMAGE RECOGNITION IN RETAIL CURRENT AND FUTURE TYPE ANALYSIS, 2025–2034, (USD MILLION)
FIGURE 44 MEXICO IMAGE RECOGNITION IN RETAIL CURRENT AND FUTURE END USER ANALYSIS, 2025–2034, (USD MILLION)
FIGURE 45 BRAZIL IMAGE RECOGNITION IN RETAIL CURRENT AND FUTURE TYPE ANALYSIS, 2025–2034, (USD MILLION)
FIGURE 46 BRAZIL IMAGE RECOGNITION IN RETAIL CURRENT AND FUTURE END USER ANALYSIS, 2025–2034, (USD MILLION)
FIGURE 47 ARGENTINA IMAGE RECOGNITION IN RETAIL CURRENT AND FUTURE TYPE ANALYSIS, 2025–2034, (USD MILLION)
FIGURE 48 ARGENTINA IMAGE RECOGNITION IN RETAIL CURRENT AND FUTURE END USER ANALYSIS, 2025–2034, (USD MILLION)
FIGURE 49 COLUMBIA IMAGE RECOGNITION IN RETAIL CURRENT AND FUTURE TYPE ANALYSIS, 2025–2034, (USD MILLION)
FIGURE 50 COLUMBIA IMAGE RECOGNITION IN RETAIL CURRENT AND FUTURE END USER ANALYSIS, 2025–2034, (USD MILLION)
FIGURE 51 REST OF LATIN AMERICA IMAGE RECOGNITION IN RETAIL CURRENT AND FUTURE TYPE ANALYSIS, 2025–2034, (USD MILLION)
FIGURE 52 REST OF LATIN AMERICA IMAGE RECOGNITION IN RETAIL CURRENT AND FUTURE END USER ANALYSIS, 2025–2034, (USD MILLION)
FIGURE 53 EASTERN EUROPE IMAGE RECOGNITION IN RETAIL CURRENT AND FUTURE MARKET VOLUME SHARE REGIONAL ANALYSIS, 2025–2034, (USD MILLION)
FIGURE 54 POLAND IMAGE RECOGNITION IN RETAIL CURRENT AND FUTURE TYPE ANALYSIS, 2025–2034, (USD MILLION)
FIGURE 55 POLAND IMAGE RECOGNITION IN RETAIL CURRENT AND FUTURE END USER ANALYSIS, 2025–2034, (USD MILLION)
FIGURE 56 RUSSIA IMAGE RECOGNITION IN RETAIL CURRENT AND FUTURE TYPE ANALYSIS, 2025–2034, (USD MILLION)
FIGURE 57 RUSSIA IMAGE RECOGNITION IN RETAIL CURRENT AND FUTURE END USER ANALYSIS, 2025–2034, (USD MILLION)
FIGURE 58 CZECH REPUBLIC IMAGE RECOGNITION IN RETAIL CURRENT AND FUTURE TYPE ANALYSIS, 2025–2034, (USD MILLION)
FIGURE 59 CZECH REPUBLIC IMAGE RECOGNITION IN RETAIL CURRENT AND FUTURE END USER ANALYSIS, 2025–2034, (USD MILLION)
FIGURE 60 ROMANIA IMAGE RECOGNITION IN RETAIL CURRENT AND FUTURE TYPE ANALYSIS, 2025–2034, (USD MILLION)
FIGURE 61 ROMANIA IMAGE RECOGNITION IN RETAIL CURRENT AND FUTURE END USER ANALYSIS, 2025–2034, (USD MILLION)
FIGURE 62 REST OF EASTERN EUROPE IMAGE RECOGNITION IN RETAIL CURRENT AND FUTURE TYPE ANALYSIS, 2025–2034, (USD MILLION)
FIGURE 63 REST OF EASTERN EUROPE IMAGE RECOGNITION IN RETAIL CURRENT AND FUTURE END USER ANALYSIS, 2025–2034, (USD MILLION)
FIGURE 64 WESTERN EUROPE IMAGE RECOGNITION IN RETAIL CURRENT AND FUTURE MARKET VOLUME SHARE REGIONAL ANALYSIS, 2025–2034, (USD MILLION)
FIGURE 65 GERMANY IMAGE RECOGNITION IN RETAIL CURRENT AND FUTURE TYPE ANALYSIS, 2025–2034, (USD MILLION)
FIGURE 66 GERMANY IMAGE RECOGNITION IN RETAIL CURRENT AND FUTURE END USER ANALYSIS, 2025–2034, (USD MILLION)
FIGURE 67 FRANCE IMAGE RECOGNITION IN RETAIL CURRENT AND FUTURE TYPE ANALYSIS, 2025–2034, (USD MILLION)
FIGURE 68 FRANCE IMAGE RECOGNITION IN RETAIL CURRENT AND FUTURE END USER ANALYSIS, 2025–2034, (USD MILLION)
FIGURE 69 UK IMAGE RECOGNITION IN RETAIL CURRENT AND FUTURE TYPE ANALYSIS, 2025–2034, (USD MILLION)
FIGURE 70 UK IMAGE RECOGNITION IN RETAIL CURRENT AND FUTURE END USER ANALYSIS, 2025–2034, (USD MILLION)
FIGURE 71 SPAIN IMAGE RECOGNITION IN RETAIL CURRENT AND FUTURE TYPE ANALYSIS, 2025–2034, (USD MILLION)
FIGURE 72 SPAIN IMAGE RECOGNITION IN RETAIL CURRENT AND FUTURE END USER ANALYSIS, 2025–2034, (USD MILLION)
FIGURE 73 ITALY IMAGE RECOGNITION IN RETAIL CURRENT AND FUTURE TYPE ANALYSIS, 2025–2034, (USD MILLION)
FIGURE 74 ITALY IMAGE RECOGNITION IN RETAIL CURRENT AND FUTURE END USER ANALYSIS, 2025–2034, (USD MILLION)
FIGURE 75 REST OF WESTERN EUROPE IMAGE RECOGNITION IN RETAIL CURRENT AND FUTURE TYPE ANALYSIS, 2025–2034, (USD MILLION)
FIGURE 76 REST OF WESTERN EUROPE IMAGE RECOGNITION IN RETAIL CURRENT AND FUTURE END USER ANALYSIS, 2025–2034, (USD MILLION)
FIGURE 77 EAST ASIA AND PACIFIC IMAGE RECOGNITION IN RETAIL CURRENT AND FUTURE MARKET VOLUME SHARE REGIONAL ANALYSIS, 2025–2034, (USD MILLION)
FIGURE 78 CHINA IMAGE RECOGNITION IN RETAIL CURRENT AND FUTURE TYPE ANALYSIS, 2025–2034, (USD MILLION)
FIGURE 79 CHINA IMAGE RECOGNITION IN RETAIL CURRENT AND FUTURE END USER ANALYSIS, 2025–2034, (USD MILLION)
FIGURE 80 JAPAN IMAGE RECOGNITION IN RETAIL CURRENT AND FUTURE TYPE ANALYSIS, 2025–2034, (USD MILLION)
FIGURE 81 JAPAN IMAGE RECOGNITION IN RETAIL CURRENT AND FUTURE END USER ANALYSIS, 2025–2034, (USD MILLION)
FIGURE 82 AUSTRALIA IMAGE RECOGNITION IN RETAIL CURRENT AND FUTURE TYPE ANALYSIS, 2025–2034, (USD MILLION)
FIGURE 83 AUSTRALIA IMAGE RECOGNITION IN RETAIL CURRENT AND FUTURE END USER ANALYSIS, 2025–2034, (USD MILLION)
FIGURE 84 CAMBODIA IMAGE RECOGNITION IN RETAIL CURRENT AND FUTURE TYPE ANALYSIS, 2025–2034, (USD MILLION)
FIGURE 85 CAMBODIA IMAGE RECOGNITION IN RETAIL CURRENT AND FUTURE END USER ANALYSIS, 2025–2034, (USD MILLION)
FIGURE 86 FIJI IMAGE RECOGNITION IN RETAIL CURRENT AND FUTURE TYPE ANALYSIS, 2025–2034, (USD MILLION)
FIGURE 87 FIJI IMAGE RECOGNITION IN RETAIL CURRENT AND FUTURE END USER ANALYSIS, 2025–2034, (USD MILLION)
FIGURE 88 INDONESIA IMAGE RECOGNITION IN RETAIL CURRENT AND FUTURE TYPE ANALYSIS, 2025–2034, (USD MILLION)
FIGURE 89 INDONESIA IMAGE RECOGNITION IN RETAIL CURRENT AND FUTURE END USER ANALYSIS, 2025–2034, (USD MILLION)
FIGURE 90 SOUTH KOREA IMAGE RECOGNITION IN RETAIL CURRENT AND FUTURE TYPE ANALYSIS, 2025–2034, (USD MILLION)
FIGURE 91 SOUTH KOREA IMAGE RECOGNITION IN RETAIL CURRENT AND FUTURE END USER ANALYSIS, 2025–2034, (USD MILLION)
FIGURE 92 REST OF EAST ASIA AND PACIFIC IMAGE RECOGNITION IN RETAIL CURRENT AND FUTURE TYPE ANALYSIS, 2025–2034, (USD MILLION)
FIGURE 93 REST OF EAST ASIA AND PACIFIC IMAGE RECOGNITION IN RETAIL CURRENT AND FUTURE END USER ANALYSIS, 2025–2034, (USD MILLION)
FIGURE 94 SEA AND SOUTH ASIA IMAGE RECOGNITION IN RETAIL CURRENT AND FUTURE MARKET VOLUME SHARE REGIONAL ANALYSIS, 2025–2034, (USD MILLION)
FIGURE 95 BANGLADESH IMAGE RECOGNITION IN RETAIL CURRENT AND FUTURE TYPE ANALYSIS, 2025–2034, (USD MILLION)
FIGURE 96 BANGLADESH IMAGE RECOGNITION IN RETAIL CURRENT AND FUTURE END USER ANALYSIS, 2025–2034, (USD MILLION)
FIGURE 97 NEW ZEALAND IMAGE RECOGNITION IN RETAIL CURRENT AND FUTURE TYPE ANALYSIS, 2025–2034, (USD MILLION)
FIGURE 98 NEW ZEALAND IMAGE RECOGNITION IN RETAIL CURRENT AND FUTURE END USER ANALYSIS, 2025–2034, (USD MILLION)
FIGURE 99 INDIA IMAGE RECOGNITION IN RETAIL CURRENT AND FUTURE TYPE ANALYSIS, 2025–2034, (USD MILLION)
FIGURE 100 INDIA IMAGE RECOGNITION IN RETAIL CURRENT AND FUTURE END USER ANALYSIS, 2025–2034, (USD MILLION)
FIGURE 101 SINGAPORE IMAGE RECOGNITION IN RETAIL CURRENT AND FUTURE TYPE ANALYSIS, 2025–2034, (USD MILLION)
FIGURE 102 SINGAPORE IMAGE RECOGNITION IN RETAIL CURRENT AND FUTURE END USER ANALYSIS, 2025–2034, (USD MILLION)
FIGURE 103 THAILAND IMAGE RECOGNITION IN RETAIL CURRENT AND FUTURE TYPE ANALYSIS, 2025–2034, (USD MILLION)
FIGURE 104 THAILAND IMAGE RECOGNITION IN RETAIL CURRENT AND FUTURE END USER ANALYSIS, 2025–2034, (USD MILLION)
FIGURE 105 TAIWAN IMAGE RECOGNITION IN RETAIL CURRENT AND FUTURE TYPE ANALYSIS, 2025–2034, (USD MILLION)
FIGURE 106 TAIWAN IMAGE RECOGNITION IN RETAIL CURRENT AND FUTURE END USER ANALYSIS, 2025–2034, (USD MILLION)
FIGURE 107 MALAYSIA IMAGE RECOGNITION IN RETAIL CURRENT AND FUTURE TYPE ANALYSIS, 2025–2034, (USD MILLION)
FIGURE 108 MALAYSIA IMAGE RECOGNITION IN RETAIL CURRENT AND FUTURE END USER ANALYSIS, 2025–2034, (USD MILLION)
FIGURE 109 REST OF SEA AND SOUTH ASIA IMAGE RECOGNITION IN RETAIL CURRENT AND FUTURE TYPE ANALYSIS, 2025–2034, (USD MILLION)
FIGURE 110 REST OF SEA AND SOUTH ASIA IMAGE RECOGNITION IN RETAIL CURRENT AND FUTURE END USER ANALYSIS, 2025–2034, (USD MILLION)
FIGURE 111 MIDDLE EAST AND AFRICA IMAGE RECOGNITION IN RETAIL CURRENT AND FUTURE MARKET VOLUME SHARE REGIONAL ANALYSIS, 2025–2034, (USD MILLION)
FIGURE 112 GCC COUNTRIES IMAGE RECOGNITION IN RETAIL CURRENT AND FUTURE TYPE ANALYSIS, 2025–2034, (USD MILLION)
FIGURE 113 GCC COUNTRIES IMAGE RECOGNITION IN RETAIL CURRENT AND FUTURE END USER ANALYSIS, 2025–2034, (USD MILLION)
FIGURE 114 SAUDI ARABIA IMAGE RECOGNITION IN RETAIL CURRENT AND FUTURE TYPE ANALYSIS, 2025–2034, (USD MILLION)
FIGURE 115 SAUDI ARABIA IMAGE RECOGNITION IN RETAIL CURRENT AND FUTURE END USER ANALYSIS, 2025–2034, (USD MILLION)
FIGURE 116 UAE IMAGE RECOGNITION IN RETAIL CURRENT AND FUTURE TYPE ANALYSIS, 2025–2034, (USD MILLION)
FIGURE 117 UAE IMAGE RECOGNITION IN RETAIL CURRENT AND FUTURE END USER ANALYSIS, 2025–2034, (USD MILLION)
FIGURE 118 BAHRAIN IMAGE RECOGNITION IN RETAIL CURRENT AND FUTURE TYPE ANALYSIS, 2025–2034, (USD MILLION)
FIGURE 119 BAHRAIN IMAGE RECOGNITION IN RETAIL CURRENT AND FUTURE END USER ANALYSIS, 2025–2034, (USD MILLION)
FIGURE 120 KUWAIT IMAGE RECOGNITION IN RETAIL CURRENT AND FUTURE TYPE ANALYSIS, 2025–2034, (USD MILLION)
FIGURE 121 KUWAIT IMAGE RECOGNITION IN RETAIL CURRENT AND FUTURE END USER ANALYSIS, 2025–2034, (USD MILLION)
FIGURE 122 OMAN IMAGE RECOGNITION IN RETAIL CURRENT AND FUTURE TYPE ANALYSIS, 2025–2034, (USD MILLION)
FIGURE 123 OMAN IMAGE RECOGNITION IN RETAIL CURRENT AND FUTURE END USER ANALYSIS, 2025–2034, (USD MILLION)
FIGURE 124 QATAR IMAGE RECOGNITION IN RETAIL CURRENT AND FUTURE TYPE ANALYSIS, 2025–2034, (USD MILLION)
FIGURE 125 QATAR IMAGE RECOGNITION IN RETAIL CURRENT AND FUTURE END USER ANALYSIS, 2025–2034, (USD MILLION)
FIGURE 126 EGYPT IMAGE RECOGNITION IN RETAIL CURRENT AND FUTURE TYPE ANALYSIS, 2025–2034, (USD MILLION)
FIGURE 127 EGYPT IMAGE RECOGNITION IN RETAIL CURRENT AND FUTURE END USER ANALYSIS, 2025–2034, (USD MILLION)
FIGURE 128 NIGERIA IMAGE RECOGNITION IN RETAIL CURRENT AND FUTURE TYPE ANALYSIS, 2025–2034, (USD MILLION)
FIGURE 129 NIGERIA IMAGE RECOGNITION IN RETAIL CURRENT AND FUTURE END USER ANALYSIS, 2025–2034, (USD MILLION)
FIGURE 130 SOUTH AFRICA IMAGE RECOGNITION IN RETAIL CURRENT AND FUTURE TYPE ANALYSIS, 2025–2034, (USD MILLION)
FIGURE 131 SOUTH AFRICA IMAGE RECOGNITION IN RETAIL CURRENT AND FUTURE END USER ANALYSIS, 2025–2034, (USD MILLION)
FIGURE 132 ISRAEL IMAGE RECOGNITION IN RETAIL CURRENT AND FUTURE TYPE ANALYSIS, 2025–2034, (USD MILLION)
FIGURE 133 ISRAEL IMAGE RECOGNITION IN RETAIL CURRENT AND FUTURE END USER ANALYSIS, 2025–2034, (USD MILLION)
FIGURE 134 REST OF MEA IMAGE RECOGNITION IN RETAIL CURRENT AND FUTURE TYPE ANALYSIS, 2025–2034, (USD MILLION)
FIGURE 135 REST OF MEA IMAGE RECOGNITION IN RETAIL CURRENT AND FUTURE END USER ANALYSIS, 2025–2034, (USD MILLION)
FIGURE 136 U. S. MARKET SHARE ANALYSIS BY TYPE (2024)
FIGURE 137 U. S. MARKET SHARE ANALYSIS BY END USER (2024)
FIGURE 138 CANADA MARKET SHARE ANALYSIS BY TYPE (2024)
FIGURE 139 CANADA MARKET SHARE ANALYSIS BY END USER (2024)
FIGURE 140 MEXICO MARKET SHARE ANALYSIS BY TYPE (2024)
FIGURE 141 MEXICO MARKET SHARE ANALYSIS BY END USER (2024)
FIGURE 142 CHINA MARKET SHARE ANALYSIS BY TYPE (2024)
FIGURE 143 CHINA MARKET SHARE ANALYSIS BY END USER (2024)
FIGURE 144 JAPAN MARKET SHARE ANALYSIS BY TYPE (2024)
FIGURE 145 JAPAN MARKET SHARE ANALYSIS BY END USER (2024)
FIGURE 146 INDIA MARKET SHARE ANALYSIS BY TYPE (2024)
FIGURE 147 INDIA MARKET SHARE ANALYSIS BY END USER (2024)
FIGURE 148 SOUTH KOREA MARKET SHARE ANALYSIS BY TYPE (2024)
FIGURE 149 SOUTH KOREA MARKET SHARE ANALYSIS BY END USER (2024)
FIGURE 150 SAUDI ARABIA MARKET SHARE ANALYSIS BY TYPE (2024)
FIGURE 151 SAUDI ARABIA MARKET SHARE ANALYSIS BY END USER (2024)
FIGURE 152 UAE MARKET SHARE ANALYSIS BY TYPE (2024)
FIGURE 153 UAE MARKET SHARE ANALYSIS BY END USER (2024)
FIGURE 154 EGYPT MARKET SHARE ANALYSIS BY TYPE (2024)
FIGURE 155 EGYPT MARKET SHARE ANALYSIS BY END USER (2024)
FIGURE 156 NIGERIA MARKET SHARE ANALYSIS BY TYPE (2024)
FIGURE 157 NIGERIA MARKET SHARE ANALYSIS BY END USER (2024)
FIGURE 158 SOUTH AFRICA MARKET SHARE ANALYSIS BY TYPE (2024)
FIGURE 159 SOUTH AFRICA MARKET SHARE ANALYSIS BY END USER (2024)
FIGURE 160 GERMANY MARKET SHARE ANALYSIS BY TYPE (2024)
FIGURE 161 GERMANY MARKET SHARE ANALYSIS BY END USER (2024)
FIGURE 162 FRANCE MARKET SHARE ANALYSIS BY TYPE (2024)
FIGURE 163 FRANCE MARKET SHARE ANALYSIS BY END USER (2024)
FIGURE 164 UK MARKET SHARE ANALYSIS BY TYPE (2024)
FIGURE 165 UK MARKET SHARE ANALYSIS BY END USER (2024)
FIGURE 166 SPAIN MARKET SHARE ANALYSIS BY TYPE (2024)
FIGURE 167 SPAIN MARKET SHARE ANALYSIS BY END USER (2024)
FIGURE 168 ITALY MARKET SHARE ANALYSIS BY TYPE (2024)
FIGURE 169 ITALY MARKET SHARE ANALYSIS BY END USER (2024)
FIGURE 170 BRAZIL MARKET SHARE ANALYSIS BY TYPE (2024)
FIGURE 171 BRAZIL MARKET SHARE ANALYSIS BY END USER (2024)
FIGURE 172 ARGENTINA MARKET SHARE ANALYSIS BY TYPE (2024)
FIGURE 173 ARGENTINA MARKET SHARE ANALYSIS BY END USER (2024)
FIGURE 174 COLUMBIA MARKET SHARE ANALYSIS BY TYPE (2024)
FIGURE 175 COLUMBIA MARKET SHARE ANALYSIS BY END USER (2024)
FIGURE 176 GLOBAL IMAGE RECOGNITION IN RETAIL CURRENT AND FUTURE MARKET KEY COUNTRY LEVEL ANALYSIS, 2024–2034, (USD MILLION)
FIGURE 177 FINANCIAL OVERVIEW:
Key Player Analysis
Nike, Inc. Nike acts as a leader in applying image recognition within retail environments due to its early investment in AI driven store experiences and global digital infrastructure. The company integrates computer vision into its Nike App and flagship stores to support visual product search, autonomous checkout, and real time inventory visibility. These capabilities support its broader direct to consumer strategy, which accounted for more than 40 percent of total revenue in 2024. Nike continues to expand its data and AI capabilities through partnerships with cloud providers and investments in model training to improve product identification accuracy across large assortments. Its global footprint and strong brand adoption give Nike an advantage when deploying vision tools across stores in North America, Europe, and China.
Strategically, Nike channels significant investment into demand sensing and supply chain analytics, which rely on image based auditing for distribution centers and retail outlets. This alignment strengthens inventory accuracy and reduces out of stock events that impact sell through. The company differentiates itself by integrating vision technology into membership programs, creating personalized journeys that reflect user behavior, product preferences, and in store interactions. Nike's scale and digital maturity continue to position it as a reference point for AI enabled retail operations through 2025.
New Balance Athletics, Inc. New Balance positions itself as a challenger with focused investments in computer vision to improve product discovery and store efficiency. The company deploys image recognition tools within select stores and partner locations to support digital fit guidance, assortment visualization, and customer assistance. Its initiatives include collaborations with technology providers that specialize in object detection and mobile based visual search, particularly for running and lifestyle footwear. These tools support the brand's effort to compete in premium performance categories where accurate product matching and sizing are important drivers of conversion.
New Balance places strong emphasis on supply chain transparency and store level accuracy. Image recognition supports its quality control processes and helps verify product flow from manufacturing sites to shelves. While the company's global revenue base is smaller than that of category leaders, its targeted use of vision technology allows it to differentiate on fit analysis, personalized product suggestions, and customer service in high traffic urban stores. This approach positions New Balance to expand its digital footprint through 2025.
Skechers USA, Inc. Skechers operates as a high volume global retailer and uses image recognition to advance operational efficiency and merchandising precision. The company applies computer vision for shelf monitoring, planogram checks, and product classification across thousands of stores worldwide. These investments align with its rapid store expansion strategy, which added more than 300 new locations in 2024. Skechers also integrates image based analytics into its e commerce platform to support visual product search and style recommendations.
Strategically, the company focuses on technology partnerships that support rapid deployment across diverse retail environments. Its strength lies in its broad product catalog and ability to serve value oriented segments where availability and assortment accuracy matter. Image recognition helps Skechers reduce manual workload, shorten replenishment cycles, and improve conversion across both digital and physical channels. This operational model positions the company as a strong adopter of AI driven retail tools through 2025.
Market Key Players
Snap2Insight Inc.
Ricoh Innovations Corporation
Trax Retail
IBM
NEC Corporation
Blippar Ltd.
AWS
Catchoom Technologies S.L.
Microsoft
Jumio Corporation
Hitachi Ltd.
Google
Qualcomm Technologies Inc.
Wikitude GmbH
Attrasoft Inc.
Other Key Players
Driver:
Operational Accuracy and Real-Time Store Intelligence
By 2025, retailers are increasingly using image recognition solutions to boost operational accuracy and support data-driven store management. Computer vision systems automate tasks like shelf monitoring, product identification, and stock checks. This reduces the need for manual audits. Many large-format retailers report improvements of 10 to 15% in inventory accuracy and lower labor costs, especially in environments with many SKUs, like grocery and fashion. These efficiency gains help protect profit margins in a competitive retail landscape.
Personalized Engagement and Revenue Optimization
Image recognition is also becoming key for creating personalized retail experiences. AI-powered cameras and analytics platforms track customer movement and product interactions. This allows retailers to offer targeted promotions and dynamic pricing in real time. Such capabilities improve conversion rates and basket sizes while matching promotions with actual shopper behavior. As customers increasingly expect smooth, personalized journeys, image recognition helps differentiate brands and build long-term loyalty.
Restraint:
High Deployment Costs and Infrastructure Complexity
High initial deployment costs remain a major barrier in 2025. Retailers need to invest in cameras, edge devices, cloud processing, and AI model training, which can strain IT budgets, especially for mid-sized and regional chains. In many cases, total implementation costs are higher than expected, slowing decision-making and limiting large-scale rollouts.
Integration and Skills Gaps
Integration challenges also limit adoption. Image recognition systems must connect with older POS, ERP, and CCTV setups, often needing custom development and long testing cycles. Additionally, retailers face a shortage of in-house AI and data engineering skills, leading to greater reliance on external vendors. These technical and talent issues widen the gap between early adopters and retailers with less digital maturity.
Opportunity:
Asia-Pacific Retail Digitization Surge
Asia-Pacific is one of the most promising growth areas for image recognition in retail. Rapid growth in organized retail, increasing smartphone use, and rising e-commerce are driving demand for visual analytics. Countries like China, India, Indonesia, and Vietnam are investing heavily in smart stores, automated checkout, and AI-driven loss prevention. This creates a favorable environment for scalable image recognition deployments.
High-Volume and Mobile-First Use Cases
The region’s mobile-first consumers support the quick adoption of image-based search, visual product recognition, and real-time security analytics. Retailers in Asia-Pacific focus on solutions that are fast to deploy and can handle high transaction volumes with minimal delay. With a projected annual growth rate of over 23% through 2030, solution providers that tailor their offerings to busy, high-traffic retail settings have a chance to capture significant market share.
Trend:
Rise of Vision-Driven Customer Journeys
Retailers are increasingly creating vision-driven shopping journeys that depend on image recognition. Visual search is gaining popularity, especially in fashion and home décor, where customers prefer using cameras instead of text searches. The use of visual search tools is growing by more than 20% each year, changing how consumers discover and evaluate products online and in-store.
Integration with AR and Real-Time Analytics
Another key trend is the merging of image recognition with augmented reality and real-time analytics. AR try-ons, digital overlays for navigation, and automated checkout monitoring make the shopping journey easier and less frustrating. At the same time, real-time vision analytics enhance planogram compliance and shorten audit times. Together, these trends indicate that visual data is becoming a fundamental part of modern retail decision-making.
Recent Developments
• Dec 2024 – Amazon Web Services (AWS): AWS launched a dedicated Retail Vision Suite that combines shelf analytics, loss prevention, and visual product search, priced on a usage-based model and targeting retailers with over USD 500 million in annual sales. The move strengthens AWS as a preferred cloud and AI provider for tier-one retail chains that want integrated image recognition and analytics.
• Feb 2025 – Walmart Inc.: Walmart expanded its in-store computer vision program to an additional 2,500 stores across North America, using AI cameras for inventory checks, price accuracy, and shrink monitoring, covering nearly 70 percent of its regional footprint. This expansion improves Walmart’s cost position and raises the competitive bar for other big-box retailers considering similar investments.
• Apr 2025 – Microsoft Corporation: Microsoft introduced an updated version of its Azure Vision for Retail package that bundles pre-trained models for planogram compliance, queue analytics, and smart cart support, with early adopters reporting up to 20 percent faster store audits. This launch strengthens Azure’s role in helping enterprise retailers shorten time to deployment and standardize image recognition across markets.
• Jul 2025 – Alibaba Group: Alibaba’s retail arm rolled out an upgraded visual search and AI styling assistant across its Freshippo and Tmall Supermarket formats, claiming a 15 percent uplift in conversion for categories using image-based recommendations. This deployment enhances Alibaba’s position in Asia Pacific as a leading reference for image recognition at scale in both online and offline grocery.
• Sep 2025 – Trax Retail: Trax announced a strategic partnership with a leading European grocery group, valued at over USD 120 million, to implement computer vision shelf monitoring across more than 4,000 stores by 2027. The agreement consolidates Trax’s status as a specialist provider in image recognition for store execution and intensifies competitive pressure on generalist AI platforms in the European market.