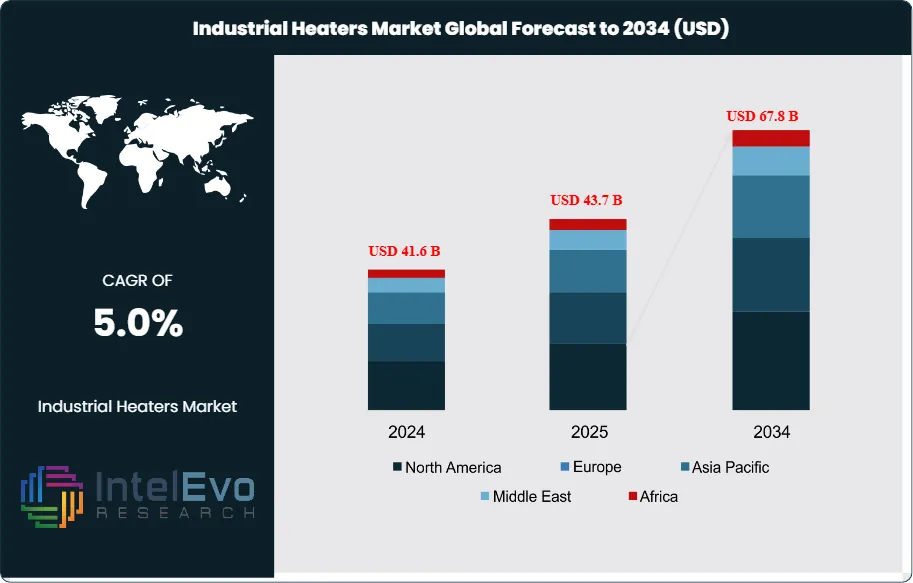
The Industrial Heaters Market is estimated at USD 41.6 billion in 2024 and is projected to reach approximately USD 67.8 billion by 2034, registering a compound annual growth rate (CAGR) of 5.0% over 2025–2034. This steady expansion reflects rising demand for precise thermal processing across chemicals, pharmaceuticals, metals, and food manufacturing, where temperature control directly impacts efficiency and product quality. The transition toward energy-efficient electric and hybrid heaters, driven by decarbonization targets and tightening emission regulations, is further supporting market momentum. In addition, growing adoption of smart and IoT-enabled heating systems for predictive maintenance and energy optimization is enhancing long-term growth visibility and reinforcing the market’s relevance across both mature and emerging industrial economies.
Industrial heaters form the backbone of thermal management in manufacturing, processing, and production environments. Their role spans across oil and gas, chemicals, automotive, and food processing, where precise temperature control and operational reliability are non-negotiable. The market has expanded steadily over the past decade, supported by industrialization in Asia-Pacific and modernization of facilities in North America and Europe. This trajectory is expected to continue as industries prioritize energy efficiency and regulatory compliance.
Growth is being driven by rising demand for energy-efficient heating systems and the global shift toward sustainable manufacturing. Retrofitting of older facilities with advanced heating solutions is accelerating adoption, while emerging economies are fueling demand through rapid industrial expansion. On the supply side, manufacturers face challenges around fluctuating raw material costs and the need to align with stricter emissions standards. However, government-backed incentives for clean energy adoption are mitigating these risks and creating new opportunities.
Technology is reshaping the market. Integration of IoT-enabled sensors allows predictive maintenance and real-time monitoring, reducing downtime and energy waste. Automation and AI-driven controls are improving process accuracy, while infrared and immersion heaters are gaining traction for their efficiency in high-demand environments. These advances are not only reducing operational costs but also aligning with global decarbonization goals.
Regional trends highlight clear investment hotspots. Asia-Pacific remains the largest market, driven by China and India’s expanding industrial base. Europe is advancing through regulatory mandates, with the UK allocating £530 million under the Public Sector Decarbonisation Scheme to replace outdated heating systems with low-carbon alternatives. This initiative alone is projected to save £650 million annually in energy costs by 2037. In the United States, over $545 million has been deployed across 39 states for clean energy projects, while training programs have prepared more than 200,000 workers for roles in the clean energy sector. These measures are reinforcing the ecosystem for industrial heating solutions and signaling long-term growth potential.
For investors and industry participants, the combination of regulatory support, technological progress, and rising demand for sustainable processes positions the industrial heaters market as a resilient and expanding opportunity over the coming decade.
Key Takeaways
Market Growth: The global industrial heaters market was valued at USD 41.6 billion in 2024 and is projected to reach USD 67.8 billion by 2034, expanding at a CAGR of 5.0%. Growth is supported by rising demand for energy-efficient heating systems and stricter regulatory frameworks promoting low-emission technologies.
Product Type: Immersion heaters accounted for 39% of total revenue in 2023, driven by their widespread use in chemical processing, oil and gas, and water treatment applications where direct fluid heating ensures efficiency and reliability.
Technology: Electric-based heaters held a 35% share in 2023, reflecting strong adoption in industries prioritizing precise temperature control and reduced maintenance costs compared with fuel-based alternatives.
End Use: The pharmaceutical sector represented 41% of demand in 2023, supported by stringent requirements for controlled heating environments in drug manufacturing and bioprocessing facilities.
Driver: Government-backed decarbonization programs are accelerating adoption. For example, the UK allocated £530 million under the Public Sector Decarbonisation Scheme to replace outdated heating systems, with projected annual energy savings of £650 million by 2037.
Restraint: Volatility in raw material prices, particularly metals used in heating elements, is pressuring margins. Rising input costs can increase equipment prices by 8–12% annually, limiting adoption in cost-sensitive industries.
Opportunity: Asia-Pacific presents significant growth potential, with industrial expansion in India and Southeast Asia expected to push regional demand at a CAGR above 5% through 2033. Investments in manufacturing hubs and energy-efficient infrastructure will sustain momentum.
Trend: Integration of IoT-enabled heaters is gaining traction, enabling predictive maintenance and real-time monitoring. Early adopters report energy savings of up to 15% and reduced downtime, making smart heating systems a priority for large-scale facilities.
Regional Analysis: Asia-Pacific led the market with a 34% share and USD 12.6 billion in revenue in 2023, supported by rapid industrialization. Europe is advancing through regulatory mandates, while North America benefits from federal clean energy investments exceeding USD 545 million across 39 states, reinforcing long-term adoption.
Type Analysis
As of 2025, immersion heaters continue to dominate the industrial heaters market, accounting for nearly 38–40% of total revenue. Their ability to deliver direct, efficient heat transfer into liquids makes them indispensable in sectors such as chemicals, oil and gas, and water treatment. The demand for immersion heaters is further supported by industries requiring precise temperature control and high reliability, particularly in continuous processing environments.
Pipe heaters and duct heaters represent the next largest categories, serving applications where targeted heating of fluids or airflows is essential. These systems are increasingly adopted in petrochemical and HVAC operations, where energy efficiency and safety are critical. Circulation heaters and cartridge heaters, while holding smaller shares, are gaining traction in compact industrial setups. Their adoption is expected to rise at a CAGR above 5% through 2030, supported by technological improvements that enhance durability and reduce maintenance costs.
The overall product mix reflects a shift toward solutions that balance efficiency with operational flexibility. While immersion heaters remain the backbone of the market, specialized heater types are carving out growth opportunities in industries with unique thermal management requirements.
Technology Analysis
Electric-based heaters remain the leading technology in 2025, holding more than one-third of the global market. Their dominance is reinforced by the global transition toward electrification and decarbonization, with industries prioritizing clean, consistent heating solutions. In sectors such as pharmaceuticals and food processing, electric heaters are preferred due to their ability to eliminate combustion byproducts and maintain contamination-free environments.
Fuel-based heaters continue to play a role in industries with high heat load requirements, particularly in regions where electricity costs remain prohibitive. Hybrid heaters, which combine electric and fuel-based systems, are gaining adoption as companies seek to balance energy efficiency with operational resilience. This segment is projected to expand at a CAGR of 6% through 2030, reflecting its appeal in industries undergoing gradual energy transitions.
Steam-based heaters, though representing a smaller share, remain critical in large-scale processing plants where steam is readily available as a byproduct. Their relevance is particularly strong in legacy industries such as pulp and paper, textiles, and heavy chemicals. The diversity of technology adoption highlights how industrial heating solutions are adapting to both environmental regulations and operational cost pressures.
End-Use Industry Analysis
Pharmaceuticals remain the largest end-use sector in 2025, accounting for more than 40% of global demand. Stringent requirements for temperature-controlled environments in drug formulation, storage, and bioprocessing continue to drive adoption. The sector’s reliance on precision heating solutions is reinforced by regulatory compliance standards and the expansion of biologics manufacturing.
The oil and gas industry follows as a major consumer, using industrial heaters in refining, petrochemical processing, and natural gas treatment. With global energy companies investing in efficiency upgrades, demand for high-capacity heaters in this sector remains strong. The food and beverages industry also represents a significant share, with heaters used in sterilization, pasteurization, and other thermal processes critical for product safety.
Automotive and other industrial sectors, while smaller in scale, are expanding their use of heaters in applications such as paint curing, component drying, and advanced materials processing. Collectively, these industries highlight the broad relevance of industrial heaters in ensuring operational efficiency, safety, and compliance across diverse production environments.
Regional Analysis
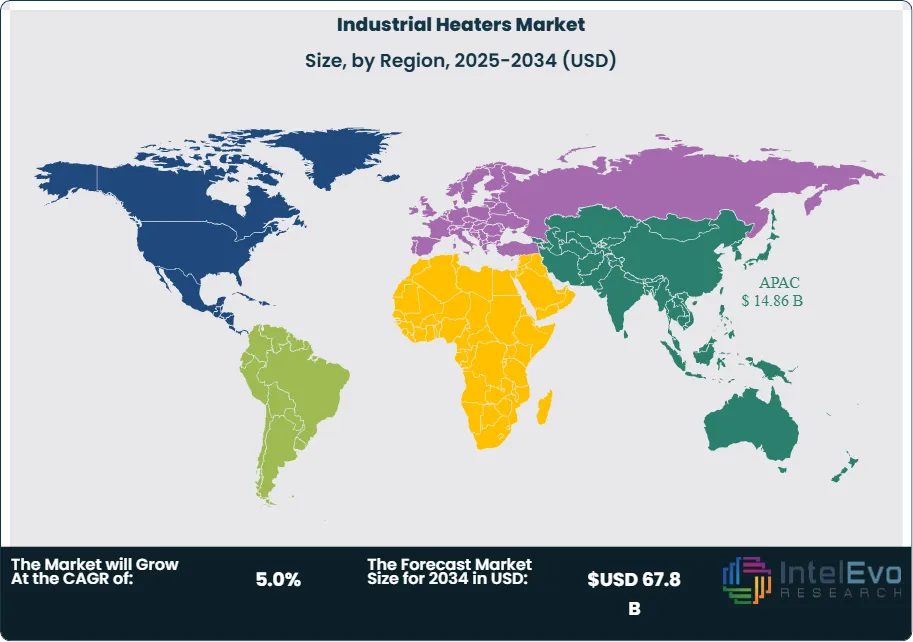
Asia-Pacific remains the largest regional market in 2025, accounting for more than one-third of global revenue, valued at over USD 14.86 billion. Growth is driven by rapid industrialization in China, India, and Southeast Asia, alongside rising investments in manufacturing and energy infrastructure. The region is expected to maintain a CAGR above 5% through 2030, supported by government-backed industrial expansion and energy efficiency initiatives.
North America continues to benefit from advanced manufacturing capabilities and strong regulatory frameworks promoting sustainable heating technologies. Federal and state-level clean energy programs are accelerating the adoption of electric-based heaters, particularly in pharmaceuticals and food processing. Europe, while a mature market, remains a leader in regulatory-driven adoption, with industries investing in low-carbon heating systems to meet stringent emissions targets.
The Middle East and Africa are witnessing steady growth, supported by the expansion of oil and gas operations and diversification strategies that emphasize energy efficiency in industrial processes. Latin America, though smaller in scale, is experiencing rising demand as modernization efforts in Brazil and Mexico drive adoption of advanced heating technologies. Collectively, these regional dynamics underscore a global market that is both expanding and diversifying, with Asia-Pacific setting the pace for long-term growth.
By Product Type, (Pipe Heaters, Immersion Heaters, Duct Heaters, Circulation Heaters, Cartridge Heaters,) By Technology, (Electric-based, Fuel-based, Hybrid-based, Steam-based), By End-Use Industry, (Pharmaceuticals, Oil & Gas, Food & Beverages, Automotive, Other End-Use Industries)
Research Methodology
Primary Research- 100 Interviews of Stakeholders
Secondary Research
Desk Research
Regional scope
North America (United States, Canada, Mexico)
Latin America (Brazil, Argentina, Columbia)
East Asia And Pacific (China, Japan, South Korea, Australia, Cambodia, Fiji, Indonesia)
Sea And South Asia (India, Singapore, Thailand, Taiwan, Malaysia)
Eastern Europe (Poland, Russia, Czech Republic, Romania)
Western Europe (Germany, U.K., France, Spain, Itlay)
Middle East & Africa (GCC Countries, Egypt, Nigeria, South Africa, Israel)
Competitive Landscape
Chromalox, Powrmatic Ltd., Dragon Power Electric Co. Ltd., Elmatic Ltd., Winterwarm, Watlow Electric Manufacturing Company, Auzhan Electric Appliances Co. Ltd., Thermal Flow Technologies, Wattco, Other Key Players
Customization Scope
Customization for segments, region/country-level will be provided. Moreover, additional customization can be done based on the requirements.
Pricing and Purchase Options
Avail customized purchase options to meet your exact research needs. We have three licenses to opt for: Single User License, Multi-User License (Up to 5 Users), Corporate Use License (Unlimited User and Printable PDF).
TABLE OF CONTENTS
1. EXECUTIVE SUMMARY
1.1. MARKET SNAPSHOT
1.2. KEY FINDINGS & INSIGHTS
1.3. ANALYST RECOMMENDATIONS
1.4. FUTURE OUTLOOK
2. RESEARCH METHODOLOGY
2.1. MARKET DEFINITION & SCOPE
2.2. RESEARCH OBJECTIVES: PRIMARY & SECONDARY DATA SOURCES
2.3. DATA COLLECTION SOURCES
2.3.1. COVERAGE OF 100+ PRIMARY RESEARCH/CONSULTATION CALLS WITH INDUSTRY STAKEHOLDERS
FIGURE 17 NORTH AMERICA INDUSTRIAL HEATERS CURRENT AND FUTURE TYPE ANALYSIS, 2025–2034, (USD MILLION)
FIGURE 18 NORTH AMERICA INDUSTRIAL HEATERS CURRENT AND FUTURE END USER ANALYSIS, 2025–2034, (USD MILLION)
FIGURE 19 MARKET SHARE BY COUNTRY
FIGURE 20 LATIN AMERICA INDUSTRIAL HEATERS CURRENT AND FUTURE TYPE ANALYSIS, 2025–2034, (USD MILLION)
FIGURE 21 LATIN AMERICA INDUSTRIAL HEATERS CURRENT AND FUTURE END USER ANALYSIS, 2025–2034, (USD MILLION)
FIGURE 22 MARKET SHARE BY COUNTRY
FIGURE 23 EASTERN EUROPE INDUSTRIAL HEATERS CURRENT AND FUTURE TYPE ANALYSIS, 2025–2034, (USD MILLION)
FIGURE 24 EASTERN EUROPE INDUSTRIAL HEATERS CURRENT AND FUTURE END USER ANALYSIS, 2025–2034, (USD MILLION)
FIGURE 25 MARKET SHARE BY COUNTRY
FIGURE 26 WESTERN EUROPE INDUSTRIAL HEATERS CURRENT AND FUTURE TYPE ANALYSIS, 2025–2034, (USD MILLION)
FIGURE 27 WESTERN EUROPE INDUSTRIAL HEATERS CURRENT AND FUTURE END USER ANALYSIS, 2025–2034, (USD MILLION)
FIGURE 28 MARKET SHARE BY COUNTRY
FIGURE 29 EAST ASIA AND PACIFIC INDUSTRIAL HEATERS CURRENT AND FUTURE TYPE ANALYSIS, 2025–2034, (USD MILLION)
FIGURE 30 EAST ASIA AND PACIFIC INDUSTRIAL HEATERS CURRENT AND FUTURE END USER ANALYSIS, 2025–2034, (USD MILLION)
FIGURE 31 MARKET SHARE BY COUNTRY
FIGURE 32 SEA AND SOUTH ASIA INDUSTRIAL HEATERS CURRENT AND FUTURE TYPE ANALYSIS, 2025–2034, (USD MILLION)
FIGURE 33 SEA AND SOUTH ASIA INDUSTRIAL HEATERS CURRENT AND FUTURE END USER ANALYSIS, 2025–2034, (USD MILLION)
FIGURE 34 MARKET SHARE BY COUNTRY
FIGURE 35 MIDDLE EAST AND AFRICA INDUSTRIAL HEATERS CURRENT AND FUTURE TYPE ANALYSIS, 2025–2034, (USD MILLION)
FIGURE 36 MIDDLE EAST AND AFRICA INDUSTRIAL HEATERS CURRENT AND FUTURE END USER ANALYSIS, 2025–2034, (USD MILLION)
FIGURE 37 NORTH AMERICA INDUSTRIAL HEATERS CURRENT AND FUTURE MARKET VOLUME SHARE REGIONAL ANALYSIS, 2025–2034, (USD MILLION)
FIGURE 38 U.S. INDUSTRIAL HEATERS CURRENT AND FUTURE TYPE ANALYSIS, 2025–2034, (USD MILLION)
FIGURE 39 U.S. INDUSTRIAL HEATERS CURRENT AND FUTURE END USER ANALYSIS, 2025–2034, (USD MILLION)
FIGURE 40 CANADA INDUSTRIAL HEATERS CURRENT AND FUTURE TYPE ANALYSIS, 2025–2034, (USD MILLION)
FIGURE 41 CANADA INDUSTRIAL HEATERS CURRENT AND FUTURE END USER ANALYSIS, 2025–2034, (USD MILLION)
FIGURE 42 LATIN AMERICA INDUSTRIAL HEATERS CURRENT AND FUTURE MARKET VOLUME SHARE REGIONAL ANALYSIS, 2025–2034, (USD MILLION)
FIGURE 43 MEXICO INDUSTRIAL HEATERS CURRENT AND FUTURE TYPE ANALYSIS, 2025–2034, (USD MILLION)
FIGURE 44 MEXICO INDUSTRIAL HEATERS CURRENT AND FUTURE END USER ANALYSIS, 2025–2034, (USD MILLION)
FIGURE 45 BRAZIL INDUSTRIAL HEATERS CURRENT AND FUTURE TYPE ANALYSIS, 2025–2034, (USD MILLION)
FIGURE 46 BRAZIL INDUSTRIAL HEATERS CURRENT AND FUTURE END USER ANALYSIS, 2025–2034, (USD MILLION)
FIGURE 47 ARGENTINA INDUSTRIAL HEATERS CURRENT AND FUTURE TYPE ANALYSIS, 2025–2034, (USD MILLION)
FIGURE 48 ARGENTINA INDUSTRIAL HEATERS CURRENT AND FUTURE END USER ANALYSIS, 2025–2034, (USD MILLION)
FIGURE 49 COLUMBIA INDUSTRIAL HEATERS CURRENT AND FUTURE TYPE ANALYSIS, 2025–2034, (USD MILLION)
FIGURE 50 COLUMBIA INDUSTRIAL HEATERS CURRENT AND FUTURE END USER ANALYSIS, 2025–2034, (USD MILLION)
FIGURE 51 REST OF LATIN AMERICA INDUSTRIAL HEATERS CURRENT AND FUTURE TYPE ANALYSIS, 2025–2034, (USD MILLION)
FIGURE 52 REST OF LATIN AMERICA INDUSTRIAL HEATERS CURRENT AND FUTURE END USER ANALYSIS, 2025–2034, (USD MILLION)
FIGURE 53 EASTERN EUROPE INDUSTRIAL HEATERS CURRENT AND FUTURE MARKET VOLUME SHARE REGIONAL ANALYSIS, 2025–2034, (USD MILLION)
FIGURE 54 POLAND INDUSTRIAL HEATERS CURRENT AND FUTURE TYPE ANALYSIS, 2025–2034, (USD MILLION)
FIGURE 55 POLAND INDUSTRIAL HEATERS CURRENT AND FUTURE END USER ANALYSIS, 2025–2034, (USD MILLION)
FIGURE 56 RUSSIA INDUSTRIAL HEATERS CURRENT AND FUTURE TYPE ANALYSIS, 2025–2034, (USD MILLION)
FIGURE 57 RUSSIA INDUSTRIAL HEATERS CURRENT AND FUTURE END USER ANALYSIS, 2025–2034, (USD MILLION)
FIGURE 58 CZECH REPUBLIC INDUSTRIAL HEATERS CURRENT AND FUTURE TYPE ANALYSIS, 2025–2034, (USD MILLION)
FIGURE 59 CZECH REPUBLIC INDUSTRIAL HEATERS CURRENT AND FUTURE END USER ANALYSIS, 2025–2034, (USD MILLION)
FIGURE 60 ROMANIA INDUSTRIAL HEATERS CURRENT AND FUTURE TYPE ANALYSIS, 2025–2034, (USD MILLION)
FIGURE 61 ROMANIA INDUSTRIAL HEATERS CURRENT AND FUTURE END USER ANALYSIS, 2025–2034, (USD MILLION)
FIGURE 62 REST OF EASTERN EUROPE INDUSTRIAL HEATERS CURRENT AND FUTURE TYPE ANALYSIS, 2025–2034, (USD MILLION)
FIGURE 63 REST OF EASTERN EUROPE INDUSTRIAL HEATERS CURRENT AND FUTURE END USER ANALYSIS, 2025–2034, (USD MILLION)
FIGURE 64 WESTERN EUROPE INDUSTRIAL HEATERS CURRENT AND FUTURE MARKET VOLUME SHARE REGIONAL ANALYSIS, 2025–2034, (USD MILLION)
FIGURE 65 GERMANY INDUSTRIAL HEATERS CURRENT AND FUTURE TYPE ANALYSIS, 2025–2034, (USD MILLION)
FIGURE 66 GERMANY INDUSTRIAL HEATERS CURRENT AND FUTURE END USER ANALYSIS, 2025–2034, (USD MILLION)
FIGURE 67 FRANCE INDUSTRIAL HEATERS CURRENT AND FUTURE TYPE ANALYSIS, 2025–2034, (USD MILLION)
FIGURE 68 FRANCE INDUSTRIAL HEATERS CURRENT AND FUTURE END USER ANALYSIS, 2025–2034, (USD MILLION)
FIGURE 69 UK INDUSTRIAL HEATERS CURRENT AND FUTURE TYPE ANALYSIS, 2025–2034, (USD MILLION)
FIGURE 70 UK INDUSTRIAL HEATERS CURRENT AND FUTURE END USER ANALYSIS, 2025–2034, (USD MILLION)
FIGURE 71 SPAIN INDUSTRIAL HEATERS CURRENT AND FUTURE TYPE ANALYSIS, 2025–2034, (USD MILLION)
FIGURE 72 SPAIN INDUSTRIAL HEATERS CURRENT AND FUTURE END USER ANALYSIS, 2025–2034, (USD MILLION)
FIGURE 73 ITALY INDUSTRIAL HEATERS CURRENT AND FUTURE TYPE ANALYSIS, 2025–2034, (USD MILLION)
FIGURE 74 ITALY INDUSTRIAL HEATERS CURRENT AND FUTURE END USER ANALYSIS, 2025–2034, (USD MILLION)
FIGURE 75 REST OF WESTERN EUROPE INDUSTRIAL HEATERS CURRENT AND FUTURE TYPE ANALYSIS, 2025–2034, (USD MILLION)
FIGURE 76 REST OF WESTERN EUROPE INDUSTRIAL HEATERS CURRENT AND FUTURE END USER ANALYSIS, 2025–2034, (USD MILLION)
FIGURE 77 EAST ASIA AND PACIFIC INDUSTRIAL HEATERS CURRENT AND FUTURE MARKET VOLUME SHARE REGIONAL ANALYSIS, 2025–2034, (USD MILLION)
FIGURE 78 CHINA INDUSTRIAL HEATERS CURRENT AND FUTURE TYPE ANALYSIS, 2025–2034, (USD MILLION)
FIGURE 79 CHINA INDUSTRIAL HEATERS CURRENT AND FUTURE END USER ANALYSIS, 2025–2034, (USD MILLION)
FIGURE 80 JAPAN INDUSTRIAL HEATERS CURRENT AND FUTURE TYPE ANALYSIS, 2025–2034, (USD MILLION)
FIGURE 81 JAPAN INDUSTRIAL HEATERS CURRENT AND FUTURE END USER ANALYSIS, 2025–2034, (USD MILLION)
FIGURE 82 AUSTRALIA INDUSTRIAL HEATERS CURRENT AND FUTURE TYPE ANALYSIS, 2025–2034, (USD MILLION)
FIGURE 83 AUSTRALIA INDUSTRIAL HEATERS CURRENT AND FUTURE END USER ANALYSIS, 2025–2034, (USD MILLION)
FIGURE 84 CAMBODIA INDUSTRIAL HEATERS CURRENT AND FUTURE TYPE ANALYSIS, 2025–2034, (USD MILLION)
FIGURE 85 CAMBODIA INDUSTRIAL HEATERS CURRENT AND FUTURE END USER ANALYSIS, 2025–2034, (USD MILLION)
FIGURE 86 FIJI INDUSTRIAL HEATERS CURRENT AND FUTURE TYPE ANALYSIS, 2025–2034, (USD MILLION)
FIGURE 87 FIJI INDUSTRIAL HEATERS CURRENT AND FUTURE END USER ANALYSIS, 2025–2034, (USD MILLION)
FIGURE 88 INDONESIA INDUSTRIAL HEATERS CURRENT AND FUTURE TYPE ANALYSIS, 2025–2034, (USD MILLION)
FIGURE 89 INDONESIA INDUSTRIAL HEATERS CURRENT AND FUTURE END USER ANALYSIS, 2025–2034, (USD MILLION)
FIGURE 90 SOUTH KOREA INDUSTRIAL HEATERS CURRENT AND FUTURE TYPE ANALYSIS, 2025–2034, (USD MILLION)
FIGURE 91 SOUTH KOREA INDUSTRIAL HEATERS CURRENT AND FUTURE END USER ANALYSIS, 2025–2034, (USD MILLION)
FIGURE 92 REST OF EAST ASIA AND PACIFIC INDUSTRIAL HEATERS CURRENT AND FUTURE TYPE ANALYSIS, 2025–2034, (USD MILLION)
FIGURE 93 REST OF EAST ASIA AND PACIFIC INDUSTRIAL HEATERS CURRENT AND FUTURE END USER ANALYSIS, 2025–2034, (USD MILLION)
FIGURE 94 SEA AND SOUTH ASIA INDUSTRIAL HEATERS CURRENT AND FUTURE MARKET VOLUME SHARE REGIONAL ANALYSIS, 2025–2034, (USD MILLION)
FIGURE 95 BANGLADESH INDUSTRIAL HEATERS CURRENT AND FUTURE TYPE ANALYSIS, 2025–2034, (USD MILLION)
FIGURE 96 BANGLADESH INDUSTRIAL HEATERS CURRENT AND FUTURE END USER ANALYSIS, 2025–2034, (USD MILLION)
FIGURE 97 NEW ZEALAND INDUSTRIAL HEATERS CURRENT AND FUTURE TYPE ANALYSIS, 2025–2034, (USD MILLION)
FIGURE 98 NEW ZEALAND INDUSTRIAL HEATERS CURRENT AND FUTURE END USER ANALYSIS, 2025–2034, (USD MILLION)
FIGURE 99 INDIA INDUSTRIAL HEATERS CURRENT AND FUTURE TYPE ANALYSIS, 2025–2034, (USD MILLION)
FIGURE 100 INDIA INDUSTRIAL HEATERS CURRENT AND FUTURE END USER ANALYSIS, 2025–2034, (USD MILLION)
FIGURE 101 SINGAPORE INDUSTRIAL HEATERS CURRENT AND FUTURE TYPE ANALYSIS, 2025–2034, (USD MILLION)
FIGURE 102 SINGAPORE INDUSTRIAL HEATERS CURRENT AND FUTURE END USER ANALYSIS, 2025–2034, (USD MILLION)
FIGURE 103 THAILAND INDUSTRIAL HEATERS CURRENT AND FUTURE TYPE ANALYSIS, 2025–2034, (USD MILLION)
FIGURE 104 THAILAND INDUSTRIAL HEATERS CURRENT AND FUTURE END USER ANALYSIS, 2025–2034, (USD MILLION)
FIGURE 105 TAIWAN INDUSTRIAL HEATERS CURRENT AND FUTURE TYPE ANALYSIS, 2025–2034, (USD MILLION)
FIGURE 106 TAIWAN INDUSTRIAL HEATERS CURRENT AND FUTURE END USER ANALYSIS, 2025–2034, (USD MILLION)
FIGURE 107 MALAYSIA INDUSTRIAL HEATERS CURRENT AND FUTURE TYPE ANALYSIS, 2025–2034, (USD MILLION)
FIGURE 108 MALAYSIA INDUSTRIAL HEATERS CURRENT AND FUTURE END USER ANALYSIS, 2025–2034, (USD MILLION)
FIGURE 109 REST OF SEA AND SOUTH ASIA INDUSTRIAL HEATERS CURRENT AND FUTURE TYPE ANALYSIS, 2025–2034, (USD MILLION)
FIGURE 110 REST OF SEA AND SOUTH ASIA INDUSTRIAL HEATERS CURRENT AND FUTURE END USER ANALYSIS, 2025–2034, (USD MILLION)
FIGURE 111 MIDDLE EAST AND AFRICA INDUSTRIAL HEATERS CURRENT AND FUTURE MARKET VOLUME SHARE REGIONAL ANALYSIS, 2025–2034, (USD MILLION)
FIGURE 112 GCC COUNTRIES INDUSTRIAL HEATERS CURRENT AND FUTURE TYPE ANALYSIS, 2025–2034, (USD MILLION)
FIGURE 113 GCC COUNTRIES INDUSTRIAL HEATERS CURRENT AND FUTURE END USER ANALYSIS, 2025–2034, (USD MILLION)
FIGURE 114 SAUDI ARABIA INDUSTRIAL HEATERS CURRENT AND FUTURE TYPE ANALYSIS, 2025–2034, (USD MILLION)
FIGURE 115 SAUDI ARABIA INDUSTRIAL HEATERS CURRENT AND FUTURE END USER ANALYSIS, 2025–2034, (USD MILLION)
FIGURE 116 UAE INDUSTRIAL HEATERS CURRENT AND FUTURE TYPE ANALYSIS, 2025–2034, (USD MILLION)
FIGURE 117 UAE INDUSTRIAL HEATERS CURRENT AND FUTURE END USER ANALYSIS, 2025–2034, (USD MILLION)
FIGURE 118 BAHRAIN INDUSTRIAL HEATERS CURRENT AND FUTURE TYPE ANALYSIS, 2025–2034, (USD MILLION)
FIGURE 119 BAHRAIN INDUSTRIAL HEATERS CURRENT AND FUTURE END USER ANALYSIS, 2025–2034, (USD MILLION)
FIGURE 120 KUWAIT INDUSTRIAL HEATERS CURRENT AND FUTURE TYPE ANALYSIS, 2025–2034, (USD MILLION)
FIGURE 121 KUWAIT INDUSTRIAL HEATERS CURRENT AND FUTURE END USER ANALYSIS, 2025–2034, (USD MILLION)
FIGURE 122 OMAN INDUSTRIAL HEATERS CURRENT AND FUTURE TYPE ANALYSIS, 2025–2034, (USD MILLION)
FIGURE 123 OMAN INDUSTRIAL HEATERS CURRENT AND FUTURE END USER ANALYSIS, 2025–2034, (USD MILLION)
FIGURE 124 QATAR INDUSTRIAL HEATERS CURRENT AND FUTURE TYPE ANALYSIS, 2025–2034, (USD MILLION)
FIGURE 125 QATAR INDUSTRIAL HEATERS CURRENT AND FUTURE END USER ANALYSIS, 2025–2034, (USD MILLION)
FIGURE 126 EGYPT INDUSTRIAL HEATERS CURRENT AND FUTURE TYPE ANALYSIS, 2025–2034, (USD MILLION)
FIGURE 127 EGYPT INDUSTRIAL HEATERS CURRENT AND FUTURE END USER ANALYSIS, 2025–2034, (USD MILLION)
FIGURE 128 NIGERIA INDUSTRIAL HEATERS CURRENT AND FUTURE TYPE ANALYSIS, 2025–2034, (USD MILLION)
FIGURE 129 NIGERIA INDUSTRIAL HEATERS CURRENT AND FUTURE END USER ANALYSIS, 2025–2034, (USD MILLION)
FIGURE 130 SOUTH AFRICA INDUSTRIAL HEATERS CURRENT AND FUTURE TYPE ANALYSIS, 2025–2034, (USD MILLION)
FIGURE 131 SOUTH AFRICA INDUSTRIAL HEATERS CURRENT AND FUTURE END USER ANALYSIS, 2025–2034, (USD MILLION)
FIGURE 132 ISRAEL INDUSTRIAL HEATERS CURRENT AND FUTURE TYPE ANALYSIS, 2025–2034, (USD MILLION)
FIGURE 133 ISRAEL INDUSTRIAL HEATERS CURRENT AND FUTURE END USER ANALYSIS, 2025–2034, (USD MILLION)
FIGURE 134 REST OF MEA INDUSTRIAL HEATERS CURRENT AND FUTURE TYPE ANALYSIS, 2025–2034, (USD MILLION)
FIGURE 135 REST OF MEA INDUSTRIAL HEATERS CURRENT AND FUTURE END USER ANALYSIS, 2025–2034, (USD MILLION)
FIGURE 136 U. S. MARKET SHARE ANALYSIS BY TYPE (2024)
FIGURE 137 U. S. MARKET SHARE ANALYSIS BY END USER (2024)
FIGURE 138 CANADA MARKET SHARE ANALYSIS BY TYPE (2024)
FIGURE 139 CANADA MARKET SHARE ANALYSIS BY END USER (2024)
FIGURE 140 MEXICO MARKET SHARE ANALYSIS BY TYPE (2024)
FIGURE 141 MEXICO MARKET SHARE ANALYSIS BY END USER (2024)
FIGURE 142 CHINA MARKET SHARE ANALYSIS BY TYPE (2024)
FIGURE 143 CHINA MARKET SHARE ANALYSIS BY END USER (2024)
FIGURE 144 JAPAN MARKET SHARE ANALYSIS BY TYPE (2024)
FIGURE 145 JAPAN MARKET SHARE ANALYSIS BY END USER (2024)
FIGURE 146 INDIA MARKET SHARE ANALYSIS BY TYPE (2024)
FIGURE 147 INDIA MARKET SHARE ANALYSIS BY END USER (2024)
FIGURE 148 SOUTH KOREA MARKET SHARE ANALYSIS BY TYPE (2024)
FIGURE 149 SOUTH KOREA MARKET SHARE ANALYSIS BY END USER (2024)
FIGURE 150 SAUDI ARABIA MARKET SHARE ANALYSIS BY TYPE (2024)
FIGURE 151 SAUDI ARABIA MARKET SHARE ANALYSIS BY END USER (2024)
FIGURE 152 UAE MARKET SHARE ANALYSIS BY TYPE (2024)
FIGURE 153 UAE MARKET SHARE ANALYSIS BY END USER (2024)
FIGURE 154 EGYPT MARKET SHARE ANALYSIS BY TYPE (2024)
FIGURE 155 EGYPT MARKET SHARE ANALYSIS BY END USER (2024)
FIGURE 156 NIGERIA MARKET SHARE ANALYSIS BY TYPE (2024)
FIGURE 157 NIGERIA MARKET SHARE ANALYSIS BY END USER (2024)
FIGURE 158 SOUTH AFRICA MARKET SHARE ANALYSIS BY TYPE (2024)
FIGURE 159 SOUTH AFRICA MARKET SHARE ANALYSIS BY END USER (2024)
FIGURE 160 GERMANY MARKET SHARE ANALYSIS BY TYPE (2024)
FIGURE 161 GERMANY MARKET SHARE ANALYSIS BY END USER (2024)
FIGURE 162 FRANCE MARKET SHARE ANALYSIS BY TYPE (2024)
FIGURE 163 FRANCE MARKET SHARE ANALYSIS BY END USER (2024)
FIGURE 164 UK MARKET SHARE ANALYSIS BY TYPE (2024)
FIGURE 165 UK MARKET SHARE ANALYSIS BY END USER (2024)
FIGURE 166 SPAIN MARKET SHARE ANALYSIS BY TYPE (2024)
FIGURE 167 SPAIN MARKET SHARE ANALYSIS BY END USER (2024)
FIGURE 168 ITALY MARKET SHARE ANALYSIS BY TYPE (2024)
FIGURE 169 ITALY MARKET SHARE ANALYSIS BY END USER (2024)
FIGURE 170 BRAZIL MARKET SHARE ANALYSIS BY TYPE (2024)
FIGURE 171 BRAZIL MARKET SHARE ANALYSIS BY END USER (2024)
FIGURE 172 ARGENTINA MARKET SHARE ANALYSIS BY TYPE (2024)
FIGURE 173 ARGENTINA MARKET SHARE ANALYSIS BY END USER (2024)
FIGURE 174 COLUMBIA MARKET SHARE ANALYSIS BY TYPE (2024)
FIGURE 175 COLUMBIA MARKET SHARE ANALYSIS BY END USER (2024)
FIGURE 176 GLOBAL INDUSTRIAL HEATERS CURRENT AND FUTURE MARKET KEY COUNTRY LEVEL ANALYSIS, 2024–2034, (USD MILLION)
FIGURE 177 FINANCIAL OVERVIEW:
Key Player Analysis
Watlow Electric Manufacturing Company: Leader. Watlow provides electric process heaters, thermal systems, sensors, and controls for high-spec environments, including semiconductors, pharmaceuticals, chemicals, and energy. Its portfolio spans immersion, circulation, and high-performance inline heaters, paired with advanced control platforms for closed-loop thermal management. Since acquiring Eurotherm, Watlow has expanded integrated controls and analytics across its installed base, pushing connected systems in new projects. The company reports strong growth in AI-enabled monitoring and predictive maintenance, with smart deployments representing an estimated 25–30% of new installations in 2025. You see clear differentiation in custom engineering, materials science, and system-level design, which supports premium pricing and lifecycle service revenues.
Strategically, Watlow is investing in electrification and decarbonization programs with end users in bioprocessing and advanced materials. The firm’s backlog is weighted toward high-efficiency electric solutions, which account for more than 80% of its project pipeline. Regional strength in North America and Europe is complemented by growing Asia Pacific demand in semiconductor fabs and life sciences facilities. This mix positions Watlow to capture mid-to-high single-digit CAGR through 2030, supported by retrofit cycles and regulatory-driven upgrades.
Wattco: Challenger. Wattco focuses on electric heaters across immersion, duct, circulation, and flanged configurations, targeting general industrial, food processing, and water treatment. The company differentiates through rapid quoting, short lead times, and standardized product lines that lower total cost of ownership for mid-market buyers. In 2025, Wattco’s digital order management and configurable catalogs have raised conversion rates, with online-driven sales estimated to exceed 35% of bookings.
Strategic priorities center on North American expansion, e-commerce enablement, and upgrades to control interfaces to meet stricter efficiency requirements. Wattco’s pricing discipline and fast-turn manufacturing win retrofit projects where capex is tightly managed. The firm’s competitive position improves as customers shift from fuel-based to electric systems, with electric units accounting for more than 90% of shipments. Expect continued share gains in cost-sensitive applications and small-to-mid plant upgrades.
Elmatic Ltd.: Niche player. Elmatic specializes in cartridge, mica band, ceramic band, strip, and bespoke heater assemblies, serving UK and European OEMs and maintenance operations. Its strength lies in custom builds, small-batch production, and tight tolerances for packaging, plastics, and light industrial machinery. In 2025, custom and semi-standard products represent the majority of revenue, with repeat OEM customers driving stable order flow.
The company’s differentiators include engineering-to-order capability, short lead times, and competitive pricing in specialized formats. Elmatic’s strategy focuses on expanding precision cartridge and band heater lines for automated equipment, along with incremental investments in digital configuration tools. While growth is measured, the firm benefits from European regulatory pressure favoring efficient electric heating. Expect steady low-to-mid single-digit CAGR tied to OEM programs and aftermarket replacement cycles.
Chromalox: Leader. Chromalox offers comprehensive electric heating and control solutions, including immersion and circulation heaters, heat transfer systems, thermal fluid skids, and heat tracing. Its process heating portfolio serves oil and gas, chemicals, power, and food processing, with strong project execution in high-capacity applications. In 2025, electric-based systems comprise the vast majority of revenues, aligned with industrial electrification and decarbonization targets.
Chromalox is expanding engineered systems and digital controls, integrating condition monitoring and energy management across large installations. Partnerships with EPCs and end users have increased multi-year service contracts and lifecycle upgrades. The company’s global footprint, backed by established distribution in North America and Europe and growing activity in the Middle East, supports resilient backlog and mid-single-digit revenue growth. You should watch Chromalox’s role in electrified process heat and heat tracing projects, where compliance, reliability, and total system integration drive competitive advantage.
MarketKey Players
Chromalox
Powrmatic Ltd.
Dragon Power Electric Co. Ltd.
Elmatic Ltd.
Winterwarm
Watlow Electric Manufacturing Company
Auzhan Electric Appliances Co. Ltd.
Thermal Flow Technologies
Wattco
Other Key Players
Driver:
Rising Demand for Precision Thermal Management
By 2025, the need for industrial heaters is growing rapidly in manufacturing, oil and gas, chemicals, and pharmaceuticals. In these sectors, precise thermal control is crucial for process efficiency and product quality. The market, valued at USD 39 billion in 2024, is steadily expanding as industries scale high-intensity operations that need consistent and reliable heat delivery. Sectors like chemicals and pharmaceuticals increasingly depend on advanced heaters to maintain strict temperature tolerances. This support enhances safety, optimizes yield, and ensures compliance with regulations.
Shift Toward Energy-Efficient and Low-Carbon Systems
Energy efficiency and decarbonization goals are boosting this growth. Industries are replacing older systems with electric and hybrid heaters, which can cut energy use by 10 to 15% per unit. Compact, high-performance designs are becoming standard in new installations, especially in areas with strict carbon regulations. For investors, this move toward cleaner and more efficient heating technologies shows lasting demand that aligns with long-term sustainability plans.
Restraint:
High Compliance and Capital Costs
Strict environmental regulations pose a major hurdle to market growth. Meeting emission standards and energy-efficiency requirements often demands significant upfront investments in advanced heating systems. For small and mid-sized companies, these costs can be overwhelming, especially when next-generation heaters cost 20 to 30% more than traditional options.
Competitive Pressure from Alternative Technologies
The increasing use of alternative heating methods, like induction and infrared technologies, is raising competitive pressure. These systems can offer faster heating cycles and lower operating costs in specific applications, which slows down the need to replace traditional industrial heaters. Together, the cost of regulations and growing competition are tightening margins, pushing manufacturers to balance innovation, pricing, and compliance carefully.
Opportunity:
Industrial Expansion in Emerging Economies
Emerging markets hold the greatest growth potential over the next decade. Rapid industrial growth in Asia-Pacific, Latin America, and parts of the Middle East is driving the demand for reliable and efficient heating systems. Asia-Pacific is expected to exceed USD 15 billion in market value by 2030, supported by investments in chemicals, metals, and pharmaceutical manufacturing.
Adoption of Smart and Connected Heating Systems
The use of IoT-enabled heaters is creating new opportunities for manufacturers and users. Smart heaters that support predictive maintenance and real-time performance tracking help facilities cut downtime and energy costs by up to 20%. Government incentives for energy-efficient equipment, especially in India and China, are speeding up adoption and strengthening the case for advanced industrial heaters.
Trend:
Growth of Smart and Sustainable Heating Technologies
Smart and sustainable solutions are changing the industrial heater market in 2025. IoT-enabled systems now make up nearly 18% of new installations, marking a shift toward connected, data-driven manufacturing settings. These heaters allow for real-time optimization of energy use, linking operational efficiency with sustainability aims.
Customization and High-Efficiency Heating Solutions
At the same time, there is growing demand for customized heater designs tailored to specific applications, such as biopharmaceutical production, advanced materials processing, and food manufacturing. Infrared heaters and ultra-efficient heat pump systems are becoming more popular due to their ability to deliver faster heating cycles with lower energy consumption. Together, these trends are establishing smart, customized, and eco-efficient heaters as standards for future industrial use.
Recent Developments
Dec 2024 – Watlow Electric Manufacturing Co.: The company announced the release of its new line of LEGACY SERIES smart circulation heaters, featuring integrated IoT controls for remote monitoring and predictive maintenance. The new systems are designed to improve thermal efficiency by up to 15% compared to previous models. This launch positions Watlow to meet growing demand from the chemical and energy sectors for automated and energy-conscious process heating solutions.
Feb 2025 – Laars Heating Systems: The company finalized its acquisition of Electro Industries, Inc., a specialist in electric heating technologies. The deal broadens Laars' product offerings for commercial and industrial applications across North America. This strategic purchase directly addresses shifting regulations and market demand for electrification in the heating sector.
Apr 2025 – Siemens AG: The company announced an investment of over $75 million to expand its industrial heater production capacity in the Asia-Pacific region, with a new facility planned in India. The expansion aims to serve the region's rapidly growing manufacturing, chemical, and electronics industries. This move strengthens Siemens' regional supply chain and ability to deliver specialized heating solutions to high-growth Asian markets.
Jul 2025 – Carver Group: The firm completed its acquisition of Powrmatic Limited, a prominent UK-based manufacturer of industrial HVAC equipment. The acquisition adds a fourth production plant and is expected to increase Carver’s manufacturing output by over 25%. This action solidifies the Carver Group's standing in the European HVAC market and expands its portfolio for international export.
Sep 2025 – Honeywell International, Inc.: Honeywell introduced a new portfolio of hybrid industrial heating systems designed to help facilities transition to low-carbon energy sources. The systems are engineered to help clients utilize new U.S. federal clean energy incentives, which amount to $235 billion in funding for domestic manufacturing. This initiative gives customers a flexible and cost-effective solution for decarbonization, positioning Honeywell as a key partner in the industrial energy transition.