Industrial PC Market Size, Trends, Growth outlook | CAGR of 6.9%
Global Industrial PC Market Size, Share, Analysis Report By Product Type (Panel IPC, Box IPC, Embedded IPC, Rack Mount IPC, DIN Rail IPC) Display Type (Capacitive, Resistive) Storage Medium (Solid State, Rotating) End-Use Industry (Manufacturing, Automotive, Aerospace & Defense, Semiconductor & Electronics, Energy & Power) Industry Region & Key Players-Industry Segment Overview, Market Dynamics, Competitive Strategies, Trends & Forecast 2025-2034
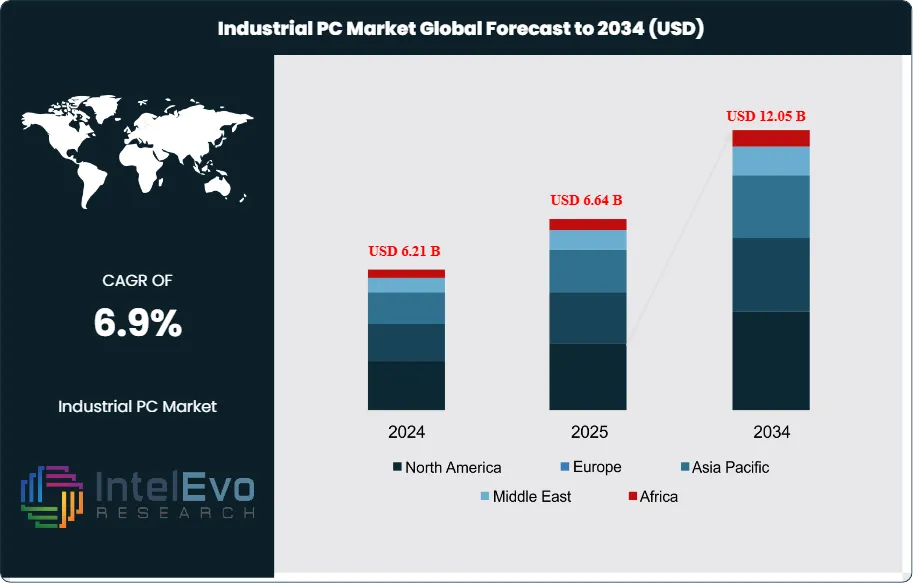
The Industrial PC Market is projected to reach approximately USD 12.05 Billion by 2034, up from USD 6.21 Billion in 2024, growing at a CAGR of around 6.9% during 2025–2034. Growth is driven by increasing automation in manufacturing, rising adoption of Industry 4.0 solutions, and the need for reliable computing systems in harsh industrial environments. Advancements in edge computing, AI integration, and IoT connectivity are further accelerating market expansion. Industrial PCs are becoming a core backbone of smart factories, enabling higher efficiency, predictive maintenance, and real-time data control.
The Industrial PC market encompasses ruggedized computing systems specifically designed for industrial applications, featuring enhanced durability, extended temperature ranges, and specialized interfaces. These systems serve critical roles in manufacturing automation, process control, data acquisition, and human-machine interface applications across diverse industrial sectors. The market includes various form factors such as panel PCs, box PCs, embedded systems, rack mount units, and DIN rail-mounted computers, each tailored to specific industrial requirements and environmental conditions.
The industrial PC market is experiencing robust growth driven by the accelerating adoption of Industry 4.0 initiatives and smart manufacturing technologies. Industry 4.0 and cyber-physical systems demand cableless connectivity and edge computing for real-time data processing. Digital transformation across manufacturing sectors is creating unprecedented demand for reliable computing platforms capable of handling complex automation tasks, real-time data processing, and seamless integration with IoT ecosystems. The integration of artificial intelligence capabilities into industrial computing systems is further propelling market expansion as organizations seek to leverage advanced analytics and machine learning for operational optimization.
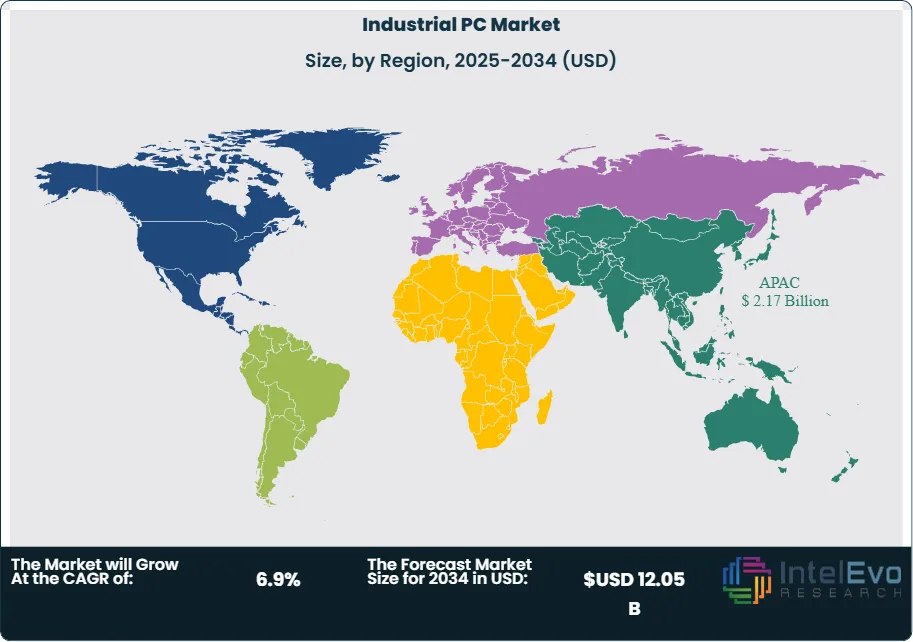
Asia Pacific currently dominates the industrial PC market, accounting for a share of 38.3% in 2024. The dominance is fueled by the rapid industrialization, the growth of manufacturing sectors, increasing adoption of automation technologies, and significant investments in smart factory initiatives across countries like China, Japan, South Korea, and India. North America follows as the second-largest market, driven by advanced manufacturing capabilities and early adoption of Industry 4.0 technologies. Europe maintains a strong position, particularly in automotive and aerospace applications, with Germany leading industrial automation initiatives.
The COVID-19 pandemic initially disrupted supply chains and manufacturing operations, causing temporary market contractions in 2020-2021. However, the crisis accelerated digital transformation initiatives as organizations recognized the critical importance of automation and remote monitoring capabilities. The pandemic highlighted the need for resilient, automated manufacturing systems, leading to increased investments in industrial PC solutions for unmanned operations, predictive maintenance, and real-time monitoring applications.
Global trade tensions and geopolitical conflicts have influenced supply chain strategies, with companies seeking to diversify sourcing and manufacturing locations. The ongoing semiconductor shortage has impacted production timelines and costs, while trade restrictions have prompted regional players to strengthen their market positions. These factors have created opportunities for regional manufacturers while challenging global supply chain optimization strategies.
Key Takeaways
Market Growth: The Industrial PC Market is expected to reach USD 12.05 Billion by 2034, owing to demand for industrial automation, IoT integration, and smart manufacturing (Industry 4.0)
Product Type Dominance: Panel IPC leads due to integrated display functionality and cost-effective automation solutions.
Display Type Dominance: Capacitive displays dominate market share, driven by superior touch sensitivity and industrial durability
Storage Medium Dominance: Solid State storage holds the largest share, owing to enhanced reliability and performance.
End-Use Industry Dominance: Manufacturing holds the largest share, driven by automation adoption and performance requirements.
Driver: Key drivers accelerating growth include Industry 4.0 adoption and IoT integration, which boost market expansion through enhanced automation and real-time data processing capabilities.
Restraint: Growth is hindered by high initial costs and complex integration requirements, which create challenges such as extended implementation timelines and technical complexity.
Opportunity: The market is poised for expansion due to opportunities like AI integration and edge computing adoption, which enable advanced analytics and real-time processing capabilities.
Trend: Emerging trends including modular PC designs and fanless cooling technologies are reshaping the market by improving flexibility and reliability in harsh environments.
Regional Analysis: Asia-Pacific leads market share owing to rapid industrialization and manufacturing growth.
Product Type Analysis:
Panel IPCs maintain their strong market position through strategic advantages that directly address manufacturing industry pain points. Their integrated display architecture eliminates the complexity of separate computing and visualization systems, reducing both procurement overhead and potential failure points in mission-critical applications. The all-in-one design significantly streamlines installation processes, requiring minimal wiring and cabinet space while ensuring consistent performance through optimized hardware-software integration. In manufacturing environments, these systems excel by providing operators with intuitive touch interfaces that enable direct process control and real-time visualization without network latency issues. The cost benefits extend beyond initial purchase price to include reduced maintenance complexity, consolidated vendor relationships, and simplified support structures.
Display Type Analysis:
Capacitive Leads With over 55% Market Share In Industrial PC Market. Capacitive touchscreen technology dominates industrial display applications through superior performance characteristics that align with demanding operational requirements. Their electromagnetic interference resistance ensures reliable operation in electrically noisy manufacturing environments where precision control is essential. The multi-touch functionality enables sophisticated gesture controls and simultaneous operator interactions, enhancing productivity in complex manufacturing processes. Superior touch accuracy and responsiveness reduce operator errors and improve process control efficiency, particularly critical in applications requiring precise adjustments or emergency responses. Unlike resistive alternatives that can degrade under repeated use, capacitive displays maintain consistent performance over extended operational lifecycles, reducing replacement costs and downtime. The technology's ability to function through protective gloves while maintaining accuracy makes it ideal for industrial safety requirements.
Storage Medium Analysis:
Solid-state storage technology has become the cornerstone of industrial computing infrastructure due to its exceptional resilience and performance advantages in demanding operational environments. The absence of mechanical components eliminates vibration sensitivity and shock vulnerability, critical factors in manufacturing facilities with heavy machinery and equipment. SSDs deliver consistent read/write speeds regardless of ambient temperature fluctuations and electromagnetic interference common in industrial settings. Their instant data access capabilities support real-time control applications where millisecond response times are essential for process optimization and safety systems. The enhanced durability translates to significantly reduced maintenance windows and unplanned downtime events, directly impacting operational efficiency and cost management.
End-Use Industry Analysis:
Manufacturing dominates the industrial PC market through its comprehensive digital transformation initiatives that require robust computing infrastructure for advanced automation systems. The sector's Industry 4.0 adoption drives demand for high-performance platforms capable of executing complex control algorithms, machine learning models, and predictive analytics in real-time environments. Manufacturing facilities require seamless enterprise system integration, connecting production floor operations with ERP, MES, and supply chain management systems for comprehensive operational visibility. The sector's emphasis on quality control, traceability, and regulatory compliance necessitates reliable computing solutions that can handle continuous data acquisition and processing without interruption. Manufacturing environments present unique challenges including electromagnetic interference, temperature variations, and vibration exposure, making ruggedized industrial PCs essential for maintaining operational continuity.
Region Analysis:
Asia-Pacific Leads With more than 35% Market Share In Industrial PC Market. Asia-Pacific maintains its position as the global leader in the Industrial PC market, primarily driven by China's manufacturing dominance and rapid industrialization across the region. The region benefits from concentrated manufacturing activities, government initiatives promoting smart manufacturing, and significant investments in automation technologies. Japan and South Korea contribute substantially through advanced technology adoption and precision manufacturing requirements, while India represents a growing market driven by expanding manufacturing capabilities and digital transformation initiatives.
North America holds the second-largest market position, characterized by early adoption of Industry 4.0 technologies and advanced manufacturing processes. The region's strength lies in high-value applications across aerospace, defense, and automotive sectors, where stringent quality requirements drive demand for premium industrial computing solutions. Europe maintains a strong market presence, particularly in Germany, which serves as a global leader in industrial automation and manufacturing technology innovation, with significant contributions from automotive and machinery manufacturing sectors.
Product Type (Panel IPC, Box IPC, Embedded IPC, Rack Mount IPC, DIN Rail IPC, Other Types); Display Type (Capacitive, Resistive, Other Display Types); Storage Medium (Solid State, Rotating); End-Use Industry (Manufacturing, Automotive, Aerospace & Defense, Semiconductor & Electronics, Energy & Power, Others)
Research Methodology
Primary Research- 100 Interviews of Stakeholders
Secondary Research
Desk Research
Regional scope
North America (United States, Canada, Mexico)
Latin America (Brazil, Argentina, Columbia)
East Asia And Pacific (China, Japan, South Korea, Australia, Cambodia, Fiji, Indonesia)
Sea And South Asia (India, Singapore, Thailand, Taiwan, Malaysia)
Eastern Europe (Poland, Russia, Czech Republic, Romania)
Western Europe (Germany, U.K., France, Spain, Itlay)
Middle East & Africa (GCC Countries, Egypt, Nigeria, South Africa, Israel)
Customization for segments, region/country-level will be provided. Moreover, additional customization can be done based on the requirements.
Pricing and Purchase Options
Avail customized purchase options to meet your exact research needs. We have three licenses to opt for: Single User License, Multi-User License (Up to 5 Users), Corporate Use License (Unlimited User and Printable PDF).
TABLE OF CONTENTS
1. EXECUTIVE SUMMARY
1.1. MARKET SNAPSHOT
1.2. KEY FINDINGS & INSIGHTS
1.3. ANALYST RECOMMENDATIONS
1.4. FUTURE OUTLOOK
2. RESEARCH METHODOLOGY
2.1. MARKET DEFINITION & SCOPE
2.2. RESEARCH OBJECTIVES: PRIMARY & SECONDARY DATA SOURCES
2.3. DATA COLLECTION SOURCES
2.3.1. COVERAGE OF 100+ PRIMARY RESEARCH/CONSULTATION CALLS WITH INDUSTRY STAKEHOLDERS
FIGURE 17 NORTH AMERICA INDUSTRIAL PC CURRENT AND FUTURE TYPE ANALYSIS, 2025–2034, (USD MILLION)
FIGURE 18 NORTH AMERICA INDUSTRIAL PC CURRENT AND FUTURE END USER ANALYSIS, 2025–2034, (USD MILLION)
FIGURE 19 MARKET SHARE BY COUNTRY
FIGURE 20 LATIN AMERICA INDUSTRIAL PC CURRENT AND FUTURE TYPE ANALYSIS, 2025–2034, (USD MILLION)
FIGURE 21 LATIN AMERICA INDUSTRIAL PC CURRENT AND FUTURE END USER ANALYSIS, 2025–2034, (USD MILLION)
FIGURE 22 MARKET SHARE BY COUNTRY
FIGURE 23 EASTERN EUROPE INDUSTRIAL PC CURRENT AND FUTURE TYPE ANALYSIS, 2025–2034, (USD MILLION)
FIGURE 24 EASTERN EUROPE INDUSTRIAL PC CURRENT AND FUTURE END USER ANALYSIS, 2025–2034, (USD MILLION)
FIGURE 25 MARKET SHARE BY COUNTRY
FIGURE 26 WESTERN EUROPE INDUSTRIAL PC CURRENT AND FUTURE TYPE ANALYSIS, 2025–2034, (USD MILLION)
FIGURE 27 WESTERN EUROPE INDUSTRIAL PC CURRENT AND FUTURE END USER ANALYSIS, 2025–2034, (USD MILLION)
FIGURE 28 MARKET SHARE BY COUNTRY
FIGURE 29 EAST ASIA AND PACIFIC INDUSTRIAL PC CURRENT AND FUTURE TYPE ANALYSIS, 2025–2034, (USD MILLION)
FIGURE 30 EAST ASIA AND PACIFIC INDUSTRIAL PC CURRENT AND FUTURE END USER ANALYSIS, 2025–2034, (USD MILLION)
FIGURE 31 MARKET SHARE BY COUNTRY
FIGURE 32 SEA AND SOUTH ASIA INDUSTRIAL PC CURRENT AND FUTURE TYPE ANALYSIS, 2025–2034, (USD MILLION)
FIGURE 33 SEA AND SOUTH ASIA INDUSTRIAL PC CURRENT AND FUTURE END USER ANALYSIS, 2025–2034, (USD MILLION)
FIGURE 34 MARKET SHARE BY COUNTRY
FIGURE 35 MIDDLE EAST AND AFRICA INDUSTRIAL PC CURRENT AND FUTURE TYPE ANALYSIS, 2025–2034, (USD MILLION)
FIGURE 36 MIDDLE EAST AND AFRICA INDUSTRIAL PC CURRENT AND FUTURE END USER ANALYSIS, 2025–2034, (USD MILLION)
FIGURE 37 NORTH AMERICA INDUSTRIAL PC CURRENT AND FUTURE MARKET VOLUME SHARE REGIONAL ANALYSIS, 2025–2034, (USD MILLION)
FIGURE 38 U.S. INDUSTRIAL PC CURRENT AND FUTURE TYPE ANALYSIS, 2025–2034, (USD MILLION)
FIGURE 39 U.S. INDUSTRIAL PC CURRENT AND FUTURE END USER ANALYSIS, 2025–2034, (USD MILLION)
FIGURE 40 CANADA INDUSTRIAL PC CURRENT AND FUTURE TYPE ANALYSIS, 2025–2034, (USD MILLION)
FIGURE 41 CANADA INDUSTRIAL PC CURRENT AND FUTURE END USER ANALYSIS, 2025–2034, (USD MILLION)
FIGURE 42 LATIN AMERICA INDUSTRIAL PC CURRENT AND FUTURE MARKET VOLUME SHARE REGIONAL ANALYSIS, 2025–2034, (USD MILLION)
FIGURE 43 MEXICO INDUSTRIAL PC CURRENT AND FUTURE TYPE ANALYSIS, 2025–2034, (USD MILLION)
FIGURE 44 MEXICO INDUSTRIAL PC CURRENT AND FUTURE END USER ANALYSIS, 2025–2034, (USD MILLION)
FIGURE 45 BRAZIL INDUSTRIAL PC CURRENT AND FUTURE TYPE ANALYSIS, 2025–2034, (USD MILLION)
FIGURE 46 BRAZIL INDUSTRIAL PC CURRENT AND FUTURE END USER ANALYSIS, 2025–2034, (USD MILLION)
FIGURE 47 ARGENTINA INDUSTRIAL PC CURRENT AND FUTURE TYPE ANALYSIS, 2025–2034, (USD MILLION)
FIGURE 48 ARGENTINA INDUSTRIAL PC CURRENT AND FUTURE END USER ANALYSIS, 2025–2034, (USD MILLION)
FIGURE 49 COLUMBIA INDUSTRIAL PC CURRENT AND FUTURE TYPE ANALYSIS, 2025–2034, (USD MILLION)
FIGURE 50 COLUMBIA INDUSTRIAL PC CURRENT AND FUTURE END USER ANALYSIS, 2025–2034, (USD MILLION)
FIGURE 51 REST OF LATIN AMERICA INDUSTRIAL PC CURRENT AND FUTURE TYPE ANALYSIS, 2025–2034, (USD MILLION)
FIGURE 52 REST OF LATIN AMERICA INDUSTRIAL PC CURRENT AND FUTURE END USER ANALYSIS, 2025–2034, (USD MILLION)
FIGURE 53 EASTERN EUROPE INDUSTRIAL PC CURRENT AND FUTURE MARKET VOLUME SHARE REGIONAL ANALYSIS, 2025–2034, (USD MILLION)
FIGURE 54 POLAND INDUSTRIAL PC CURRENT AND FUTURE TYPE ANALYSIS, 2025–2034, (USD MILLION)
FIGURE 55 POLAND INDUSTRIAL PC CURRENT AND FUTURE END USER ANALYSIS, 2025–2034, (USD MILLION)
FIGURE 56 RUSSIA INDUSTRIAL PC CURRENT AND FUTURE TYPE ANALYSIS, 2025–2034, (USD MILLION)
FIGURE 57 RUSSIA INDUSTRIAL PC CURRENT AND FUTURE END USER ANALYSIS, 2025–2034, (USD MILLION)
FIGURE 58 CZECH REPUBLIC INDUSTRIAL PC CURRENT AND FUTURE TYPE ANALYSIS, 2025–2034, (USD MILLION)
FIGURE 59 CZECH REPUBLIC INDUSTRIAL PC CURRENT AND FUTURE END USER ANALYSIS, 2025–2034, (USD MILLION)
FIGURE 60 ROMANIA INDUSTRIAL PC CURRENT AND FUTURE TYPE ANALYSIS, 2025–2034, (USD MILLION)
FIGURE 61 ROMANIA INDUSTRIAL PC CURRENT AND FUTURE END USER ANALYSIS, 2025–2034, (USD MILLION)
FIGURE 62 REST OF EASTERN EUROPE INDUSTRIAL PC CURRENT AND FUTURE TYPE ANALYSIS, 2025–2034, (USD MILLION)
FIGURE 63 REST OF EASTERN EUROPE INDUSTRIAL PC CURRENT AND FUTURE END USER ANALYSIS, 2025–2034, (USD MILLION)
FIGURE 64 WESTERN EUROPE INDUSTRIAL PC CURRENT AND FUTURE MARKET VOLUME SHARE REGIONAL ANALYSIS, 2025–2034, (USD MILLION)
FIGURE 65 GERMANY INDUSTRIAL PC CURRENT AND FUTURE TYPE ANALYSIS, 2025–2034, (USD MILLION)
FIGURE 66 GERMANY INDUSTRIAL PC CURRENT AND FUTURE END USER ANALYSIS, 2025–2034, (USD MILLION)
FIGURE 67 FRANCE INDUSTRIAL PC CURRENT AND FUTURE TYPE ANALYSIS, 2025–2034, (USD MILLION)
FIGURE 68 FRANCE INDUSTRIAL PC CURRENT AND FUTURE END USER ANALYSIS, 2025–2034, (USD MILLION)
FIGURE 69 UK INDUSTRIAL PC CURRENT AND FUTURE TYPE ANALYSIS, 2025–2034, (USD MILLION)
FIGURE 70 UK INDUSTRIAL PC CURRENT AND FUTURE END USER ANALYSIS, 2025–2034, (USD MILLION)
FIGURE 71 SPAIN INDUSTRIAL PC CURRENT AND FUTURE TYPE ANALYSIS, 2025–2034, (USD MILLION)
FIGURE 72 SPAIN INDUSTRIAL PC CURRENT AND FUTURE END USER ANALYSIS, 2025–2034, (USD MILLION)
FIGURE 73 ITALY INDUSTRIAL PC CURRENT AND FUTURE TYPE ANALYSIS, 2025–2034, (USD MILLION)
FIGURE 74 ITALY INDUSTRIAL PC CURRENT AND FUTURE END USER ANALYSIS, 2025–2034, (USD MILLION)
FIGURE 75 REST OF WESTERN EUROPE INDUSTRIAL PC CURRENT AND FUTURE TYPE ANALYSIS, 2025–2034, (USD MILLION)
FIGURE 76 REST OF WESTERN EUROPE INDUSTRIAL PC CURRENT AND FUTURE END USER ANALYSIS, 2025–2034, (USD MILLION)
FIGURE 77 EAST ASIA AND PACIFIC INDUSTRIAL PC CURRENT AND FUTURE MARKET VOLUME SHARE REGIONAL ANALYSIS, 2025–2034, (USD MILLION)
FIGURE 78 CHINA INDUSTRIAL PC CURRENT AND FUTURE TYPE ANALYSIS, 2025–2034, (USD MILLION)
FIGURE 79 CHINA INDUSTRIAL PC CURRENT AND FUTURE END USER ANALYSIS, 2025–2034, (USD MILLION)
FIGURE 80 JAPAN INDUSTRIAL PC CURRENT AND FUTURE TYPE ANALYSIS, 2025–2034, (USD MILLION)
FIGURE 81 JAPAN INDUSTRIAL PC CURRENT AND FUTURE END USER ANALYSIS, 2025–2034, (USD MILLION)
FIGURE 82 AUSTRALIA INDUSTRIAL PC CURRENT AND FUTURE TYPE ANALYSIS, 2025–2034, (USD MILLION)
FIGURE 83 AUSTRALIA INDUSTRIAL PC CURRENT AND FUTURE END USER ANALYSIS, 2025–2034, (USD MILLION)
FIGURE 84 CAMBODIA INDUSTRIAL PC CURRENT AND FUTURE TYPE ANALYSIS, 2025–2034, (USD MILLION)
FIGURE 85 CAMBODIA INDUSTRIAL PC CURRENT AND FUTURE END USER ANALYSIS, 2025–2034, (USD MILLION)
FIGURE 86 FIJI INDUSTRIAL PC CURRENT AND FUTURE TYPE ANALYSIS, 2025–2034, (USD MILLION)
FIGURE 87 FIJI INDUSTRIAL PC CURRENT AND FUTURE END USER ANALYSIS, 2025–2034, (USD MILLION)
FIGURE 88 INDONESIA INDUSTRIAL PC CURRENT AND FUTURE TYPE ANALYSIS, 2025–2034, (USD MILLION)
FIGURE 89 INDONESIA INDUSTRIAL PC CURRENT AND FUTURE END USER ANALYSIS, 2025–2034, (USD MILLION)
FIGURE 90 SOUTH KOREA INDUSTRIAL PC CURRENT AND FUTURE TYPE ANALYSIS, 2025–2034, (USD MILLION)
FIGURE 91 SOUTH KOREA INDUSTRIAL PC CURRENT AND FUTURE END USER ANALYSIS, 2025–2034, (USD MILLION)
FIGURE 92 REST OF EAST ASIA AND PACIFIC INDUSTRIAL PC CURRENT AND FUTURE TYPE ANALYSIS, 2025–2034, (USD MILLION)
FIGURE 93 REST OF EAST ASIA AND PACIFIC INDUSTRIAL PC CURRENT AND FUTURE END USER ANALYSIS, 2025–2034, (USD MILLION)
FIGURE 94 SEA AND SOUTH ASIA INDUSTRIAL PC CURRENT AND FUTURE MARKET VOLUME SHARE REGIONAL ANALYSIS, 2025–2034, (USD MILLION)
FIGURE 95 BANGLADESH INDUSTRIAL PC CURRENT AND FUTURE TYPE ANALYSIS, 2025–2034, (USD MILLION)
FIGURE 96 BANGLADESH INDUSTRIAL PC CURRENT AND FUTURE END USER ANALYSIS, 2025–2034, (USD MILLION)
FIGURE 97 NEW ZEALAND INDUSTRIAL PC CURRENT AND FUTURE TYPE ANALYSIS, 2025–2034, (USD MILLION)
FIGURE 98 NEW ZEALAND INDUSTRIAL PC CURRENT AND FUTURE END USER ANALYSIS, 2025–2034, (USD MILLION)
FIGURE 99 INDIA INDUSTRIAL PC CURRENT AND FUTURE TYPE ANALYSIS, 2025–2034, (USD MILLION)
FIGURE 100 INDIA INDUSTRIAL PC CURRENT AND FUTURE END USER ANALYSIS, 2025–2034, (USD MILLION)
FIGURE 101 SINGAPORE INDUSTRIAL PC CURRENT AND FUTURE TYPE ANALYSIS, 2025–2034, (USD MILLION)
FIGURE 102 SINGAPORE INDUSTRIAL PC CURRENT AND FUTURE END USER ANALYSIS, 2025–2034, (USD MILLION)
FIGURE 103 THAILAND INDUSTRIAL PC CURRENT AND FUTURE TYPE ANALYSIS, 2025–2034, (USD MILLION)
FIGURE 104 THAILAND INDUSTRIAL PC CURRENT AND FUTURE END USER ANALYSIS, 2025–2034, (USD MILLION)
FIGURE 105 TAIWAN INDUSTRIAL PC CURRENT AND FUTURE TYPE ANALYSIS, 2025–2034, (USD MILLION)
FIGURE 106 TAIWAN INDUSTRIAL PC CURRENT AND FUTURE END USER ANALYSIS, 2025–2034, (USD MILLION)
FIGURE 107 MALAYSIA INDUSTRIAL PC CURRENT AND FUTURE TYPE ANALYSIS, 2025–2034, (USD MILLION)
FIGURE 108 MALAYSIA INDUSTRIAL PC CURRENT AND FUTURE END USER ANALYSIS, 2025–2034, (USD MILLION)
FIGURE 109 REST OF SEA AND SOUTH ASIA INDUSTRIAL PC CURRENT AND FUTURE TYPE ANALYSIS, 2025–2034, (USD MILLION)
FIGURE 110 REST OF SEA AND SOUTH ASIA INDUSTRIAL PC CURRENT AND FUTURE END USER ANALYSIS, 2025–2034, (USD MILLION)
FIGURE 111 MIDDLE EAST AND AFRICA INDUSTRIAL PC CURRENT AND FUTURE MARKET VOLUME SHARE REGIONAL ANALYSIS, 2025–2034, (USD MILLION)
FIGURE 112 GCC COUNTRIES INDUSTRIAL PC CURRENT AND FUTURE TYPE ANALYSIS, 2025–2034, (USD MILLION)
FIGURE 113 GCC COUNTRIES INDUSTRIAL PC CURRENT AND FUTURE END USER ANALYSIS, 2025–2034, (USD MILLION)
FIGURE 114 SAUDI ARABIA INDUSTRIAL PC CURRENT AND FUTURE TYPE ANALYSIS, 2025–2034, (USD MILLION)
FIGURE 115 SAUDI ARABIA INDUSTRIAL PC CURRENT AND FUTURE END USER ANALYSIS, 2025–2034, (USD MILLION)
FIGURE 116 UAE INDUSTRIAL PC CURRENT AND FUTURE TYPE ANALYSIS, 2025–2034, (USD MILLION)
FIGURE 117 UAE INDUSTRIAL PC CURRENT AND FUTURE END USER ANALYSIS, 2025–2034, (USD MILLION)
FIGURE 118 BAHRAIN INDUSTRIAL PC CURRENT AND FUTURE TYPE ANALYSIS, 2025–2034, (USD MILLION)
FIGURE 119 BAHRAIN INDUSTRIAL PC CURRENT AND FUTURE END USER ANALYSIS, 2025–2034, (USD MILLION)
FIGURE 120 KUWAIT INDUSTRIAL PC CURRENT AND FUTURE TYPE ANALYSIS, 2025–2034, (USD MILLION)
FIGURE 121 KUWAIT INDUSTRIAL PC CURRENT AND FUTURE END USER ANALYSIS, 2025–2034, (USD MILLION)
FIGURE 122 OMAN INDUSTRIAL PC CURRENT AND FUTURE TYPE ANALYSIS, 2025–2034, (USD MILLION)
FIGURE 123 OMAN INDUSTRIAL PC CURRENT AND FUTURE END USER ANALYSIS, 2025–2034, (USD MILLION)
FIGURE 124 QATAR INDUSTRIAL PC CURRENT AND FUTURE TYPE ANALYSIS, 2025–2034, (USD MILLION)
FIGURE 125 QATAR INDUSTRIAL PC CURRENT AND FUTURE END USER ANALYSIS, 2025–2034, (USD MILLION)
FIGURE 126 EGYPT INDUSTRIAL PC CURRENT AND FUTURE TYPE ANALYSIS, 2025–2034, (USD MILLION)
FIGURE 127 EGYPT INDUSTRIAL PC CURRENT AND FUTURE END USER ANALYSIS, 2025–2034, (USD MILLION)
FIGURE 128 NIGERIA INDUSTRIAL PC CURRENT AND FUTURE TYPE ANALYSIS, 2025–2034, (USD MILLION)
FIGURE 129 NIGERIA INDUSTRIAL PC CURRENT AND FUTURE END USER ANALYSIS, 2025–2034, (USD MILLION)
FIGURE 130 SOUTH AFRICA INDUSTRIAL PC CURRENT AND FUTURE TYPE ANALYSIS, 2025–2034, (USD MILLION)
FIGURE 131 SOUTH AFRICA INDUSTRIAL PC CURRENT AND FUTURE END USER ANALYSIS, 2025–2034, (USD MILLION)
FIGURE 132 ISRAEL INDUSTRIAL PC CURRENT AND FUTURE TYPE ANALYSIS, 2025–2034, (USD MILLION)
FIGURE 133 ISRAEL INDUSTRIAL PC CURRENT AND FUTURE END USER ANALYSIS, 2025–2034, (USD MILLION)
FIGURE 134 REST OF MEA INDUSTRIAL PC CURRENT AND FUTURE TYPE ANALYSIS, 2025–2034, (USD MILLION)
FIGURE 135 REST OF MEA INDUSTRIAL PC CURRENT AND FUTURE END USER ANALYSIS, 2025–2034, (USD MILLION)
FIGURE 136 U. S. MARKET SHARE ANALYSIS BY TYPE (2024)
FIGURE 137 U. S. MARKET SHARE ANALYSIS BY END USER (2024)
FIGURE 138 CANADA MARKET SHARE ANALYSIS BY TYPE (2024)
FIGURE 139 CANADA MARKET SHARE ANALYSIS BY END USER (2024)
FIGURE 140 MEXICO MARKET SHARE ANALYSIS BY TYPE (2024)
FIGURE 141 MEXICO MARKET SHARE ANALYSIS BY END USER (2024)
FIGURE 142 CHINA MARKET SHARE ANALYSIS BY TYPE (2024)
FIGURE 143 CHINA MARKET SHARE ANALYSIS BY END USER (2024)
FIGURE 144 JAPAN MARKET SHARE ANALYSIS BY TYPE (2024)
FIGURE 145 JAPAN MARKET SHARE ANALYSIS BY END USER (2024)
FIGURE 146 INDIA MARKET SHARE ANALYSIS BY TYPE (2024)
FIGURE 147 INDIA MARKET SHARE ANALYSIS BY END USER (2024)
FIGURE 148 SOUTH KOREA MARKET SHARE ANALYSIS BY TYPE (2024)
FIGURE 149 SOUTH KOREA MARKET SHARE ANALYSIS BY END USER (2024)
FIGURE 150 SAUDI ARABIA MARKET SHARE ANALYSIS BY TYPE (2024)
FIGURE 151 SAUDI ARABIA MARKET SHARE ANALYSIS BY END USER (2024)
FIGURE 152 UAE MARKET SHARE ANALYSIS BY TYPE (2024)
FIGURE 153 UAE MARKET SHARE ANALYSIS BY END USER (2024)
FIGURE 154 EGYPT MARKET SHARE ANALYSIS BY TYPE (2024)
FIGURE 155 EGYPT MARKET SHARE ANALYSIS BY END USER (2024)
FIGURE 156 NIGERIA MARKET SHARE ANALYSIS BY TYPE (2024)
FIGURE 157 NIGERIA MARKET SHARE ANALYSIS BY END USER (2024)
FIGURE 158 SOUTH AFRICA MARKET SHARE ANALYSIS BY TYPE (2024)
FIGURE 159 SOUTH AFRICA MARKET SHARE ANALYSIS BY END USER (2024)
FIGURE 160 GERMANY MARKET SHARE ANALYSIS BY TYPE (2024)
FIGURE 161 GERMANY MARKET SHARE ANALYSIS BY END USER (2024)
FIGURE 162 FRANCE MARKET SHARE ANALYSIS BY TYPE (2024)
FIGURE 163 FRANCE MARKET SHARE ANALYSIS BY END USER (2024)
FIGURE 164 UK MARKET SHARE ANALYSIS BY TYPE (2024)
FIGURE 165 UK MARKET SHARE ANALYSIS BY END USER (2024)
FIGURE 166 SPAIN MARKET SHARE ANALYSIS BY TYPE (2024)
FIGURE 167 SPAIN MARKET SHARE ANALYSIS BY END USER (2024)
FIGURE 168 ITALY MARKET SHARE ANALYSIS BY TYPE (2024)
FIGURE 169 ITALY MARKET SHARE ANALYSIS BY END USER (2024)
FIGURE 170 BRAZIL MARKET SHARE ANALYSIS BY TYPE (2024)
FIGURE 171 BRAZIL MARKET SHARE ANALYSIS BY END USER (2024)
FIGURE 172 ARGENTINA MARKET SHARE ANALYSIS BY TYPE (2024)
FIGURE 173 ARGENTINA MARKET SHARE ANALYSIS BY END USER (2024)
FIGURE 174 COLUMBIA MARKET SHARE ANALYSIS BY TYPE (2024)
FIGURE 175 COLUMBIA MARKET SHARE ANALYSIS BY END USER (2024)
FIGURE 176 GLOBAL INDUSTRIAL PC CURRENT AND FUTURE MARKET KEY COUNTRY LEVEL ANALYSIS, 2024–2034, (USD MILLION)
FIGURE 177 FINANCIAL OVERVIEW:
Key Players Analysis:
Advantech Co., Ltd.: Advantech maintains its position as the global market leader with approximately 20% market share, leveraging comprehensive product portfolios, extensive distribution networks, and strong customer relationships built over decades of industry experience. The company's success stems from its ability to provide complete solutions ranging from basic industrial computers to sophisticated IoT platforms, supported by robust engineering services and technical support capabilities. Advantech's strategic focus on emerging technologies such as edge computing and AI integration positions the company to capitalize on evolving market demands while maintaining its leadership position.
Siemens: Siemens commands significant market influence with approximately 15% market share, leveraging its extensive industrial automation expertise and technological innovation capabilities to deliver integrated solutions that combine industrial computing with advanced control systems. The company's strength lies in its ability to provide comprehensive automation solutions that integrate seamlessly with existing industrial infrastructure, supported by global service networks and deep industry knowledge. Siemens continues to invest heavily in research and development to maintain technological leadership in emerging areas such as digital twins and industrial IoT applications.
Beckhoff Automation: Beckhoff maintains a strong market position with approximately 12% share through its focus on PC-based control technology and innovative engineering solutions that push the boundaries of industrial automation capabilities. The company's reputation for technical excellence and pioneering approach to industrial computing attracts customers seeking cutting-edge solutions for demanding applications. Beckhoff's commitment to continuous innovation and close customer collaboration enables rapid development of customized solutions that address specific industry requirements and emerging market needs.
Market Key Players
Advantech Co., Ltd.
Siemens
Beckhoff Automation
IEI Integration Corporation
B&R Automation
Kontron
AAEON
EVOC
Norco
Mitsubishi Electric
OnLogic
Premio Inc.
Moxa
Panasonic Industrial Devices
Driver:
Industry 4.0 and Smart Manufacturing Adoption:
The widespread implementation of Industry 4.0 principles represents the primary growth catalyst for the Industrial PC market, fundamentally transforming manufacturing operations through intelligent automation and data-driven decision making. Organizations are investing heavily in smart factory initiatives that require sophisticated computing platforms capable of handling complex algorithms, real-time data processing, and seamless integration with IoT ecosystems. Industrial PCs serve as the backbone of these intelligent manufacturing systems, enabling predictive maintenance, quality optimization, and operational efficiency improvements. The technology enables manufacturers to achieve higher productivity levels while reducing operational costs and improving product quality through advanced monitoring and control capabilities.
IoT Integration and Edge Computing Requirements:
The proliferation of Internet of Things applications in industrial settings is driving unprecedented demand for edge computing capabilities, positioning Industrial PCs as critical infrastructure components for data processing and analysis at the source. Edge computing reduces latency, improves real-time responsiveness, and minimizes bandwidth requirements by processing data locally rather than transmitting it to centralized cloud systems. This approach is particularly valuable for time-critical applications such as machine control, safety systems, and quality inspection processes where milliseconds can determine operational success or failure
Restrain:
High Initial Investment and Implementation Costs:
The substantial upfront costs associated with Industrial PC deployments represent a significant barrier to adoption, particularly for small and medium sized enterprises with limited capital budgets. Beyond hardware costs, organizations must consider system integration expenses, software licensing fees, training requirements, and potential production disruptions during implementation phases. The total cost of ownership includes ongoing maintenance, support, and eventual technology refresh cycles, which can strain financial resources and extend payback periods. This financial burden is compounded by the need for specialized technical expertise to design, implement, and maintain industrial computing systems, requiring additional investments in personnel training or external consulting services.
Technical Complexity and Integration Challenges:
The increasing sophistication of industrial computing systems creates significant technical barriers that can impede successful implementation and operation. Organizations must navigate complex integration requirements involving legacy systems, diverse communication protocols, and varying industry standards, often requiring custom solutions and specialized expertise. The challenge is amplified by the need to maintain operational continuity during system upgrades or replacements, as production interruptions can result in substantial financial losses and customer impact.
Opportunities:
Artificial Intelligence and Machine Learning Integration:
The convergence of AI capabilities with industrial computing represents a transformative opportunity that promises to unlock new levels of operational intelligence and automation sophistication. Industrial PCs equipped with AI processing capabilities enable advanced applications such as predictive maintenance, intelligent quality control, and autonomous decision-making systems that can significantly improve operational efficiency and reduce costs. Machine learning algorithms can analyze vast amounts of operational data to identify patterns, predict failures, and optimize processes in real-time, creating competitive advantages for early adopters. The market opportunity extends across multiple sectors, with manufacturing, energy, and transportation industries showing particular interest in AI-enabled industrial computing solutions.
5G Connectivity and Wireless Industrial Networks:
The rollout of 5G technology creates unprecedented opportunities for wireless industrial computing applications, enabling new use cases that were previously constrained by connectivity limitations. Ultra-low latency, high bandwidth, and reliable connectivity characteristics of 5G networks support advanced applications such as remote control systems, augmented reality maintenance procedures, and real-time video analytics for quality control. This technology evolution enables more flexible manufacturing layouts, mobile robotics applications, and distributed control architectures that can adapt to changing production requirements.
Trends:
Modular and Scalable System Architectures:
The industry is experiencing a significant shift toward modular industrial PC designs that enable flexible configuration and easy scalability to meet evolving operational requirements. Modular architectures allow organizations to customize computing platforms based on specific application needs while providing upgrade paths that protect initial investments. This approach supports phased implementation strategies that align with budget constraints and operational priorities, enabling organizations to start with basic configurations and add capabilities as requirements evolve and budgets permit.
Fanless and Rugged Design Evolution:
Advanced thermal management technologies are enabling the development of fanless industrial PC systems that eliminate mechanical components prone to failure in harsh environments. These designs improve system reliability, reduce maintenance requirements, and enable deployment in applications where traditional cooling systems would be impractical or unreliable. The trend toward fanless designs is accompanied by enhanced rugged construction that can withstand extreme temperatures, shock, vibration, and electromagnetic interference typically encountered in industrial environments
Recent Development
In March 2025: Siemens has finalized its strategic acquisition of Altair Engineering Inc., a prominent industrial simulation and analysis software company, in a transaction valued at approximately $10 billion. This acquisition strengthens Siemens' position in the simulation and industrial AI sectors by incorporating advanced mechanical and electromagnetic simulation capabilities, along with high-performance computing, data analytics, and artificial intelligence technologies. The integration of Altair's expertise and technological solutions will enhance Siemens' comprehensive Digital Twin platform, democratizing simulation access to enable organizations across all scales to accelerate complex product development cycles.
In November 2024: Siemens has unveiled its latest Industrial PC product series featuring integrated NVIDIA graphics processing units, representing a significant advancement in AI-enabled industrial computing solutions. This new IPC lineup, complemented by an expanded artificial intelligence portfolio within the Industrial Operations X ecosystem, is designed to enhance AI application performance in industrial environments. The product launch represents a key achievement in the ongoing strategic collaboration between Siemens and NVIDIA, which was established in June 2022 to advance industrial AI capabilities.