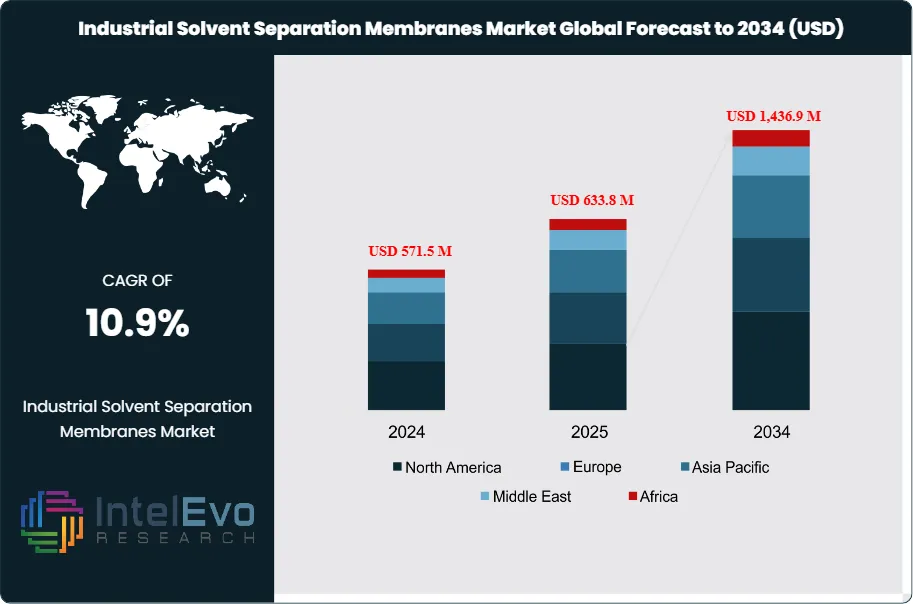
The Industrial Solvent Separation Membranes market is estimated at USD 571.5 million in 2024 and is on track to reach approximately USD 1,436.9 million by 2034, implying a strong compound annual growth rate of about 10.9% over 2025–2034. Rising adoption of membrane-based purification in pharmaceuticals, specialty chemicals, and petrochemical applications is accelerating demand globally. With industries shifting toward energy-efficient, solvent-recovery technologies, membranes are rapidly replacing traditional thermal separation systems. As sustainability mandates tighten worldwide, the market is gaining traction for its ability to reduce operational costs and lower carbon emissions. The growing push for zero-liquid-discharge (ZLD) solutions and circular solvent reuse is expected to further elevate adoption across high-growth sectors.
This growth reflects a structural shift in industrial separation practices, driven by the rising need for efficient, low-energy alternatives to traditional solvent recovery methods. Historically reliant on distillation, industries are turning to membrane-based separation technologies that offer improved selectivity, reduced energy consumption, and lower operational costs. These membranes are engineered to function in chemically aggressive environments, making them suitable for applications involving organic solvents across sectors such as pharmaceuticals, chemicals, food and beverage, and wastewater treatment.
Pharmaceutical manufacturers use these membranes to purify active pharmaceutical ingredients and minimize solvent usage. In the chemicals sector, they enable complex separations where traditional techniques fall short. Food and beverage companies adopt them to ensure purity and regulatory compliance. In wastewater treatment, solvent-resistant membranes support removal of hazardous organics and facilitate water reuse—key concerns in tightening environmental frameworks.
Tougher global emissions and waste discharge regulations are accelerating this market’s expansion. Regulatory bodies across North America, Europe, and parts of Asia-Pacific are mandating stricter solvent recovery and pollution control standards, which is pushing companies to integrate more sustainable separation methods. On the supply side, research in solvent-stable materials is driving technical improvements. Advancements such as nanofiber membranes and polymer composites are expanding operational lifespans and compatibility across diverse solvent systems.
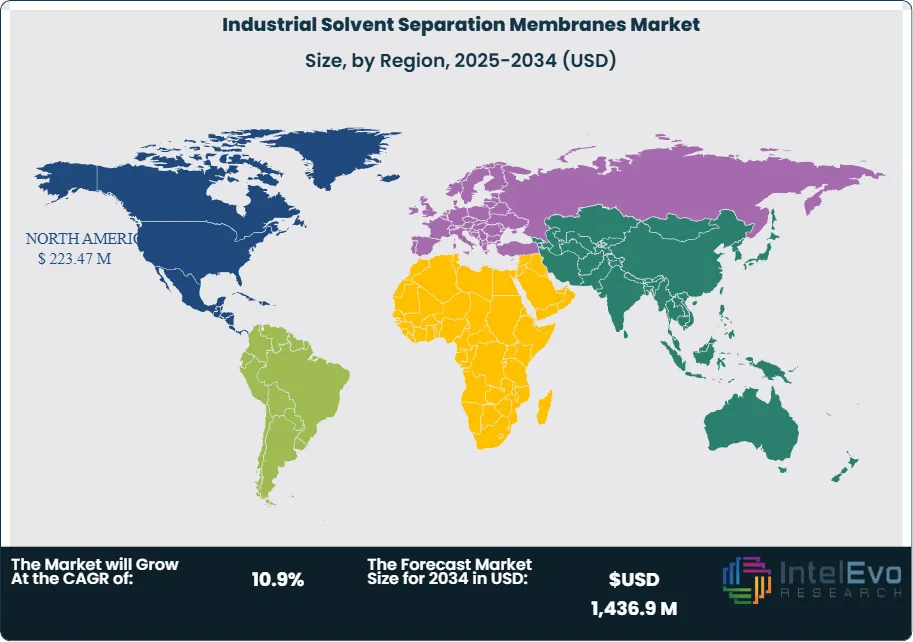
The Asia-Pacific region leads the global market, fueled by rapid industrialization and stringent environmental directives in China, India, and Southeast Asia. Europe and North America follow, where early regulatory frameworks and technology adoption are supporting market maturity. Meanwhile, Latin America and the Middle East are emerging as promising investment zones due to expanding manufacturing footprints and growing environmental awareness.
For investors, the opportunity lies in advanced membrane technologies with high durability and performance across varied solvent chemistries. As industries seek cleaner, faster, and more cost-effective recovery methods, solvent separation membranes are positioned to play a critical role in modern industrial ecosystems through 2034.
Geopolitical Impact Analysis: Ongoing geopolitical tensions, particularly between major economies like the U.S. and China, have exposed vulnerabilities in global membrane supply chains. Trade restrictions and raw material shortages—especially for critical components such as polyamide and PTFE—have increased input costs and delayed production timelines. As a result, manufacturers are reassessing supplier relationships and shifting toward regional sourcing to ensure operational continuity.
At the same time, government-led initiatives in Asia-Pacific and Europe are pushing for domestic membrane production to reduce external dependencies. In China and India, industrial policy is aligning with environmental goals, prompting significant investment in local membrane R&D and manufacturing. While this fragmentation may increase short-term costs, it is also driving innovation and accelerating regional market development. For global stakeholders, geopolitical risks are now a key factor influencing investment decisions, supplier diversification, and technology localization strategies.
Key Takeaways
Market Growth: The global industrial solvent separation membranes market is projected to grow from USD 571.5 million in 2024 to USD 1,436.9 million by 2034, registering a CAGR of 10.9%. Growth is driven by rising demand for solvent recovery, environmental regulations, and efficiency-focused production in pharmaceuticals and chemicals.
Material Type: Polyamide membranes hold the largest share at 45.3%, due to their strong chemical resistance and superior membrane-forming properties, making them suitable for aggressive solvent environments.
Technology: Reverse osmosis accounts for 54.1% of the market, supported by its high removal efficiency across a wide spectrum of organic solvents and impurities in industrial separation processes.
Application: Halogenated solvents lead with a 44.4% market share. Their extensive use in pharmaceuticals, chemicals, and electronics sectors, where high-purity solvents are essential, sustains demand.
End Use: The chemicals industry dominates with 58.5% of global revenue, driven by continuous demand for solvent purification and reuse in large-scale manufacturing and process intensification.
Driver: Tightening environmental regulations worldwide are compelling industries to adopt membrane technologies. This shift is especially strong in sectors where solvent disposal and recovery compliance directly impact operating licenses and cost structures.
Restraint: High capital costs and performance degradation in extreme solvent conditions limit adoption in smaller operations and emerging markets, constraining penetration outside established industrial hubs.
Opportunity: Emerging economies in Asia-Pacific, particularly India and Southeast Asia, present strong growth potential. Rapid industrialization and evolving regulatory environments are expected to drive double-digit regional CAGR through 2034.
Trend: Advancements in solvent-stable nanofiber and polymer composite membranes are improving lifespan and selectivity. Key manufacturers are investing in R&D for broader chemical compatibility and higher throughput.
Regional Analysis: North America leads the global market with 39.1% share, supported by mature manufacturing infrastructure and early regulatory compliance. Asia-Pacific is the fastest-growing region, with rising industrial output and increasing focus on solvent recovery technologies.
Material Type Analysis
The industrial solvent separation membranes market is segmented by material into polyamide, polytetrafluoroethylene (PTFE), mixed cellulose ester, polyvinylidene fluoride (PVDF), polyether ether ketone (PEEK), and others. As of 2025, polyamide membranes continue to lead, accounting for 45.3% of global revenue. Their dominance is driven by strong chemical resistance, high mechanical stability, and consistent membrane-forming capability. These properties allow polyamide membranes to perform effectively in demanding environments, particularly where aggressive organic solvents are present.
The compatibility of polyamide materials with advanced technologies like nanofiltration and reverse osmosis enhances their utility across pharmaceutical, chemical, and electronics sectors. Their high flux performance and cost-efficiency make them a preferred material for companies aiming to improve throughput without compromising separation accuracy. Demand is expected to remain strong as industries seek robust membranes that can handle solvent-intensive applications while reducing downtime and replacement costs.
Technology Analysis
Among technologies, reverse osmosis (RO) remains the most widely adopted, holding 54.1% of the market share in 2025. RO is favored for its high rejection rate of dissolved organics and ability to process a broad spectrum of industrial solvents. Its effectiveness in recovering high-purity solvents, coupled with improved membrane durability, supports its strong market position across diverse sectors such as pharmaceuticals, chemicals, and food and beverage.
Recent advancements in RO system design—such as energy-efficient configurations and longer membrane life—have made the technology more attractive for cost-sensitive industries. While nanofiltration and ultrafiltration are gaining traction in niche applications, RO continues to dominate due to its performance in large-scale, high-precision separation processes. Adoption is likely to accelerate further as regulatory pressure increases and companies invest in cleaner production practices.
Application Analysis
In terms of application, halogenated solvents remain the leading segment, capturing 44.4% of global demand in 2025. This category includes dichloromethane and tetrachloroethylene, widely used in pharmaceuticals, chemical manufacturing, and electronics. These solvents require precise separation due to their toxicity and environmental risk, making membrane-based recovery solutions essential for both compliance and cost reduction.
As environmental regulations become more stringent, particularly around emissions and waste disposal, industries are shifting toward closed-loop solvent recovery systems. Membrane technologies provide a high-efficiency pathway for recycling halogenated solvents, reducing the need for virgin solvent input and lowering waste treatment costs. This application area is projected to remain a critical driver of demand through the end of the decade.
End-Use Analysis
The chemicals industry accounts for the largest share of end-use, representing 58.5% of global market value in 2025. Solvent separation membranes are integral to this sector, particularly in processes involving purification, recovery, and reuse of solvents in continuous production environments. High throughput and compliance requirements have made membrane systems a preferred solution over traditional thermal separation.
Chemical producers are increasingly integrating membrane systems to meet internal sustainability goals and reduce dependency on energy-intensive operations. In addition, membrane technologies provide consistent product quality and reduce solvent loss, which is critical in the manufacture of fine and specialty chemicals. The pharmaceutical sector also shows strong uptake, while food and beverage and paints and coatings represent growing end-use segments with evolving purification needs.
Regional Analysis
North America remains the largest regional market, contributing 39.1% of global revenue in 2025. Its leadership is underpinned by advanced manufacturing infrastructure, stringent environmental standards, and high adoption rates in chemical and pharmaceutical sectors. Regulatory bodies such as the U.S. EPA continue to mandate stricter solvent recovery and emission controls, creating favorable conditions for membrane system investments.
While North America leads in adoption, Asia Pacific is emerging as the fastest-growing region. Rapid industrial expansion in China, India, and Southeast Asia, combined with evolving environmental policies, is expected to drive double-digit regional CAGR through 2030. Meanwhile, Europe maintains steady demand, supported by early technology adoption and strong environmental policy frameworks. Latin America and the Middle East are expected to see moderate growth, driven by increasing industrial activity and rising awareness of solvent management solutions.
Customization for segments, region/country-level will be provided. Moreover, additional customization can be done based on the requirements.
Pricing and Purchase Options
Avail customized purchase options to meet your exact research needs. We have three licenses to opt for: Single User License, Multi-User License (Up to 5 Users), Corporate Use License (Unlimited User and Printable PDF).
TABLE OF CONTENTS
1. EXECUTIVE SUMMARY
1.1. MARKET SNAPSHOT
1.2. KEY FINDINGS & INSIGHTS
1.3. ANALYST RECOMMENDATIONS
1.4. FUTURE OUTLOOK
2. RESEARCH METHODOLOGY
2.1. MARKET DEFINITION & SCOPE
2.2. RESEARCH OBJECTIVES: PRIMARY & SECONDARY DATA SOURCES
2.3. DATA COLLECTION SOURCES
2.3.1. COVERAGE OF 100+ PRIMARY RESEARCH/CONSULTATION CALLS WITH INDUSTRY STAKEHOLDERS
FIGURE 17 NORTH AMERICA INDUSTRIAL SOLVENT SEPARATION MEMBRANES CURRENT AND FUTURE TYPE ANALYSIS, 2025–2034, (USD MILLION)
FIGURE 18 NORTH AMERICA INDUSTRIAL SOLVENT SEPARATION MEMBRANES CURRENT AND FUTURE END USER ANALYSIS, 2025–2034, (USD MILLION)
FIGURE 19 MARKET SHARE BY COUNTRY
FIGURE 20 LATIN AMERICA INDUSTRIAL SOLVENT SEPARATION MEMBRANES CURRENT AND FUTURE TYPE ANALYSIS, 2025–2034, (USD MILLION)
FIGURE 21 LATIN AMERICA INDUSTRIAL SOLVENT SEPARATION MEMBRANES CURRENT AND FUTURE END USER ANALYSIS, 2025–2034, (USD MILLION)
FIGURE 22 MARKET SHARE BY COUNTRY
FIGURE 23 EASTERN EUROPE INDUSTRIAL SOLVENT SEPARATION MEMBRANES CURRENT AND FUTURE TYPE ANALYSIS, 2025–2034, (USD MILLION)
FIGURE 24 EASTERN EUROPE INDUSTRIAL SOLVENT SEPARATION MEMBRANES CURRENT AND FUTURE END USER ANALYSIS, 2025–2034, (USD MILLION)
FIGURE 25 MARKET SHARE BY COUNTRY
FIGURE 26 WESTERN EUROPE INDUSTRIAL SOLVENT SEPARATION MEMBRANES CURRENT AND FUTURE TYPE ANALYSIS, 2025–2034, (USD MILLION)
FIGURE 27 WESTERN EUROPE INDUSTRIAL SOLVENT SEPARATION MEMBRANES CURRENT AND FUTURE END USER ANALYSIS, 2025–2034, (USD MILLION)
FIGURE 28 MARKET SHARE BY COUNTRY
FIGURE 29 EAST ASIA AND PACIFIC INDUSTRIAL SOLVENT SEPARATION MEMBRANES CURRENT AND FUTURE TYPE ANALYSIS, 2025–2034, (USD MILLION)
FIGURE 30 EAST ASIA AND PACIFIC INDUSTRIAL SOLVENT SEPARATION MEMBRANES CURRENT AND FUTURE END USER ANALYSIS, 2025–2034, (USD MILLION)
FIGURE 31 MARKET SHARE BY COUNTRY
FIGURE 32 SEA AND SOUTH ASIA INDUSTRIAL SOLVENT SEPARATION MEMBRANES CURRENT AND FUTURE TYPE ANALYSIS, 2025–2034, (USD MILLION)
FIGURE 33 SEA AND SOUTH ASIA INDUSTRIAL SOLVENT SEPARATION MEMBRANES CURRENT AND FUTURE END USER ANALYSIS, 2025–2034, (USD MILLION)
FIGURE 34 MARKET SHARE BY COUNTRY
FIGURE 35 MIDDLE EAST AND AFRICA INDUSTRIAL SOLVENT SEPARATION MEMBRANES CURRENT AND FUTURE TYPE ANALYSIS, 2025–2034, (USD MILLION)
FIGURE 36 MIDDLE EAST AND AFRICA INDUSTRIAL SOLVENT SEPARATION MEMBRANES CURRENT AND FUTURE END USER ANALYSIS, 2025–2034, (USD MILLION)
FIGURE 37 NORTH AMERICA INDUSTRIAL SOLVENT SEPARATION MEMBRANES CURRENT AND FUTURE MARKET VOLUME SHARE REGIONAL ANALYSIS, 2025–2034, (USD MILLION)
FIGURE 38 U.S. INDUSTRIAL SOLVENT SEPARATION MEMBRANES CURRENT AND FUTURE TYPE ANALYSIS, 2025–2034, (USD MILLION)
FIGURE 39 U.S. INDUSTRIAL SOLVENT SEPARATION MEMBRANES CURRENT AND FUTURE END USER ANALYSIS, 2025–2034, (USD MILLION)
FIGURE 40 CANADA INDUSTRIAL SOLVENT SEPARATION MEMBRANES CURRENT AND FUTURE TYPE ANALYSIS, 2025–2034, (USD MILLION)
FIGURE 41 CANADA INDUSTRIAL SOLVENT SEPARATION MEMBRANES CURRENT AND FUTURE END USER ANALYSIS, 2025–2034, (USD MILLION)
FIGURE 42 LATIN AMERICA INDUSTRIAL SOLVENT SEPARATION MEMBRANES CURRENT AND FUTURE MARKET VOLUME SHARE REGIONAL ANALYSIS, 2025–2034, (USD MILLION)
FIGURE 43 MEXICO INDUSTRIAL SOLVENT SEPARATION MEMBRANES CURRENT AND FUTURE TYPE ANALYSIS, 2025–2034, (USD MILLION)
FIGURE 44 MEXICO INDUSTRIAL SOLVENT SEPARATION MEMBRANES CURRENT AND FUTURE END USER ANALYSIS, 2025–2034, (USD MILLION)
FIGURE 45 BRAZIL INDUSTRIAL SOLVENT SEPARATION MEMBRANES CURRENT AND FUTURE TYPE ANALYSIS, 2025–2034, (USD MILLION)
FIGURE 46 BRAZIL INDUSTRIAL SOLVENT SEPARATION MEMBRANES CURRENT AND FUTURE END USER ANALYSIS, 2025–2034, (USD MILLION)
FIGURE 47 ARGENTINA INDUSTRIAL SOLVENT SEPARATION MEMBRANES CURRENT AND FUTURE TYPE ANALYSIS, 2025–2034, (USD MILLION)
FIGURE 48 ARGENTINA INDUSTRIAL SOLVENT SEPARATION MEMBRANES CURRENT AND FUTURE END USER ANALYSIS, 2025–2034, (USD MILLION)
FIGURE 49 COLUMBIA INDUSTRIAL SOLVENT SEPARATION MEMBRANES CURRENT AND FUTURE TYPE ANALYSIS, 2025–2034, (USD MILLION)
FIGURE 50 COLUMBIA INDUSTRIAL SOLVENT SEPARATION MEMBRANES CURRENT AND FUTURE END USER ANALYSIS, 2025–2034, (USD MILLION)
FIGURE 51 REST OF LATIN AMERICA INDUSTRIAL SOLVENT SEPARATION MEMBRANES CURRENT AND FUTURE TYPE ANALYSIS, 2025–2034, (USD MILLION)
FIGURE 52 REST OF LATIN AMERICA INDUSTRIAL SOLVENT SEPARATION MEMBRANES CURRENT AND FUTURE END USER ANALYSIS, 2025–2034, (USD MILLION)
FIGURE 53 EASTERN EUROPE INDUSTRIAL SOLVENT SEPARATION MEMBRANES CURRENT AND FUTURE MARKET VOLUME SHARE REGIONAL ANALYSIS, 2025–2034, (USD MILLION)
FIGURE 54 POLAND INDUSTRIAL SOLVENT SEPARATION MEMBRANES CURRENT AND FUTURE TYPE ANALYSIS, 2025–2034, (USD MILLION)
FIGURE 55 POLAND INDUSTRIAL SOLVENT SEPARATION MEMBRANES CURRENT AND FUTURE END USER ANALYSIS, 2025–2034, (USD MILLION)
FIGURE 56 RUSSIA INDUSTRIAL SOLVENT SEPARATION MEMBRANES CURRENT AND FUTURE TYPE ANALYSIS, 2025–2034, (USD MILLION)
FIGURE 57 RUSSIA INDUSTRIAL SOLVENT SEPARATION MEMBRANES CURRENT AND FUTURE END USER ANALYSIS, 2025–2034, (USD MILLION)
FIGURE 58 CZECH REPUBLIC INDUSTRIAL SOLVENT SEPARATION MEMBRANES CURRENT AND FUTURE TYPE ANALYSIS, 2025–2034, (USD MILLION)
FIGURE 59 CZECH REPUBLIC INDUSTRIAL SOLVENT SEPARATION MEMBRANES CURRENT AND FUTURE END USER ANALYSIS, 2025–2034, (USD MILLION)
FIGURE 60 ROMANIA INDUSTRIAL SOLVENT SEPARATION MEMBRANES CURRENT AND FUTURE TYPE ANALYSIS, 2025–2034, (USD MILLION)
FIGURE 61 ROMANIA INDUSTRIAL SOLVENT SEPARATION MEMBRANES CURRENT AND FUTURE END USER ANALYSIS, 2025–2034, (USD MILLION)
FIGURE 62 REST OF EASTERN EUROPE INDUSTRIAL SOLVENT SEPARATION MEMBRANES CURRENT AND FUTURE TYPE ANALYSIS, 2025–2034, (USD MILLION)
FIGURE 63 REST OF EASTERN EUROPE INDUSTRIAL SOLVENT SEPARATION MEMBRANES CURRENT AND FUTURE END USER ANALYSIS, 2025–2034, (USD MILLION)
FIGURE 64 WESTERN EUROPE INDUSTRIAL SOLVENT SEPARATION MEMBRANES CURRENT AND FUTURE MARKET VOLUME SHARE REGIONAL ANALYSIS, 2025–2034, (USD MILLION)
FIGURE 65 GERMANY INDUSTRIAL SOLVENT SEPARATION MEMBRANES CURRENT AND FUTURE TYPE ANALYSIS, 2025–2034, (USD MILLION)
FIGURE 66 GERMANY INDUSTRIAL SOLVENT SEPARATION MEMBRANES CURRENT AND FUTURE END USER ANALYSIS, 2025–2034, (USD MILLION)
FIGURE 67 FRANCE INDUSTRIAL SOLVENT SEPARATION MEMBRANES CURRENT AND FUTURE TYPE ANALYSIS, 2025–2034, (USD MILLION)
FIGURE 68 FRANCE INDUSTRIAL SOLVENT SEPARATION MEMBRANES CURRENT AND FUTURE END USER ANALYSIS, 2025–2034, (USD MILLION)
FIGURE 69 UK INDUSTRIAL SOLVENT SEPARATION MEMBRANES CURRENT AND FUTURE TYPE ANALYSIS, 2025–2034, (USD MILLION)
FIGURE 70 UK INDUSTRIAL SOLVENT SEPARATION MEMBRANES CURRENT AND FUTURE END USER ANALYSIS, 2025–2034, (USD MILLION)
FIGURE 71 SPAIN INDUSTRIAL SOLVENT SEPARATION MEMBRANES CURRENT AND FUTURE TYPE ANALYSIS, 2025–2034, (USD MILLION)
FIGURE 72 SPAIN INDUSTRIAL SOLVENT SEPARATION MEMBRANES CURRENT AND FUTURE END USER ANALYSIS, 2025–2034, (USD MILLION)
FIGURE 73 ITALY INDUSTRIAL SOLVENT SEPARATION MEMBRANES CURRENT AND FUTURE TYPE ANALYSIS, 2025–2034, (USD MILLION)
FIGURE 74 ITALY INDUSTRIAL SOLVENT SEPARATION MEMBRANES CURRENT AND FUTURE END USER ANALYSIS, 2025–2034, (USD MILLION)
FIGURE 75 REST OF WESTERN EUROPE INDUSTRIAL SOLVENT SEPARATION MEMBRANES CURRENT AND FUTURE TYPE ANALYSIS, 2025–2034, (USD MILLION)
FIGURE 76 REST OF WESTERN EUROPE INDUSTRIAL SOLVENT SEPARATION MEMBRANES CURRENT AND FUTURE END USER ANALYSIS, 2025–2034, (USD MILLION)
FIGURE 77 EAST ASIA AND PACIFIC INDUSTRIAL SOLVENT SEPARATION MEMBRANES CURRENT AND FUTURE MARKET VOLUME SHARE REGIONAL ANALYSIS, 2025–2034, (USD MILLION)
FIGURE 78 CHINA INDUSTRIAL SOLVENT SEPARATION MEMBRANES CURRENT AND FUTURE TYPE ANALYSIS, 2025–2034, (USD MILLION)
FIGURE 79 CHINA INDUSTRIAL SOLVENT SEPARATION MEMBRANES CURRENT AND FUTURE END USER ANALYSIS, 2025–2034, (USD MILLION)
FIGURE 80 JAPAN INDUSTRIAL SOLVENT SEPARATION MEMBRANES CURRENT AND FUTURE TYPE ANALYSIS, 2025–2034, (USD MILLION)
FIGURE 81 JAPAN INDUSTRIAL SOLVENT SEPARATION MEMBRANES CURRENT AND FUTURE END USER ANALYSIS, 2025–2034, (USD MILLION)
FIGURE 82 AUSTRALIA INDUSTRIAL SOLVENT SEPARATION MEMBRANES CURRENT AND FUTURE TYPE ANALYSIS, 2025–2034, (USD MILLION)
FIGURE 83 AUSTRALIA INDUSTRIAL SOLVENT SEPARATION MEMBRANES CURRENT AND FUTURE END USER ANALYSIS, 2025–2034, (USD MILLION)
FIGURE 84 CAMBODIA INDUSTRIAL SOLVENT SEPARATION MEMBRANES CURRENT AND FUTURE TYPE ANALYSIS, 2025–2034, (USD MILLION)
FIGURE 85 CAMBODIA INDUSTRIAL SOLVENT SEPARATION MEMBRANES CURRENT AND FUTURE END USER ANALYSIS, 2025–2034, (USD MILLION)
FIGURE 86 FIJI INDUSTRIAL SOLVENT SEPARATION MEMBRANES CURRENT AND FUTURE TYPE ANALYSIS, 2025–2034, (USD MILLION)
FIGURE 87 FIJI INDUSTRIAL SOLVENT SEPARATION MEMBRANES CURRENT AND FUTURE END USER ANALYSIS, 2025–2034, (USD MILLION)
FIGURE 88 INDONESIA INDUSTRIAL SOLVENT SEPARATION MEMBRANES CURRENT AND FUTURE TYPE ANALYSIS, 2025–2034, (USD MILLION)
FIGURE 89 INDONESIA INDUSTRIAL SOLVENT SEPARATION MEMBRANES CURRENT AND FUTURE END USER ANALYSIS, 2025–2034, (USD MILLION)
FIGURE 90 SOUTH KOREA INDUSTRIAL SOLVENT SEPARATION MEMBRANES CURRENT AND FUTURE TYPE ANALYSIS, 2025–2034, (USD MILLION)
FIGURE 91 SOUTH KOREA INDUSTRIAL SOLVENT SEPARATION MEMBRANES CURRENT AND FUTURE END USER ANALYSIS, 2025–2034, (USD MILLION)
FIGURE 92 REST OF EAST ASIA AND PACIFIC INDUSTRIAL SOLVENT SEPARATION MEMBRANES CURRENT AND FUTURE TYPE ANALYSIS, 2025–2034, (USD MILLION)
FIGURE 93 REST OF EAST ASIA AND PACIFIC INDUSTRIAL SOLVENT SEPARATION MEMBRANES CURRENT AND FUTURE END USER ANALYSIS, 2025–2034, (USD MILLION)
FIGURE 94 SEA AND SOUTH ASIA INDUSTRIAL SOLVENT SEPARATION MEMBRANES CURRENT AND FUTURE MARKET VOLUME SHARE REGIONAL ANALYSIS, 2025–2034, (USD MILLION)
FIGURE 95 BANGLADESH INDUSTRIAL SOLVENT SEPARATION MEMBRANES CURRENT AND FUTURE TYPE ANALYSIS, 2025–2034, (USD MILLION)
FIGURE 96 BANGLADESH INDUSTRIAL SOLVENT SEPARATION MEMBRANES CURRENT AND FUTURE END USER ANALYSIS, 2025–2034, (USD MILLION)
FIGURE 97 NEW ZEALAND INDUSTRIAL SOLVENT SEPARATION MEMBRANES CURRENT AND FUTURE TYPE ANALYSIS, 2025–2034, (USD MILLION)
FIGURE 98 NEW ZEALAND INDUSTRIAL SOLVENT SEPARATION MEMBRANES CURRENT AND FUTURE END USER ANALYSIS, 2025–2034, (USD MILLION)
FIGURE 99 INDIA INDUSTRIAL SOLVENT SEPARATION MEMBRANES CURRENT AND FUTURE TYPE ANALYSIS, 2025–2034, (USD MILLION)
FIGURE 100 INDIA INDUSTRIAL SOLVENT SEPARATION MEMBRANES CURRENT AND FUTURE END USER ANALYSIS, 2025–2034, (USD MILLION)
FIGURE 101 SINGAPORE INDUSTRIAL SOLVENT SEPARATION MEMBRANES CURRENT AND FUTURE TYPE ANALYSIS, 2025–2034, (USD MILLION)
FIGURE 102 SINGAPORE INDUSTRIAL SOLVENT SEPARATION MEMBRANES CURRENT AND FUTURE END USER ANALYSIS, 2025–2034, (USD MILLION)
FIGURE 103 THAILAND INDUSTRIAL SOLVENT SEPARATION MEMBRANES CURRENT AND FUTURE TYPE ANALYSIS, 2025–2034, (USD MILLION)
FIGURE 104 THAILAND INDUSTRIAL SOLVENT SEPARATION MEMBRANES CURRENT AND FUTURE END USER ANALYSIS, 2025–2034, (USD MILLION)
FIGURE 105 TAIWAN INDUSTRIAL SOLVENT SEPARATION MEMBRANES CURRENT AND FUTURE TYPE ANALYSIS, 2025–2034, (USD MILLION)
FIGURE 106 TAIWAN INDUSTRIAL SOLVENT SEPARATION MEMBRANES CURRENT AND FUTURE END USER ANALYSIS, 2025–2034, (USD MILLION)
FIGURE 107 MALAYSIA INDUSTRIAL SOLVENT SEPARATION MEMBRANES CURRENT AND FUTURE TYPE ANALYSIS, 2025–2034, (USD MILLION)
FIGURE 108 MALAYSIA INDUSTRIAL SOLVENT SEPARATION MEMBRANES CURRENT AND FUTURE END USER ANALYSIS, 2025–2034, (USD MILLION)
FIGURE 109 REST OF SEA AND SOUTH ASIA INDUSTRIAL SOLVENT SEPARATION MEMBRANES CURRENT AND FUTURE TYPE ANALYSIS, 2025–2034, (USD MILLION)
FIGURE 110 REST OF SEA AND SOUTH ASIA INDUSTRIAL SOLVENT SEPARATION MEMBRANES CURRENT AND FUTURE END USER ANALYSIS, 2025–2034, (USD MILLION)
FIGURE 111 MIDDLE EAST AND AFRICA INDUSTRIAL SOLVENT SEPARATION MEMBRANES CURRENT AND FUTURE MARKET VOLUME SHARE REGIONAL ANALYSIS, 2025–2034, (USD MILLION)
FIGURE 112 GCC COUNTRIES INDUSTRIAL SOLVENT SEPARATION MEMBRANES CURRENT AND FUTURE TYPE ANALYSIS, 2025–2034, (USD MILLION)
FIGURE 113 GCC COUNTRIES INDUSTRIAL SOLVENT SEPARATION MEMBRANES CURRENT AND FUTURE END USER ANALYSIS, 2025–2034, (USD MILLION)
FIGURE 114 SAUDI ARABIA INDUSTRIAL SOLVENT SEPARATION MEMBRANES CURRENT AND FUTURE TYPE ANALYSIS, 2025–2034, (USD MILLION)
FIGURE 115 SAUDI ARABIA INDUSTRIAL SOLVENT SEPARATION MEMBRANES CURRENT AND FUTURE END USER ANALYSIS, 2025–2034, (USD MILLION)
FIGURE 116 UAE INDUSTRIAL SOLVENT SEPARATION MEMBRANES CURRENT AND FUTURE TYPE ANALYSIS, 2025–2034, (USD MILLION)
FIGURE 117 UAE INDUSTRIAL SOLVENT SEPARATION MEMBRANES CURRENT AND FUTURE END USER ANALYSIS, 2025–2034, (USD MILLION)
FIGURE 118 BAHRAIN INDUSTRIAL SOLVENT SEPARATION MEMBRANES CURRENT AND FUTURE TYPE ANALYSIS, 2025–2034, (USD MILLION)
FIGURE 119 BAHRAIN INDUSTRIAL SOLVENT SEPARATION MEMBRANES CURRENT AND FUTURE END USER ANALYSIS, 2025–2034, (USD MILLION)
FIGURE 120 KUWAIT INDUSTRIAL SOLVENT SEPARATION MEMBRANES CURRENT AND FUTURE TYPE ANALYSIS, 2025–2034, (USD MILLION)
FIGURE 121 KUWAIT INDUSTRIAL SOLVENT SEPARATION MEMBRANES CURRENT AND FUTURE END USER ANALYSIS, 2025–2034, (USD MILLION)
FIGURE 122 OMAN INDUSTRIAL SOLVENT SEPARATION MEMBRANES CURRENT AND FUTURE TYPE ANALYSIS, 2025–2034, (USD MILLION)
FIGURE 123 OMAN INDUSTRIAL SOLVENT SEPARATION MEMBRANES CURRENT AND FUTURE END USER ANALYSIS, 2025–2034, (USD MILLION)
FIGURE 124 QATAR INDUSTRIAL SOLVENT SEPARATION MEMBRANES CURRENT AND FUTURE TYPE ANALYSIS, 2025–2034, (USD MILLION)
FIGURE 125 QATAR INDUSTRIAL SOLVENT SEPARATION MEMBRANES CURRENT AND FUTURE END USER ANALYSIS, 2025–2034, (USD MILLION)
FIGURE 126 EGYPT INDUSTRIAL SOLVENT SEPARATION MEMBRANES CURRENT AND FUTURE TYPE ANALYSIS, 2025–2034, (USD MILLION)
FIGURE 127 EGYPT INDUSTRIAL SOLVENT SEPARATION MEMBRANES CURRENT AND FUTURE END USER ANALYSIS, 2025–2034, (USD MILLION)
FIGURE 128 NIGERIA INDUSTRIAL SOLVENT SEPARATION MEMBRANES CURRENT AND FUTURE TYPE ANALYSIS, 2025–2034, (USD MILLION)
FIGURE 129 NIGERIA INDUSTRIAL SOLVENT SEPARATION MEMBRANES CURRENT AND FUTURE END USER ANALYSIS, 2025–2034, (USD MILLION)
FIGURE 130 SOUTH AFRICA INDUSTRIAL SOLVENT SEPARATION MEMBRANES CURRENT AND FUTURE TYPE ANALYSIS, 2025–2034, (USD MILLION)
FIGURE 131 SOUTH AFRICA INDUSTRIAL SOLVENT SEPARATION MEMBRANES CURRENT AND FUTURE END USER ANALYSIS, 2025–2034, (USD MILLION)
FIGURE 132 ISRAEL INDUSTRIAL SOLVENT SEPARATION MEMBRANES CURRENT AND FUTURE TYPE ANALYSIS, 2025–2034, (USD MILLION)
FIGURE 133 ISRAEL INDUSTRIAL SOLVENT SEPARATION MEMBRANES CURRENT AND FUTURE END USER ANALYSIS, 2025–2034, (USD MILLION)
FIGURE 134 REST OF MEA INDUSTRIAL SOLVENT SEPARATION MEMBRANES CURRENT AND FUTURE TYPE ANALYSIS, 2025–2034, (USD MILLION)
FIGURE 135 REST OF MEA INDUSTRIAL SOLVENT SEPARATION MEMBRANES CURRENT AND FUTURE END USER ANALYSIS, 2025–2034, (USD MILLION)
FIGURE 136 U. S. MARKET SHARE ANALYSIS BY TYPE (2024)
FIGURE 137 U. S. MARKET SHARE ANALYSIS BY END USER (2024)
FIGURE 138 CANADA MARKET SHARE ANALYSIS BY TYPE (2024)
FIGURE 139 CANADA MARKET SHARE ANALYSIS BY END USER (2024)
FIGURE 140 MEXICO MARKET SHARE ANALYSIS BY TYPE (2024)
FIGURE 141 MEXICO MARKET SHARE ANALYSIS BY END USER (2024)
FIGURE 142 CHINA MARKET SHARE ANALYSIS BY TYPE (2024)
FIGURE 143 CHINA MARKET SHARE ANALYSIS BY END USER (2024)
FIGURE 144 JAPAN MARKET SHARE ANALYSIS BY TYPE (2024)
FIGURE 145 JAPAN MARKET SHARE ANALYSIS BY END USER (2024)
FIGURE 146 INDIA MARKET SHARE ANALYSIS BY TYPE (2024)
FIGURE 147 INDIA MARKET SHARE ANALYSIS BY END USER (2024)
FIGURE 148 SOUTH KOREA MARKET SHARE ANALYSIS BY TYPE (2024)
FIGURE 149 SOUTH KOREA MARKET SHARE ANALYSIS BY END USER (2024)
FIGURE 150 SAUDI ARABIA MARKET SHARE ANALYSIS BY TYPE (2024)
FIGURE 151 SAUDI ARABIA MARKET SHARE ANALYSIS BY END USER (2024)
FIGURE 152 UAE MARKET SHARE ANALYSIS BY TYPE (2024)
FIGURE 153 UAE MARKET SHARE ANALYSIS BY END USER (2024)
FIGURE 154 EGYPT MARKET SHARE ANALYSIS BY TYPE (2024)
FIGURE 155 EGYPT MARKET SHARE ANALYSIS BY END USER (2024)
FIGURE 156 NIGERIA MARKET SHARE ANALYSIS BY TYPE (2024)
FIGURE 157 NIGERIA MARKET SHARE ANALYSIS BY END USER (2024)
FIGURE 158 SOUTH AFRICA MARKET SHARE ANALYSIS BY TYPE (2024)
FIGURE 159 SOUTH AFRICA MARKET SHARE ANALYSIS BY END USER (2024)
FIGURE 160 GERMANY MARKET SHARE ANALYSIS BY TYPE (2024)
FIGURE 161 GERMANY MARKET SHARE ANALYSIS BY END USER (2024)
FIGURE 162 FRANCE MARKET SHARE ANALYSIS BY TYPE (2024)
FIGURE 163 FRANCE MARKET SHARE ANALYSIS BY END USER (2024)
FIGURE 164 UK MARKET SHARE ANALYSIS BY TYPE (2024)
FIGURE 165 UK MARKET SHARE ANALYSIS BY END USER (2024)
FIGURE 166 SPAIN MARKET SHARE ANALYSIS BY TYPE (2024)
FIGURE 167 SPAIN MARKET SHARE ANALYSIS BY END USER (2024)
FIGURE 168 ITALY MARKET SHARE ANALYSIS BY TYPE (2024)
FIGURE 169 ITALY MARKET SHARE ANALYSIS BY END USER (2024)
FIGURE 170 BRAZIL MARKET SHARE ANALYSIS BY TYPE (2024)
FIGURE 171 BRAZIL MARKET SHARE ANALYSIS BY END USER (2024)
FIGURE 172 ARGENTINA MARKET SHARE ANALYSIS BY TYPE (2024)
FIGURE 173 ARGENTINA MARKET SHARE ANALYSIS BY END USER (2024)
FIGURE 174 COLUMBIA MARKET SHARE ANALYSIS BY TYPE (2024)
FIGURE 175 COLUMBIA MARKET SHARE ANALYSIS BY END USER (2024)
FIGURE 176 GLOBAL INDUSTRIAL SOLVENT SEPARATION MEMBRANES CURRENT AND FUTURE MARKET KEY COUNTRY LEVEL ANALYSIS, 2024–2034, (USD MILLION)
FIGURE 177 FINANCIAL OVERVIEW:
Key Player Analysis
Evonik Industries AG: Evonik positions itself as a market leader in high-performance membrane materials, particularly within solvent-stable polymer membranes. The company’s portfolio includes polyimide- and polyether-based membranes tailored for organic solvent nanofiltration (OSN), targeting demanding applications in chemicals, pharmaceuticals, and petrochemicals. As of 2025, Evonik has expanded its membrane business by integrating advanced polymer R&D with in-house application testing, enabling faster deployment of industry-specific solutions.
Strategically, Evonik is strengthening its regional footprint in Asia-Pacific, supported by recent investments in membrane production facilities in Singapore and China. The company is also pursuing sustainability objectives, with new solvent recovery membranes that reduce energy use by up to 50% compared to thermal separation methods. By leveraging its chemical expertise and vertically integrated supply chain, Evonik remains a preferred partner for industries seeking durable, high-throughput membrane solutions under aggressive operating conditions.
Novamem Ltd.: Novamem operates as a niche innovator, focusing on precision membrane technologies for specialized applications. Known for its nanofiltration and microfiltration solutions, the Swiss-based company has developed solvent-resistant membranes used across small- to mid-scale chemical and bioprocessing operations. In 2025, Novamem continues to gain traction in Europe and North America, supported by partnerships with contract manufacturers and biotech firms.
A key differentiator is Novamem’s modular membrane platform that allows for custom-engineered performance based on solvent compatibility and selectivity requirements. The company has also made strategic moves in digital manufacturing, incorporating AI-driven modeling tools to predict membrane lifespan and fouling rates. This precision-driven approach positions Novamem as a preferred choice for high-value, small-batch separation use cases where customization and quality control are critical.
Pall Corporation: Pall Corporation maintains a strong challenger position, with an expanding footprint in solvent separation for the pharmaceutical and food processing sectors. Its broad product line includes ultrafiltration and nanofiltration systems designed for high-purity solvent recovery, with installations across the U.S., Japan, and Germany. In 2025, Pall has emphasized its investment in automation and process integration, rolling out membrane units equipped with real-time monitoring and automated cleaning systems.
The company’s strategic focus lies in end-to-end process efficiency. Through its parent company, Danaher, Pall benefits from cross-portfolio synergies in analytics, filtration, and water treatment. This integrated capability supports its value proposition in regulated industries, where traceability and compliance are non-negotiable. Ongoing collaborations with biopharma manufacturers further reinforce Pall’s credibility in delivering validated, GMP-compliant solvent separation solutions.
Sartorius AG: Sartorius is an emerging force in the industrial solvent separation membranes market, leveraging its strength in bioprocessing to expand into high-performance membrane applications. The company’s core offerings include solvent-tolerant ultrafiltration and OSN systems tailored for pharmaceutical R&D and pilot-scale production. By 2025, Sartorius has increased its investment in Asia and North America, supported by local partnerships and facility upgrades.
A key strength is Sartorius’ integration of digital tools, including membrane performance dashboards and predictive maintenance software. These tools allow users to reduce downtime and improve process yield. Sartorius also differentiates itself through its sustainability roadmap, targeting a 30% reduction in water and solvent waste across its customer base by 2028. Its growing role in contract development and manufacturing organizations (CDMOs) positions it well for expanded demand from the pharmaceutical and specialty chemical sectors.
As of 2025, industrial growth is driving a structural shift toward cleaner, more efficient separation technologies. Traditional solvent recovery methods like distillation account for nearly 6% of global carbon emissions and consume significant energy. In contrast, membrane-based technologies—including Organic Solvent Nanofiltration (OSN), vapor permeation (VP), and pervaporation—offer energy savings of up to 90%, depending on the application. For example, ExxonMobil’s W.R. Grace Field unit reported a 20% cut in energy consumption using membrane processes, alongside substantial reductions in water usage and greenhouse gas emissions.
Regulatory Push and Advanced Materials Strengthen Membrane Adoption
With regulatory bodies such as the U.S. Department of Energy pushing for industrial decarbonization by 2035, solvent separation membranes are becoming strategic assets. Advancements in polymer, ceramic, and metal-organic framework membranes are enhancing solvent resistance and operational lifespan. These developments are not only reducing production costs but also positioning membrane technologies as essential for compliance, sustainability, and operational efficiency across industries such as chemicals, pharmaceuticals, and food processing.
Restraint:
Material Limitations Restrict Adoption in Harsh Solvent Environments
Despite growing demand, material limitations continue to hinder widespread adoption of solvent separation membranes. Most commercially available membranes lack the chemical stability required to function in harsh organic solvent environments, especially under high-pressure nanofiltration conditions. As of 2025, more than 60% of industrial membranes in use are based on conventional polymers, which degrade rapidly in aggressive solvent systems.
Performance Degradation Slows Penetration in High-Value Industries
This lack of solvent-stable membrane materials restricts deployment in key sectors such as petrochemicals and pharmaceuticals, where long-term performance and chemical resistance are non-negotiable. The result is a slower market expansion rate in high-value, solvent-intensive applications. Manufacturers are under increasing pressure to accelerate development of durable, high-performance materials that can withstand repeated exposure to complex solvent mixtures without compromising separation efficiency.
Opportunity:
Food & Beverage Sector Emerging as a High-Growth Application Area
The food and beverage industry is emerging as a high-impact growth segment for solvent separation membranes. Applications such as de-alcoholization of beer, whey protein concentration, and vinegar filtration are expanding rapidly, driven by demand for cleaner production methods and regulatory compliance. By 2025, membrane technologies in the food sector are projected to grow at a CAGR of over 9%, supported by increased adoption of nanofiltration and ultrafiltration in dairy and beverage processing.
Membranes Enable Energy Savings and Cleaner Processing Workflows
In addition to improving product quality, membranes help reduce water and energy consumption—critical concerns in modern food manufacturing. Their ability to eliminate heat-based processing while maintaining flavor and nutrient integrity makes them well-suited for temperature-sensitive applications. As sustainability targets become more aggressive, food manufacturers are investing in membrane systems to enhance operational efficiency, reduce waste, and meet rising consumer expectations for transparency and environmental responsibility.
Trend:
Rise of Solvent-Stable Nanofiber Membranes Transforming OSN
A major trend reshaping the market in 2025 is the development of solvent-stable nanofiber membranes, particularly for Organic Solvent Nanofiltration (OSN) applications. These membranes combine high porosity with structural integrity, making them ideal for filtering small molecules in aggressive solvents. Adoption is accelerating in sectors such as petrochemicals, natural extract processing, and pharmaceutical purification, where precision and solvent compatibility are critical.
Advanced Fabrication & Surface Engineering Boost Durability and Performance
New fabrication methods—including interfacial polymerization and thermal phase separation—are enhancing membrane durability and performance. Companies are also investing in surface modifications like polymer crosslinking to extend membrane life and improve chemical resistance. These advancements are lowering total cost of ownership while opening new application areas. As industries demand higher throughput and solvent recovery rates, nanofiber membranes are expected to become a key driver of long-term market growth.
Recent Developments
Dec 2024 – Evonik Industries AG: Evonik expanded its solvent-stable membrane production facility in Singapore, adding a new line focused on polymer-based nanofiltration membranes. The upgrade is expected to increase regional capacity by 30% and reduce lead times across Asia-Pacific. This move strengthens Evonik’s supply chain resilience and enhances its position in high-growth Asian markets.
Feb 2025 – Pall Corporation: Pall launched its SolvaSure™ Series, a new line of solvent-specific nanofiltration modules designed for the pharmaceutical and electronics industries. Initial adoption among U.S. contract manufacturing firms has exceeded 15% in Q1 2025. The launch reinforces Pall’s focus on solvent recovery in regulated, high-purity environments.
Apr 2025 – Novamem Ltd.: Novamem announced a strategic partnership with a European biotech consortium to co-develop modular solvent filtration units for pilot-scale labs. The collaboration, valued at USD 8.5 million, aims to accelerate the use of nanofiltration in small-batch chemical synthesis. This partnership enhances Novamem’s reach into high-margin, research-intensive segments.
Jul 2025 – Sartorius AG: Sartorius opened a new membrane R&D center in Boston, USA, focused on high-selectivity membranes for organic solvents. The facility is expected to house over 40 researchers and support collaborations with local biotech firms and universities. This investment strengthens Sartorius' technology pipeline and presence in the U.S. pharmaceutical supply chain.
Sep 2025 – Toray Industries, Inc.: Toray entered the industrial solvent membrane market with the launch of its Toraflux™ OSN series, targeting solvent recovery in the chemical and agrochemical sectors. The membranes demonstrated 25% higher flux compared to conventional OSN units in initial field trials. This marks Toray’s entry into a growing niche, signaling increased competition and technology diversification in the global market