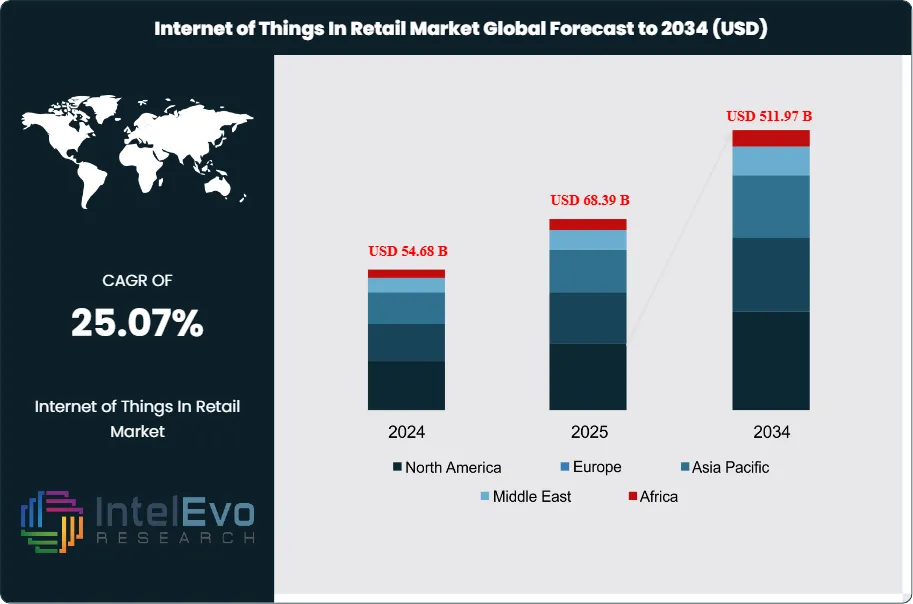
The Internet of Things in Retail Market size is expected to be worth around USD 511.97 Billion by 2034, up from USD 54.68 Billion in 2024, growing at a CAGR of 25.07% during the forecast period from 2024 to 2034. This rapid expansion is driven by widespread adoption of smart shelves, RFID-enabled inventory management, connected point-of-sale systems, and real-time customer analytics. As retailers prioritize omnichannel experiences, loss prevention, and data-driven merchandising, IoT-enabled retail ecosystems are becoming central to digital-first store transformation and competitive differentiation globally.
The Internet of Things (IoT) in retail market represents a transformative technological ecosystem that integrates connected devices, sensors, and digital platforms to revolutionize traditional retail operations. This market encompasses hardware components, software platforms, and services that enable real-time data collection, analysis, and automation across various retail touchpoints. The global IoT in retail market is demonstrating exceptional growth potential driven by digital transformation initiatives and evolving consumer expectations.
Key factors affecting the market include the increasing adoption of omnichannel retail strategies, rising demand for personalized shopping experiences, and the need for operational efficiency through automated inventory management and supply chain optimization. The proliferation of smartphones, improved internet connectivity, and the advent of 5G technology are creating favorable conditions for IoT deployment in retail environments. Additionally, the COVID-19 pandemic has accelerated digital adoption, with retailers seeking contactless solutions and enhanced customer analytics to navigate changing consumer behaviors and preferences.
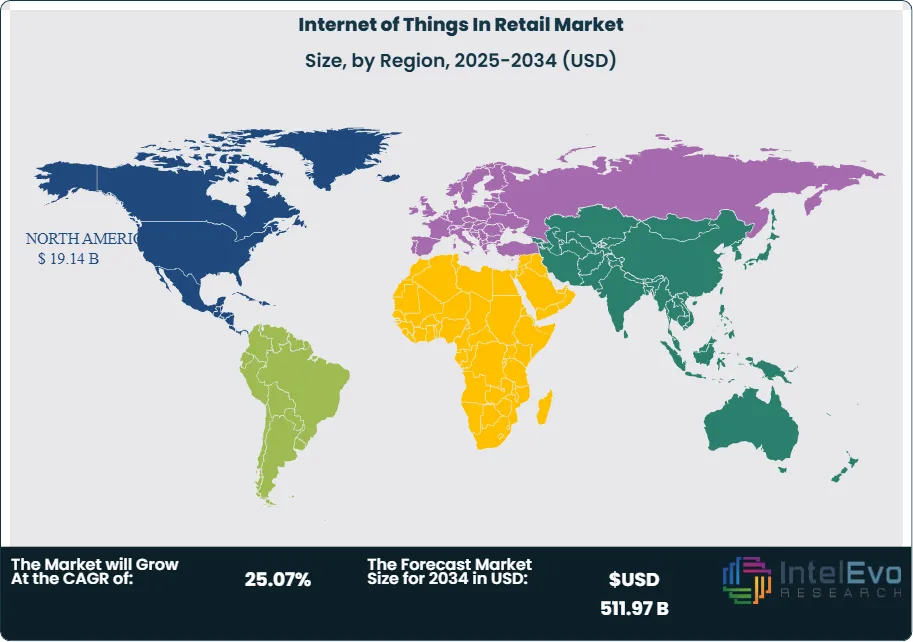
Regional Analysis: North America IoT in Retail Market hold the largest market share owing to the presence of major players, increasing adoption of advanced technologies in the retail sector, and tech-savvy consumer base. The region benefits from mature retail infrastructure, favorable regulatory environment, and strong consumer demand for personalized experiences, positioning it as the global leader in IoT retail adoption.
The pandemic significantly accelerated IoT adoption in retail as businesses sought to minimize human contact, automate operations, and gain deeper insights into rapidly changing consumer behaviors. Retailers implemented contactless payment systems, automated inventory management, and enhanced customer tracking solutions to maintain operations during lockdowns. The crisis highlighted the importance of digital transformation and real-time data analytics, driving increased investments in IoT infrastructure and creating new opportunities for market expansion.
Global trade tensions and regional conflicts, particularly between major economies like the US and China, have created challenges for IoT retail market growth through supply chain disruptions and increased tariffs on electronic components. These geopolitical factors have forced retailers to diversify their technology suppliers and consider regional manufacturing options, potentially increasing costs but also driving innovation in local IoT solutions. Trade restrictions on semiconductor components and telecommunications equipment have impacted the availability and pricing of IoT devices, leading to strategic shifts in vendor relationships and technology partnerships within the retail sector.
Key Takeaways
MarketGrowth: The Internet of Things In Retail Market is expected to reach USD 511.97 Billion by 2034, due to increased digitalization and customer-centric strategies.
ComponentDominance: Hardware components dominate the market due to high demand for sensors, beacons, and RFID systems for smart inventory and customer tracking.
Technology Dominance: Near Field Communication (NFC) leads the technology segment, enabling fast, secure, and contactless transactions.
Deployment Dominance: Cloud deployment holds the largest market share owing to scalability, cost-effectiveness, and remote accessibility.
Application Dominance: Operations management is the leading application, leveraging IoT for real-time monitoring, asset tracking, and process automation.
Driver: The increasing demand for personalized shopping experiences is a major driver, prompting investments in IoT-powered analytics.
Restraint: Concerns over data privacy and high implementation costs are significant barriers to widespread adoption.
Opportunity: The rise in omni channel retailing and integration of AI with IoT devices offer strong growth opportunities.
Trend: Retailers are adopting smart shelves, digital signage, and customer engagement platforms driven by real-time analytics.
RegionalAnalysis: North America remains the leader due to a mature retail ecosystem and early technology adoption, while Asia-Pacific is the fastest-growing market.
Component Analysis:
Hardware forms the backbone of IoT infrastructure in retail. This includes sensors, RFID tags, beacons, cameras, and connected point-of-sale systems. The proliferation of cost-efficient, compact, and intelligent sensors has made hardware the largest revenue-generating component in the IoT retail ecosystem. Retailers are increasingly deploying hardware for real-time inventory monitoring, store surveillance, and customer behavior analytics. RFID tags help manage stock levels, reduce theft, and enable seamless checkout experiences. Smart shelves with weight sensors alert when products need restocking, minimizing manual interventions. These applications underline the indispensable role of hardware in transforming traditional retail models.
Technology Analysis:
Near Field Communication (NFC) technology leads the technology segment due to its wide use in mobile payments and customer interaction. NFC allows short-range communication between compatible devices, which is essential for secure and contactless transactions. The rise of digital wallets like Apple Pay and Google Pay has fueled the demand for NFC-enabled systems in stores. Additionally, NFC is used in loyalty programs, product information delivery, and in-store navigation, enhancing customer engagement. Its low power consumption, fast connectivity, and easy integration with mobile apps make it highly suitable for retail environments.
Deployment Analysis:
Cloud-based deployment models dominate due to their scalability, remote accessibility, and cost-efficiency. Cloud solutions allow centralized data management, real-time analytics, and easy integration with mobile and web-based applications. Retailers can quickly scale services based on demand and ensure business continuity with minimal IT overhead. Cloud platforms also facilitate remote monitoring and control of in-store devices, which is crucial for geographically distributed operations. The ongoing shift towards Software-as-a-Service (SaaS) and Platform-as-a-Service (PaaS) models further supports cloud adoption.
Application Analysis:
Operations Management Leads With nearly 37% Market Share In Internet of Things In Retail Market
Operations management is the most significant application of IoT in retail, leveraging connected devices to streamline workflows, automate inventory systems, and monitor equipment health. Retailers deploy IoT solutions for predictive maintenance, energy optimization, and real-time asset tracking. Smart HVAC systems, lighting controls, and refrigeration monitoring help reduce operational costs. Additionally, IoT supports dynamic staffing and automated supply replenishment, improving efficiency and reducing downtime. Operations management not only improves backend processes but also ensures better customer experiences through efficient service delivery.
Region Analysis:
North America Leads With over 35% Market Share In Internet of Things In Retail Market. North America leads the global IoT in retail market, holding the largest market share due to the presence of major players, increasing adoption of advanced technologies in the retail sector, and a tech-savvy consumer base. The region's mature retail infrastructure, favorable regulatory environment, and strong consumer demand for personalized experiences create optimal conditions for IoT adoption. The widespread availability of high-speed internet and rapid cloud adoption create a strong foundation for IoT devices, with leading IoT technology providers in the region driving innovation and accessibility in the retail sector.
Europe represents the second-largest market, driven by stringent data privacy regulations that, while creating compliance challenges, also build consumer trust in IoT solutions. The region's focus on sustainability and energy efficiency aligns with IoT capabilities for optimizing resource usage and reducing waste. Asia-Pacific shows the highest growth potential due to rapid urbanization, expanding middle class populations, and increasing smartphone penetration. Countries like China and India are investing heavily in digital infrastructure, creating opportunities for IoT retail solutions.
Component (Services, Hardware - leads, Platform), Technology (Zigbee, Bluetooth Low Energy, Near Field Communication - leads, Others), Deployment (Cloud - leads, On-Premises), Application (Operations Management - leads, Advertising and Marketing, Customer Management, Asset Management, Others)
Research Methodology
Primary Research- 100 Interviews of Stakeholders
Secondary Research
Desk Research
Regional scope
North America (United States, Canada, Mexico)
Latin America (Brazil, Argentina, Columbia)
East Asia And Pacific (China, Japan, South Korea, Australia, Cambodia, Fiji, Indonesia)
Sea And South Asia (India, Singapore, Thailand, Taiwan, Malaysia)
Eastern Europe (Poland, Russia, Czech Republic, Romania)
Western Europe (Germany, U.K., France, Spain, Itlay)
Middle East & Africa (GCC Countries, Egypt, Nigeria, South Africa, Israel)
Competitive Landscape
Losant IoT, Cisco Systems Inc., IBM Corporation, Arm Limited, Intel Corporation, Verizon Communications Inc., SAP SE, Microsoft Corporation, Google LLC, NXP Semiconductors., Oracle Corporation, RETAILNEXT, INC., PTC Inc., Zebra Technologies Corp.
Customization Scope
Customization for segments, region/country-level will be provided. Moreover, additional customization can be done based on the requirements.
Pricing and Purchase Options
Avail customized purchase options to meet your exact research needs. We have three licenses to opt for: Single User License, Multi-User License (Up to 5 Users), Corporate Use License (Unlimited User and Printable PDF).
TABLE OF CONTENTS
1. EXECUTIVE SUMMARY
1.1. MARKET SNAPSHOT
1.2. KEY FINDINGS & INSIGHTS
1.3. ANALYST RECOMMENDATIONS
1.4. FUTURE OUTLOOK
2. RESEARCH METHODOLOGY
2.1. MARKET DEFINITION & SCOPE
2.2. RESEARCH OBJECTIVES: PRIMARY & SECONDARY DATA SOURCES
2.3. DATA COLLECTION SOURCES
2.3.1. COVERAGE OF 100+ PRIMARY RESEARCH/CONSULTATION CALLS WITH INDUSTRY STAKEHOLDERS
FIGURE 17 NORTH AMERICA INTERNET OF THINGS IN RETAIL CURRENT AND FUTURE TYPE ANALYSIS, 2025–2034, (USD MILLION)
FIGURE 18 NORTH AMERICA INTERNET OF THINGS IN RETAIL CURRENT AND FUTURE END USER ANALYSIS, 2025–2034, (USD MILLION)
FIGURE 19 MARKET SHARE BY COUNTRY
FIGURE 20 LATIN AMERICA INTERNET OF THINGS IN RETAIL CURRENT AND FUTURE TYPE ANALYSIS, 2025–2034, (USD MILLION)
FIGURE 21 LATIN AMERICA INTERNET OF THINGS IN RETAIL CURRENT AND FUTURE END USER ANALYSIS, 2025–2034, (USD MILLION)
FIGURE 22 MARKET SHARE BY COUNTRY
FIGURE 23 EASTERN EUROPE INTERNET OF THINGS IN RETAIL CURRENT AND FUTURE TYPE ANALYSIS, 2025–2034, (USD MILLION)
FIGURE 24 EASTERN EUROPE INTERNET OF THINGS IN RETAIL CURRENT AND FUTURE END USER ANALYSIS, 2025–2034, (USD MILLION)
FIGURE 25 MARKET SHARE BY COUNTRY
FIGURE 26 WESTERN EUROPE INTERNET OF THINGS IN RETAIL CURRENT AND FUTURE TYPE ANALYSIS, 2025–2034, (USD MILLION)
FIGURE 27 WESTERN EUROPE INTERNET OF THINGS IN RETAIL CURRENT AND FUTURE END USER ANALYSIS, 2025–2034, (USD MILLION)
FIGURE 28 MARKET SHARE BY COUNTRY
FIGURE 29 EAST ASIA AND PACIFIC INTERNET OF THINGS IN RETAIL CURRENT AND FUTURE TYPE ANALYSIS, 2025–2034, (USD MILLION)
FIGURE 30 EAST ASIA AND PACIFIC INTERNET OF THINGS IN RETAIL CURRENT AND FUTURE END USER ANALYSIS, 2025–2034, (USD MILLION)
FIGURE 31 MARKET SHARE BY COUNTRY
FIGURE 32 SEA AND SOUTH ASIA INTERNET OF THINGS IN RETAIL CURRENT AND FUTURE TYPE ANALYSIS, 2025–2034, (USD MILLION)
FIGURE 33 SEA AND SOUTH ASIA INTERNET OF THINGS IN RETAIL CURRENT AND FUTURE END USER ANALYSIS, 2025–2034, (USD MILLION)
FIGURE 34 MARKET SHARE BY COUNTRY
FIGURE 35 MIDDLE EAST AND AFRICA INTERNET OF THINGS IN RETAIL CURRENT AND FUTURE TYPE ANALYSIS, 2025–2034, (USD MILLION)
FIGURE 36 MIDDLE EAST AND AFRICA INTERNET OF THINGS IN RETAIL CURRENT AND FUTURE END USER ANALYSIS, 2025–2034, (USD MILLION)
FIGURE 37 NORTH AMERICA INTERNET OF THINGS IN RETAIL CURRENT AND FUTURE MARKET VOLUME SHARE REGIONAL ANALYSIS, 2025–2034, (USD MILLION)
FIGURE 38 U.S. INTERNET OF THINGS IN RETAIL CURRENT AND FUTURE TYPE ANALYSIS, 2025–2034, (USD MILLION)
FIGURE 39 U.S. INTERNET OF THINGS IN RETAIL CURRENT AND FUTURE END USER ANALYSIS, 2025–2034, (USD MILLION)
FIGURE 40 CANADA INTERNET OF THINGS IN RETAIL CURRENT AND FUTURE TYPE ANALYSIS, 2025–2034, (USD MILLION)
FIGURE 41 CANADA INTERNET OF THINGS IN RETAIL CURRENT AND FUTURE END USER ANALYSIS, 2025–2034, (USD MILLION)
FIGURE 42 LATIN AMERICA INTERNET OF THINGS IN RETAIL CURRENT AND FUTURE MARKET VOLUME SHARE REGIONAL ANALYSIS, 2025–2034, (USD MILLION)
FIGURE 43 MEXICO INTERNET OF THINGS IN RETAIL CURRENT AND FUTURE TYPE ANALYSIS, 2025–2034, (USD MILLION)
FIGURE 44 MEXICO INTERNET OF THINGS IN RETAIL CURRENT AND FUTURE END USER ANALYSIS, 2025–2034, (USD MILLION)
FIGURE 45 BRAZIL INTERNET OF THINGS IN RETAIL CURRENT AND FUTURE TYPE ANALYSIS, 2025–2034, (USD MILLION)
FIGURE 46 BRAZIL INTERNET OF THINGS IN RETAIL CURRENT AND FUTURE END USER ANALYSIS, 2025–2034, (USD MILLION)
FIGURE 47 ARGENTINA INTERNET OF THINGS IN RETAIL CURRENT AND FUTURE TYPE ANALYSIS, 2025–2034, (USD MILLION)
FIGURE 48 ARGENTINA INTERNET OF THINGS IN RETAIL CURRENT AND FUTURE END USER ANALYSIS, 2025–2034, (USD MILLION)
FIGURE 49 COLUMBIA INTERNET OF THINGS IN RETAIL CURRENT AND FUTURE TYPE ANALYSIS, 2025–2034, (USD MILLION)
FIGURE 50 COLUMBIA INTERNET OF THINGS IN RETAIL CURRENT AND FUTURE END USER ANALYSIS, 2025–2034, (USD MILLION)
FIGURE 51 REST OF LATIN AMERICA INTERNET OF THINGS IN RETAIL CURRENT AND FUTURE TYPE ANALYSIS, 2025–2034, (USD MILLION)
FIGURE 52 REST OF LATIN AMERICA INTERNET OF THINGS IN RETAIL CURRENT AND FUTURE END USER ANALYSIS, 2025–2034, (USD MILLION)
FIGURE 53 EASTERN EUROPE INTERNET OF THINGS IN RETAIL CURRENT AND FUTURE MARKET VOLUME SHARE REGIONAL ANALYSIS, 2025–2034, (USD MILLION)
FIGURE 54 POLAND INTERNET OF THINGS IN RETAIL CURRENT AND FUTURE TYPE ANALYSIS, 2025–2034, (USD MILLION)
FIGURE 55 POLAND INTERNET OF THINGS IN RETAIL CURRENT AND FUTURE END USER ANALYSIS, 2025–2034, (USD MILLION)
FIGURE 56 RUSSIA INTERNET OF THINGS IN RETAIL CURRENT AND FUTURE TYPE ANALYSIS, 2025–2034, (USD MILLION)
FIGURE 57 RUSSIA INTERNET OF THINGS IN RETAIL CURRENT AND FUTURE END USER ANALYSIS, 2025–2034, (USD MILLION)
FIGURE 58 CZECH REPUBLIC INTERNET OF THINGS IN RETAIL CURRENT AND FUTURE TYPE ANALYSIS, 2025–2034, (USD MILLION)
FIGURE 59 CZECH REPUBLIC INTERNET OF THINGS IN RETAIL CURRENT AND FUTURE END USER ANALYSIS, 2025–2034, (USD MILLION)
FIGURE 60 ROMANIA INTERNET OF THINGS IN RETAIL CURRENT AND FUTURE TYPE ANALYSIS, 2025–2034, (USD MILLION)
FIGURE 61 ROMANIA INTERNET OF THINGS IN RETAIL CURRENT AND FUTURE END USER ANALYSIS, 2025–2034, (USD MILLION)
FIGURE 62 REST OF EASTERN EUROPE INTERNET OF THINGS IN RETAIL CURRENT AND FUTURE TYPE ANALYSIS, 2025–2034, (USD MILLION)
FIGURE 63 REST OF EASTERN EUROPE INTERNET OF THINGS IN RETAIL CURRENT AND FUTURE END USER ANALYSIS, 2025–2034, (USD MILLION)
FIGURE 64 WESTERN EUROPE INTERNET OF THINGS IN RETAIL CURRENT AND FUTURE MARKET VOLUME SHARE REGIONAL ANALYSIS, 2025–2034, (USD MILLION)
FIGURE 65 GERMANY INTERNET OF THINGS IN RETAIL CURRENT AND FUTURE TYPE ANALYSIS, 2025–2034, (USD MILLION)
FIGURE 66 GERMANY INTERNET OF THINGS IN RETAIL CURRENT AND FUTURE END USER ANALYSIS, 2025–2034, (USD MILLION)
FIGURE 67 FRANCE INTERNET OF THINGS IN RETAIL CURRENT AND FUTURE TYPE ANALYSIS, 2025–2034, (USD MILLION)
FIGURE 68 FRANCE INTERNET OF THINGS IN RETAIL CURRENT AND FUTURE END USER ANALYSIS, 2025–2034, (USD MILLION)
FIGURE 69 UK INTERNET OF THINGS IN RETAIL CURRENT AND FUTURE TYPE ANALYSIS, 2025–2034, (USD MILLION)
FIGURE 70 UK INTERNET OF THINGS IN RETAIL CURRENT AND FUTURE END USER ANALYSIS, 2025–2034, (USD MILLION)
FIGURE 71 SPAIN INTERNET OF THINGS IN RETAIL CURRENT AND FUTURE TYPE ANALYSIS, 2025–2034, (USD MILLION)
FIGURE 72 SPAIN INTERNET OF THINGS IN RETAIL CURRENT AND FUTURE END USER ANALYSIS, 2025–2034, (USD MILLION)
FIGURE 73 ITALY INTERNET OF THINGS IN RETAIL CURRENT AND FUTURE TYPE ANALYSIS, 2025–2034, (USD MILLION)
FIGURE 74 ITALY INTERNET OF THINGS IN RETAIL CURRENT AND FUTURE END USER ANALYSIS, 2025–2034, (USD MILLION)
FIGURE 75 REST OF WESTERN EUROPE INTERNET OF THINGS IN RETAIL CURRENT AND FUTURE TYPE ANALYSIS, 2025–2034, (USD MILLION)
FIGURE 76 REST OF WESTERN EUROPE INTERNET OF THINGS IN RETAIL CURRENT AND FUTURE END USER ANALYSIS, 2025–2034, (USD MILLION)
FIGURE 77 EAST ASIA AND PACIFIC INTERNET OF THINGS IN RETAIL CURRENT AND FUTURE MARKET VOLUME SHARE REGIONAL ANALYSIS, 2025–2034, (USD MILLION)
FIGURE 78 CHINA INTERNET OF THINGS IN RETAIL CURRENT AND FUTURE TYPE ANALYSIS, 2025–2034, (USD MILLION)
FIGURE 79 CHINA INTERNET OF THINGS IN RETAIL CURRENT AND FUTURE END USER ANALYSIS, 2025–2034, (USD MILLION)
FIGURE 80 JAPAN INTERNET OF THINGS IN RETAIL CURRENT AND FUTURE TYPE ANALYSIS, 2025–2034, (USD MILLION)
FIGURE 81 JAPAN INTERNET OF THINGS IN RETAIL CURRENT AND FUTURE END USER ANALYSIS, 2025–2034, (USD MILLION)
FIGURE 82 AUSTRALIA INTERNET OF THINGS IN RETAIL CURRENT AND FUTURE TYPE ANALYSIS, 2025–2034, (USD MILLION)
FIGURE 83 AUSTRALIA INTERNET OF THINGS IN RETAIL CURRENT AND FUTURE END USER ANALYSIS, 2025–2034, (USD MILLION)
FIGURE 84 CAMBODIA INTERNET OF THINGS IN RETAIL CURRENT AND FUTURE TYPE ANALYSIS, 2025–2034, (USD MILLION)
FIGURE 85 CAMBODIA INTERNET OF THINGS IN RETAIL CURRENT AND FUTURE END USER ANALYSIS, 2025–2034, (USD MILLION)
FIGURE 86 FIJI INTERNET OF THINGS IN RETAIL CURRENT AND FUTURE TYPE ANALYSIS, 2025–2034, (USD MILLION)
FIGURE 87 FIJI INTERNET OF THINGS IN RETAIL CURRENT AND FUTURE END USER ANALYSIS, 2025–2034, (USD MILLION)
FIGURE 88 INDONESIA INTERNET OF THINGS IN RETAIL CURRENT AND FUTURE TYPE ANALYSIS, 2025–2034, (USD MILLION)
FIGURE 89 INDONESIA INTERNET OF THINGS IN RETAIL CURRENT AND FUTURE END USER ANALYSIS, 2025–2034, (USD MILLION)
FIGURE 90 SOUTH KOREA INTERNET OF THINGS IN RETAIL CURRENT AND FUTURE TYPE ANALYSIS, 2025–2034, (USD MILLION)
FIGURE 91 SOUTH KOREA INTERNET OF THINGS IN RETAIL CURRENT AND FUTURE END USER ANALYSIS, 2025–2034, (USD MILLION)
FIGURE 92 REST OF EAST ASIA AND PACIFIC INTERNET OF THINGS IN RETAIL CURRENT AND FUTURE TYPE ANALYSIS, 2025–2034, (USD MILLION)
FIGURE 93 REST OF EAST ASIA AND PACIFIC INTERNET OF THINGS IN RETAIL CURRENT AND FUTURE END USER ANALYSIS, 2025–2034, (USD MILLION)
FIGURE 94 SEA AND SOUTH ASIA INTERNET OF THINGS IN RETAIL CURRENT AND FUTURE MARKET VOLUME SHARE REGIONAL ANALYSIS, 2025–2034, (USD MILLION)
FIGURE 95 BANGLADESH INTERNET OF THINGS IN RETAIL CURRENT AND FUTURE TYPE ANALYSIS, 2025–2034, (USD MILLION)
FIGURE 96 BANGLADESH INTERNET OF THINGS IN RETAIL CURRENT AND FUTURE END USER ANALYSIS, 2025–2034, (USD MILLION)
FIGURE 97 NEW ZEALAND INTERNET OF THINGS IN RETAIL CURRENT AND FUTURE TYPE ANALYSIS, 2025–2034, (USD MILLION)
FIGURE 98 NEW ZEALAND INTERNET OF THINGS IN RETAIL CURRENT AND FUTURE END USER ANALYSIS, 2025–2034, (USD MILLION)
FIGURE 99 INDIA INTERNET OF THINGS IN RETAIL CURRENT AND FUTURE TYPE ANALYSIS, 2025–2034, (USD MILLION)
FIGURE 100 INDIA INTERNET OF THINGS IN RETAIL CURRENT AND FUTURE END USER ANALYSIS, 2025–2034, (USD MILLION)
FIGURE 101 SINGAPORE INTERNET OF THINGS IN RETAIL CURRENT AND FUTURE TYPE ANALYSIS, 2025–2034, (USD MILLION)
FIGURE 102 SINGAPORE INTERNET OF THINGS IN RETAIL CURRENT AND FUTURE END USER ANALYSIS, 2025–2034, (USD MILLION)
FIGURE 103 THAILAND INTERNET OF THINGS IN RETAIL CURRENT AND FUTURE TYPE ANALYSIS, 2025–2034, (USD MILLION)
FIGURE 104 THAILAND INTERNET OF THINGS IN RETAIL CURRENT AND FUTURE END USER ANALYSIS, 2025–2034, (USD MILLION)
FIGURE 105 TAIWAN INTERNET OF THINGS IN RETAIL CURRENT AND FUTURE TYPE ANALYSIS, 2025–2034, (USD MILLION)
FIGURE 106 TAIWAN INTERNET OF THINGS IN RETAIL CURRENT AND FUTURE END USER ANALYSIS, 2025–2034, (USD MILLION)
FIGURE 107 MALAYSIA INTERNET OF THINGS IN RETAIL CURRENT AND FUTURE TYPE ANALYSIS, 2025–2034, (USD MILLION)
FIGURE 108 MALAYSIA INTERNET OF THINGS IN RETAIL CURRENT AND FUTURE END USER ANALYSIS, 2025–2034, (USD MILLION)
FIGURE 109 REST OF SEA AND SOUTH ASIA INTERNET OF THINGS IN RETAIL CURRENT AND FUTURE TYPE ANALYSIS, 2025–2034, (USD MILLION)
FIGURE 110 REST OF SEA AND SOUTH ASIA INTERNET OF THINGS IN RETAIL CURRENT AND FUTURE END USER ANALYSIS, 2025–2034, (USD MILLION)
FIGURE 111 MIDDLE EAST AND AFRICA INTERNET OF THINGS IN RETAIL CURRENT AND FUTURE MARKET VOLUME SHARE REGIONAL ANALYSIS, 2025–2034, (USD MILLION)
FIGURE 112 GCC COUNTRIES INTERNET OF THINGS IN RETAIL CURRENT AND FUTURE TYPE ANALYSIS, 2025–2034, (USD MILLION)
FIGURE 113 GCC COUNTRIES INTERNET OF THINGS IN RETAIL CURRENT AND FUTURE END USER ANALYSIS, 2025–2034, (USD MILLION)
FIGURE 114 SAUDI ARABIA INTERNET OF THINGS IN RETAIL CURRENT AND FUTURE TYPE ANALYSIS, 2025–2034, (USD MILLION)
FIGURE 115 SAUDI ARABIA INTERNET OF THINGS IN RETAIL CURRENT AND FUTURE END USER ANALYSIS, 2025–2034, (USD MILLION)
FIGURE 116 UAE INTERNET OF THINGS IN RETAIL CURRENT AND FUTURE TYPE ANALYSIS, 2025–2034, (USD MILLION)
FIGURE 117 UAE INTERNET OF THINGS IN RETAIL CURRENT AND FUTURE END USER ANALYSIS, 2025–2034, (USD MILLION)
FIGURE 118 BAHRAIN INTERNET OF THINGS IN RETAIL CURRENT AND FUTURE TYPE ANALYSIS, 2025–2034, (USD MILLION)
FIGURE 119 BAHRAIN INTERNET OF THINGS IN RETAIL CURRENT AND FUTURE END USER ANALYSIS, 2025–2034, (USD MILLION)
FIGURE 120 KUWAIT INTERNET OF THINGS IN RETAIL CURRENT AND FUTURE TYPE ANALYSIS, 2025–2034, (USD MILLION)
FIGURE 121 KUWAIT INTERNET OF THINGS IN RETAIL CURRENT AND FUTURE END USER ANALYSIS, 2025–2034, (USD MILLION)
FIGURE 122 OMAN INTERNET OF THINGS IN RETAIL CURRENT AND FUTURE TYPE ANALYSIS, 2025–2034, (USD MILLION)
FIGURE 123 OMAN INTERNET OF THINGS IN RETAIL CURRENT AND FUTURE END USER ANALYSIS, 2025–2034, (USD MILLION)
FIGURE 124 QATAR INTERNET OF THINGS IN RETAIL CURRENT AND FUTURE TYPE ANALYSIS, 2025–2034, (USD MILLION)
FIGURE 125 QATAR INTERNET OF THINGS IN RETAIL CURRENT AND FUTURE END USER ANALYSIS, 2025–2034, (USD MILLION)
FIGURE 126 EGYPT INTERNET OF THINGS IN RETAIL CURRENT AND FUTURE TYPE ANALYSIS, 2025–2034, (USD MILLION)
FIGURE 127 EGYPT INTERNET OF THINGS IN RETAIL CURRENT AND FUTURE END USER ANALYSIS, 2025–2034, (USD MILLION)
FIGURE 128 NIGERIA INTERNET OF THINGS IN RETAIL CURRENT AND FUTURE TYPE ANALYSIS, 2025–2034, (USD MILLION)
FIGURE 129 NIGERIA INTERNET OF THINGS IN RETAIL CURRENT AND FUTURE END USER ANALYSIS, 2025–2034, (USD MILLION)
FIGURE 130 SOUTH AFRICA INTERNET OF THINGS IN RETAIL CURRENT AND FUTURE TYPE ANALYSIS, 2025–2034, (USD MILLION)
FIGURE 131 SOUTH AFRICA INTERNET OF THINGS IN RETAIL CURRENT AND FUTURE END USER ANALYSIS, 2025–2034, (USD MILLION)
FIGURE 132 ISRAEL INTERNET OF THINGS IN RETAIL CURRENT AND FUTURE TYPE ANALYSIS, 2025–2034, (USD MILLION)
FIGURE 133 ISRAEL INTERNET OF THINGS IN RETAIL CURRENT AND FUTURE END USER ANALYSIS, 2025–2034, (USD MILLION)
FIGURE 134 REST OF MEA INTERNET OF THINGS IN RETAIL CURRENT AND FUTURE TYPE ANALYSIS, 2025–2034, (USD MILLION)
FIGURE 135 REST OF MEA INTERNET OF THINGS IN RETAIL CURRENT AND FUTURE END USER ANALYSIS, 2025–2034, (USD MILLION)
FIGURE 136 U. S. MARKET SHARE ANALYSIS BY TYPE (2024)
FIGURE 137 U. S. MARKET SHARE ANALYSIS BY END USER (2024)
FIGURE 138 CANADA MARKET SHARE ANALYSIS BY TYPE (2024)
FIGURE 139 CANADA MARKET SHARE ANALYSIS BY END USER (2024)
FIGURE 140 MEXICO MARKET SHARE ANALYSIS BY TYPE (2024)
FIGURE 141 MEXICO MARKET SHARE ANALYSIS BY END USER (2024)
FIGURE 142 CHINA MARKET SHARE ANALYSIS BY TYPE (2024)
FIGURE 143 CHINA MARKET SHARE ANALYSIS BY END USER (2024)
FIGURE 144 JAPAN MARKET SHARE ANALYSIS BY TYPE (2024)
FIGURE 145 JAPAN MARKET SHARE ANALYSIS BY END USER (2024)
FIGURE 146 INDIA MARKET SHARE ANALYSIS BY TYPE (2024)
FIGURE 147 INDIA MARKET SHARE ANALYSIS BY END USER (2024)
FIGURE 148 SOUTH KOREA MARKET SHARE ANALYSIS BY TYPE (2024)
FIGURE 149 SOUTH KOREA MARKET SHARE ANALYSIS BY END USER (2024)
FIGURE 150 SAUDI ARABIA MARKET SHARE ANALYSIS BY TYPE (2024)
FIGURE 151 SAUDI ARABIA MARKET SHARE ANALYSIS BY END USER (2024)
FIGURE 152 UAE MARKET SHARE ANALYSIS BY TYPE (2024)
FIGURE 153 UAE MARKET SHARE ANALYSIS BY END USER (2024)
FIGURE 154 EGYPT MARKET SHARE ANALYSIS BY TYPE (2024)
FIGURE 155 EGYPT MARKET SHARE ANALYSIS BY END USER (2024)
FIGURE 156 NIGERIA MARKET SHARE ANALYSIS BY TYPE (2024)
FIGURE 157 NIGERIA MARKET SHARE ANALYSIS BY END USER (2024)
FIGURE 158 SOUTH AFRICA MARKET SHARE ANALYSIS BY TYPE (2024)
FIGURE 159 SOUTH AFRICA MARKET SHARE ANALYSIS BY END USER (2024)
FIGURE 160 GERMANY MARKET SHARE ANALYSIS BY TYPE (2024)
FIGURE 161 GERMANY MARKET SHARE ANALYSIS BY END USER (2024)
FIGURE 162 FRANCE MARKET SHARE ANALYSIS BY TYPE (2024)
FIGURE 163 FRANCE MARKET SHARE ANALYSIS BY END USER (2024)
FIGURE 164 UK MARKET SHARE ANALYSIS BY TYPE (2024)
FIGURE 165 UK MARKET SHARE ANALYSIS BY END USER (2024)
FIGURE 166 SPAIN MARKET SHARE ANALYSIS BY TYPE (2024)
FIGURE 167 SPAIN MARKET SHARE ANALYSIS BY END USER (2024)
FIGURE 168 ITALY MARKET SHARE ANALYSIS BY TYPE (2024)
FIGURE 169 ITALY MARKET SHARE ANALYSIS BY END USER (2024)
FIGURE 170 BRAZIL MARKET SHARE ANALYSIS BY TYPE (2024)
FIGURE 171 BRAZIL MARKET SHARE ANALYSIS BY END USER (2024)
FIGURE 172 ARGENTINA MARKET SHARE ANALYSIS BY TYPE (2024)
FIGURE 173 ARGENTINA MARKET SHARE ANALYSIS BY END USER (2024)
FIGURE 174 COLUMBIA MARKET SHARE ANALYSIS BY TYPE (2024)
FIGURE 175 COLUMBIA MARKET SHARE ANALYSIS BY END USER (2024)
FIGURE 176 GLOBAL INTERNET OF THINGS IN RETAIL CURRENT AND FUTURE MARKET KEY COUNTRY LEVEL ANALYSIS, 2024–2034, (USD MILLION)
FIGURE 177 FINANCIAL OVERVIEW:
Key Players Analysis:
Microsoft Corporation: Microsoft stands as a technology giant in the IoT retail market through its comprehensive Azure IoT platform and cloud infrastructure services. The company leverages its extensive enterprise relationships and cloud computing expertise to provide scalable IoT solutions that integrate seamlessly with existing retail systems. Microsoft’s strength lies in its ability to offer end-to-end solutions that combine hardware partnerships, cloud services, and advanced analytics capabilities. The company’s Azure IoT Central platform simplifies IoT deployment for retailers by providing pre-configured templates and industry-specific solutions. Microsoft’s investment in artificial intelligence and machine learning technologies enhances its IoT offerings, enabling retailers to derive deeper insights from their connected devices and improve decision-making processes.
IBM Corporation: IBM positions itself as a leader in IoT retail solutions through its Watson IoT platform and extensive consulting services. The company’s strength lies in its ability to provide enterprise-grade solutions that combine IoT hardware, advanced analytics, and artificial intelligence capabilities. IBM’s Watson technology enables retailers to process and analyze vast amounts of IoT data to identify patterns, predict trends, and optimize operations. The company’s consulting services help retailers navigate the complexities of IoT implementation while ensuring integration with existing systems. IBM’s focus on industry-specific solutions and its extensive partner ecosystem make it a preferred choice for large retail enterprises seeking comprehensive IoT transformations.
Google LLC: Google emerges as a key player in the retail IoT market through its Google Cloud Platform and advanced analytics capabilities. The company’s strength lies in its expertise in data analytics, machine learning, and artificial intelligence, which are essential for extracting value from IoT-generated data. Google’s cloud infrastructure provides the scalability and reliability required for large-scale IoT deployments, while its analytics tools enable retailers to gain insights from their connected devices. The company’s consumer-facing products, including Google Assistant and Android operating system, create opportunities for integrated retail experiences that connect online and offline shopping. Google’s investment in edge computing and 5G technologies positions it well for the next generation of IoT retail applications.
Intel Corporation: Intel serves as a foundational technology provider in the retail IoT market through its processors, chipsets, and edge computing solutions. The company's strength lies in its ability to provide the hardware foundation for IoT devices while also offering software tools and platforms for IoT development. Intel's processors power many of the connected devices used in retail environments, from smart shelves to digital signage systems. The company's edge computing solutions enable retailers to process data locally, reducing latency and improving response times for critical applications. Intel's partnerships with system integrators and technology vendors create comprehensive ecosystems that support retail IoT deployments across various applications and use cases.
Cisco Systems Inc.: Cisco plays a crucial role in the retail IoT market through its networking infrastructure and security solutions. The company's strength lies in its ability to provide the network foundation that enables IoT devices to communicate securely and reliably. Cisco's switches, routers, and wireless access points create the connectivity infrastructure required for large-scale IoT deployments in retail environments. The company's security solutions address the critical need for protecting IoT devices and data from cyber threats. Cisco's software-defined networking capabilities enable retailers to manage and optimize their IoT networks dynamically, ensuring optimal performance and security. The company's consulting services help retailers design and implement network architectures that support their IoT initiatives while maintaining security and reliability standards.
Market Key Players
Losant IoT
Cisco Systems Inc.
IBM Corporation
Arm Limited
Intel Corporation
Verizon Communications Inc.
SAP SE
Microsoft Corporation
Google LLC
NXP Semiconductors.
Oracle Corporation
RETAILNEXT, INC.
PTC Inc.
Zebra Technologies Corp.
Driver:
Demand for Personalized Shopping Experiences:
The modern consumer expects tailored experiences based on their preferences, shopping history, and behavior. IoT enables real-time data collection and integration across various customer touchpoints, allowing retailers to deliver personalized offers, product recommendations, and services. Smart mirrors, digital signages, and mobile apps integrated with IoT platforms adapt in real-time to customer profiles, enhancing satisfaction and driving sales. This demand is pushing retailers to invest in advanced analytics and customer engagement solutions powered by IoT.
Growth in Omnichannel Retailing:
IoT bridges the gap between online and offline retail by creating unified, seamless shopping experiences. Customers can check in-store availability from mobile apps, receive location-based promotions, and benefit from quick checkouts through smart POS terminals. Inventory visibility across channels enables better fulfillment and delivery options, essential for omnichannel success. This integration improves customer loyalty and operational flexibility, making IoT critical in modern retail strategies.
Restrain:
Data Privacy and Security Concerns:
IoT systems collect vast amounts of sensitive consumer data. Any breach can lead to legal repercussions, loss of customer trust, and regulatory penalties. The complexity of securing interconnected devices, coupled with evolving cybersecurity threats, makes it difficult for retailers to maintain robust protection. Compliance with regional data protection laws like GDPR in Europe adds another layer of complexity, requiring continuous updates to data handling policies.
High Initial Investment:
Setting up a full-scale IoT infrastructure requires significant capital for hardware, integration, software development, and training. Small and medium retailers often face budget constraints, making them hesitant to adopt such solutions. Additionally, ROI may not be immediate, especially in the absence of clear performance metrics, deterring some businesses from early investment. The cost barrier also affects scalability in multi-store operations.
Opportunities:
Integration of AI and IoT:
Artificial Intelligence, when combined with IoT, enables predictive analytics, intelligent automation, and real-time decision-making. Retailers can use AI-powered IoT solutions for demand forecasting, inventory optimization, and dynamic pricing. This convergence is particularly useful in preventing stockouts, minimizing waste, and improving shelf availability. As AI algorithms mature, the synergy with IoT will open new avenues for efficient and intelligent retail management.
Expansion in Emerging Markets:
Emerging economies in Asia, Africa, and Latin America offer untapped potential for IoT adoption. Rapid urbanization, growing middle-class populations, and rising smartphone penetration are fueling demand for modern retail experiences. Governments in these regions are also investing in digital infrastructure, smart cities, and 5G networks, creating favorable environments for IoT integration. Retailers entering these markets have the chance to deploy smart systems from the ground up, avoiding legacy issues.
Trends:
Rise of Smart Stores:
Retailers are creating futuristic shopping environments using smart shelves, interactive displays, and automated checkout systems. These innovations enhance in-store engagement and reduce labor costs. For instance, Amazon Go stores exemplify the potential of IoT-based smart retail where customers can walk in, pick items, and leave without waiting in line, thanks to sensors and AI algorithms.
Adoption of Real-Time Analytics:
IoT systems provide continuous streams of data that can be analyzed instantly to make quick decisions. Retailers use this to adjust inventory, track customer footfall, and manage store layouts. Real-time analytics supports agile operations and improves responsiveness to market demands. The ability to pivot quickly based on data insights gives retailers a competitive edge.
Recent Development
In October 2024: Advantech has officially completed its acquisition of block shares in AURES Technologies SA. On October 1, 2024, Advantech finalized the block trade transaction, securing 1,430,381 shares directly from AURES Technologies’ principal shareholder. In addition to the share acquisition, Advantech has also subscribed to the initial tranche of convertible bonds issued by AURES Technologies, amounting to a principal value of €2,500,000.
In January 2024: Softweb Solutions, a recognized global leader in advanced technology solutions for digital transformation and enterprise growth, has unveiled its new 360 suite of programs. These initiatives span key innovation domains, including artificial intelligence (AI), generative AI, data analytics, Internet of Things (IoT), and digital platforms—alongside the debut of the company’s latest product, Needle.