Global Intraocular Lens (IOL) Market Size, Share & Ophthalmology Analysis By Product Type (Monofocal, Multifocal, Toric, EDOF), By Material, By End User (Hospitals, Eye Clinics), Cataract Surgery Volumes, Aging Population Impact, Premium Lens Adoption, Regional Healthcare Trends, Key Companies & Forecast 2025–2034
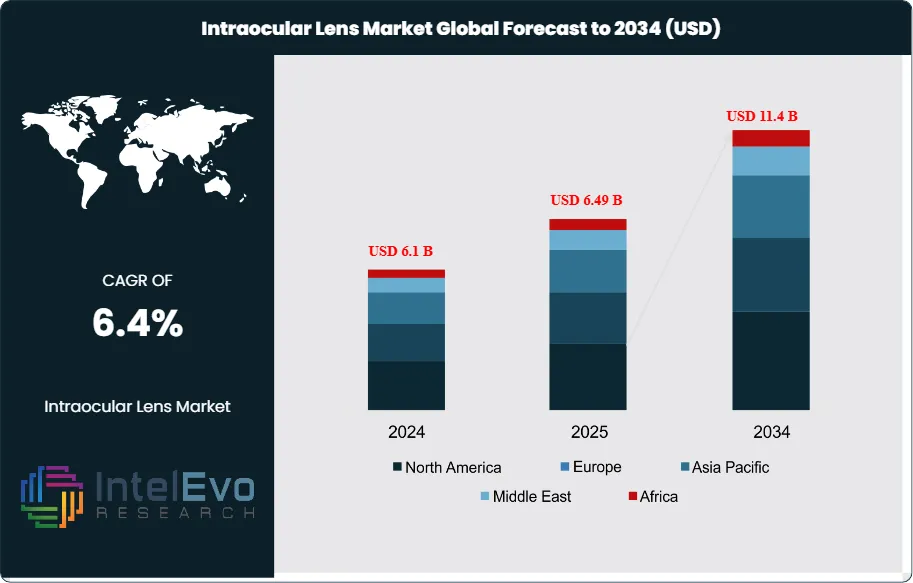
The Intraocular Lens (IOL) Market is estimated at USD 6.1 billion in 2024 and is projected to reach approximately USD 11.4 billion by 2034, registering a compound annual growth rate (CAGR) of about 6.4% during 2025–2034. This sustained expansion is driven by the rising global prevalence of cataracts, rapid growth in the aging population, and increasing adoption of advanced premium IOLs such as multifocal, toric, and extended depth-of-focus lenses. Technological advancements in lens materials and designs, along with higher cataract surgery volumes across emerging and developed markets, are further strengthening demand. Additionally, improving access to ophthalmic care and growing patient preference for vision-correcting solutions that reduce dependence on spectacles are supporting long-term market momentum.
The market has expanded steadily over the past decade, supported by rising surgical volumes and broader access to ophthalmic care. Cataracts remain the leading cause of blindness worldwide, accounting for nearly 45% of global visual impairment cases, and the rising prevalence of age-related eye disorders continues to drive demand for intraocular lens (IOL) procedures. In 2023, more than 28 million cataract surgeries were performed globally, and this figure is projected to exceed 40 million annually by 2033, underscoring the scale of opportunity for IOL manufacturers.
Growth is reinforced by favorable reimbursement frameworks, government-backed initiatives to reduce surgical backlogs, and expanding healthcare infrastructure in emerging economies. Demand-side factors include an aging population, higher life expectancy, and growing awareness of preventive eye care. On the supply side, manufacturers are introducing advanced lens designs, including toric and multifocal IOLs, which improve visual outcomes and reduce dependence on corrective eyewear. However, pricing pressures, regulatory scrutiny, and uneven access to skilled ophthalmic surgeons remain key challenges that could temper growth in certain markets.
Technology is reshaping adoption patterns. Digital surgical platforms, femtosecond laser-assisted cataract surgery, and AI-driven diagnostic tools are improving precision and patient outcomes. Premium IOLs, which command higher margins, are gaining traction in developed markets, while cost-effective monofocal lenses continue to dominate in lower-income regions. The integration of real-time imaging and automated surgical guidance is expected to accelerate adoption of advanced IOLs over the forecast horizon.
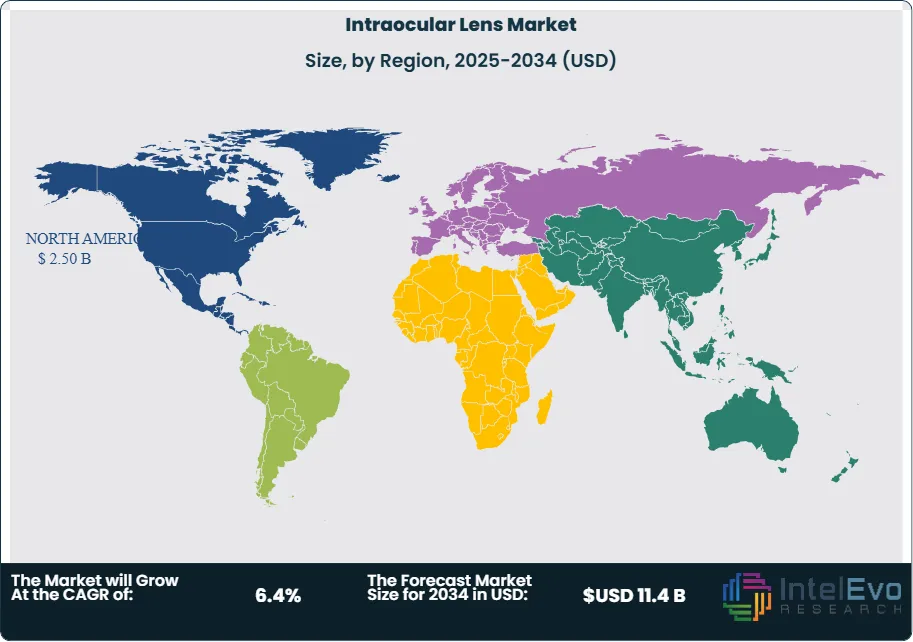
Regionally, North America and Europe remain the largest markets, supported by high surgical penetration rates and strong reimbursement systems. Asia-Pacific is emerging as the fastest-growing region, with China and India accounting for a significant share of global cataract surgeries due to large patient pools and expanding public health programs. Latin America and the Middle East are also gaining attention as investment hotspots, where rising healthcare expenditure and private sector participation are creating new opportunities. For investors, the combination of demographic shifts, technological progress, and policy support positions the intraocular lens market as a resilient growth sector through 2034.
Key Takeaways
Market Growth: The global intraocular lens (IOL) market stood at USD 6.1 billion in 2024 and is anticipated to climb to USD 11.4 billion by 2034, advancing at a CAGR of 6.4%. Market expansion is underpinned by the growing incidence of cataracts, a steady rise in surgical procedures, and supportive reimbursement frameworks that encourage adoption.
Product Type: Multifocal intraocular lenses accounted for 56.9% of global revenue in 2023. Their ability to correct presbyopia and reduce dependence on spectacles has driven adoption, particularly in developed markets.
Material: Hydrophobic acrylic lenses represented 39.3% of the market in 2023. Their high refractive index, lower risk of posterior capsule opacification, and ease of surgical insertion make them the preferred choice among ophthalmic surgeons.
Driver: Rising cataract incidence, with over 28 million surgeries performed globally in 2023, is the primary growth driver. Government initiatives to reduce surgical backlogs and expand access to ophthalmic care further accelerate demand.
Restraint: High costs of premium IOLs, which can be two to three times more expensive than monofocal lenses, limit adoption in low- and middle-income countries. Unequal access to skilled ophthalmic surgeons also constrains penetration in emerging markets.
Opportunity: Asia-Pacific is expected to record the fastest CAGR of over 7% through 2033. Expanding healthcare infrastructure in India and China, coupled with large patient pools, positions the region as a key investment hotspot.
Trend: Adoption of premium IOLs, including toric and extended depth-of-focus lenses, is rising. Companies such as Alcon and Johnson & Johnson Vision are investing in AI-assisted surgical platforms and femtosecond laser technologies to improve precision and outcomes.
Regional Analysis: North America led with 41.3% of global revenue in 2023, supported by high surgical penetration and favorable insurance coverage. Asia-Pacific is emerging as the fastest-growing region, while Latin America and the Middle East are gaining traction due to rising healthcare expenditure and private sector participation.
Type Analysis
The intraocular lens market in 2025 continues to be led by multifocal lenses, which accounted for more than 56% of global revenue in 2023 and are projected to maintain dominance through the next decade. Their ability to provide clear vision across multiple focal points has made them the preferred choice for patients seeking spectacle independence after cataract surgery. Rising adoption in developed markets, where premium lens categories are gaining traction, is expected to sustain growth.
Toric intraocular lenses represent the second-largest segment and are forecast to expand at one of the fastest rates through 2033. These lenses address moderate to high astigmatism, a condition affecting nearly 30% of cataract patients worldwide. By reducing or eliminating the need for additional corrective procedures, toric IOLs are increasingly favored by both surgeons and patients. Monofocal and accommodative lenses continue to serve large patient pools, particularly in cost-sensitive markets, but their growth is expected to be slower compared with premium lens categories.
Material Analysis
Hydrophobic acrylic materials remain the leading choice, capturing over 39% of the market in 2023 and projected to expand further by 2033. Their low water content, high refractive index, and foldable properties make them well-suited for minimally invasive cataract procedures. Clinical studies confirm that hydrophobic acrylic lenses reduce the risk of posterior capsule opacification, a common complication, which further strengthens their adoption.
Polymethylmethacrylate (PMMA) lenses, while less advanced, continue to hold a significant share due to their affordability. PMMA was the first material used in IOL production and remains widely adopted in lower-income regions where cost is a critical factor. Europe and parts of Asia still rely on PMMA lenses for large-scale cataract programs. Silicone and hydrophilic acrylic lenses occupy smaller shares but are expected to see steady uptake in niche applications where flexibility and biocompatibility are valued.
End-Use Analysis
Hospitals accounted for more than 55% of global intraocular lens procedures in 2023 and remain the dominant end-use segment in 2025. High surgical volumes, advanced infrastructure, and access to skilled ophthalmologists make hospitals the primary setting for cataract and refractive surgeries. Favorable reimbursement policies in North America and Europe further reinforce this dominance.
Ophthalmology clinics are expanding rapidly in Asia-Pacific and Latin America, where independent practices are meeting rising demand for affordable eye care. These clinics are expected to capture a growing share of procedures, particularly in urban centers. Eye research institutes and academic centers are also playing a larger role, supported by government and private funding for clinical trials and product development. Ambulatory surgery centers, especially in the United States, are gaining traction due to shorter recovery times and lower costs compared with hospital-based procedures.
Regional Analysis
North America led the global market in 2023 with a 41% share, valued at nearly USD 2.0 billion, and is expected to maintain leadership through 2033. High adoption of premium IOLs, strong insurance coverage, and rapid regulatory approvals for advanced products underpin this position. The United States remains the largest contributor, with cataract surgeries exceeding 4 million annually.
Europe is the second-largest market, supported by widespread use of femtosecond laser-assisted cataract surgery and rising adoption of toric and multifocal lenses. The prevalence of cataracts among individuals over 70 years of age exceeds 60% in several countries, creating sustained demand. Germany, France, and the UK are the key revenue contributors.
Asia-Pacific is projected to record the fastest CAGR, exceeding 7% through 2033. The region’s large geriatric population, particularly in China and India, combined with expanding healthcare infrastructure, is driving growth. Latin America is showing steady progress, with Brazil and Mexico leading adoption. In contrast, the Middle East and Africa are expected to grow at a slower pace due to limited reimbursement frameworks and lower awareness, although private sector investment is gradually improving access to advanced eye care solutions.
By Type (Monofocal Intraocular Lens, Multifocal Intraocular Lens, Toric Intraocular Lens, Accommodative Intraocular Lens), By Material (Polymethylmethacrylate, Silicone, Hydrophobic and Hydrophilic Acrylic Materials, Other Materials), By End-Users (Hospitals, Ophthalmology Clinics, Eye Research Institutes, Ambulatory Surgery Centers, Other End-Users)
Research Methodology
Primary Research- 100 Interviews of Stakeholders
Secondary Research
Desk Research
Regional scope
North America (United States, Canada, Mexico)
Latin America (Brazil, Argentina, Columbia)
East Asia And Pacific (China, Japan, South Korea, Australia, Cambodia, Fiji, Indonesia)
Sea And South Asia (India, Singapore, Thailand, Taiwan, Malaysia)
Eastern Europe (Poland, Russia, Czech Republic, Romania)
Western Europe (Germany, U.K., France, Spain, Itlay)
Middle East & Africa (GCC Countries, Egypt, Nigeria, South Africa, Israel)
Competitive Landscape
HOYA CORPORATION, Aurolab, Truviz Ophthalmic, Johnson and Johnson Vision Care, Inc., Global Ophthalmic Pvt. Ltd., HumanOptics AG, EyeKon Medical, Inc., Appasamy Associates, STAAR Surgical Company, Alcon, Inc., Care Group Sight Solution Pvt. Ltd., Bausch & Lomb Incorporated, Dahlgren India, Omni Lens Pvt Ltd, Lenstec, Inc., Carl Zeiss Meditec AG, NanoVision, Other Key Players
Customization Scope
Customization for segments, region/country-level will be provided. Moreover, additional customization can be done based on the requirements.
Pricing and Purchase Options
Avail customized purchase options to meet your exact research needs. We have three licenses to opt for: Single User License, Multi-User License (Up to 5 Users), Corporate Use License (Unlimited User and Printable PDF).
TABLE OF CONTENTS
1. EXECUTIVE SUMMARY
1.1. MARKET SNAPSHOT
1.2. KEY FINDINGS & INSIGHTS
1.3. ANALYST RECOMMENDATIONS
1.4. FUTURE OUTLOOK
2. RESEARCH METHODOLOGY
2.1. MARKET DEFINITION & SCOPE
2.2. RESEARCH OBJECTIVES: PRIMARY & SECONDARY DATA SOURCES
2.3. DATA COLLECTION SOURCES
2.3.1. COVERAGE OF 100+ PRIMARY RESEARCH/CONSULTATION CALLS WITH INDUSTRY STAKEHOLDERS
FIGURE 17 NORTH AMERICA INTRAOCULAR LENS CURRENT AND FUTURE TYPE ANALYSIS, 2025–2034, (USD MILLION)
FIGURE 18 NORTH AMERICA INTRAOCULAR LENS CURRENT AND FUTURE END USER ANALYSIS, 2025–2034, (USD MILLION)
FIGURE 19 MARKET SHARE BY COUNTRY
FIGURE 20 LATIN AMERICA INTRAOCULAR LENS CURRENT AND FUTURE TYPE ANALYSIS, 2025–2034, (USD MILLION)
FIGURE 21 LATIN AMERICA INTRAOCULAR LENS CURRENT AND FUTURE END USER ANALYSIS, 2025–2034, (USD MILLION)
FIGURE 22 MARKET SHARE BY COUNTRY
FIGURE 23 EASTERN EUROPE INTRAOCULAR LENS CURRENT AND FUTURE TYPE ANALYSIS, 2025–2034, (USD MILLION)
FIGURE 24 EASTERN EUROPE INTRAOCULAR LENS CURRENT AND FUTURE END USER ANALYSIS, 2025–2034, (USD MILLION)
FIGURE 25 MARKET SHARE BY COUNTRY
FIGURE 26 WESTERN EUROPE INTRAOCULAR LENS CURRENT AND FUTURE TYPE ANALYSIS, 2025–2034, (USD MILLION)
FIGURE 27 WESTERN EUROPE INTRAOCULAR LENS CURRENT AND FUTURE END USER ANALYSIS, 2025–2034, (USD MILLION)
FIGURE 28 MARKET SHARE BY COUNTRY
FIGURE 29 EAST ASIA AND PACIFIC INTRAOCULAR LENS CURRENT AND FUTURE TYPE ANALYSIS, 2025–2034, (USD MILLION)
FIGURE 30 EAST ASIA AND PACIFIC INTRAOCULAR LENS CURRENT AND FUTURE END USER ANALYSIS, 2025–2034, (USD MILLION)
FIGURE 31 MARKET SHARE BY COUNTRY
FIGURE 32 SEA AND SOUTH ASIA INTRAOCULAR LENS CURRENT AND FUTURE TYPE ANALYSIS, 2025–2034, (USD MILLION)
FIGURE 33 SEA AND SOUTH ASIA INTRAOCULAR LENS CURRENT AND FUTURE END USER ANALYSIS, 2025–2034, (USD MILLION)
FIGURE 34 MARKET SHARE BY COUNTRY
FIGURE 35 MIDDLE EAST AND AFRICA INTRAOCULAR LENS CURRENT AND FUTURE TYPE ANALYSIS, 2025–2034, (USD MILLION)
FIGURE 36 MIDDLE EAST AND AFRICA INTRAOCULAR LENS CURRENT AND FUTURE END USER ANALYSIS, 2025–2034, (USD MILLION)
FIGURE 37 NORTH AMERICA INTRAOCULAR LENS CURRENT AND FUTURE MARKET VOLUME SHARE REGIONAL ANALYSIS, 2025–2034, (USD MILLION)
FIGURE 38 U.S. INTRAOCULAR LENS CURRENT AND FUTURE TYPE ANALYSIS, 2025–2034, (USD MILLION)
FIGURE 39 U.S. INTRAOCULAR LENS CURRENT AND FUTURE END USER ANALYSIS, 2025–2034, (USD MILLION)
FIGURE 40 CANADA INTRAOCULAR LENS CURRENT AND FUTURE TYPE ANALYSIS, 2025–2034, (USD MILLION)
FIGURE 41 CANADA INTRAOCULAR LENS CURRENT AND FUTURE END USER ANALYSIS, 2025–2034, (USD MILLION)
FIGURE 42 LATIN AMERICA INTRAOCULAR LENS CURRENT AND FUTURE MARKET VOLUME SHARE REGIONAL ANALYSIS, 2025–2034, (USD MILLION)
FIGURE 43 MEXICO INTRAOCULAR LENS CURRENT AND FUTURE TYPE ANALYSIS, 2025–2034, (USD MILLION)
FIGURE 44 MEXICO INTRAOCULAR LENS CURRENT AND FUTURE END USER ANALYSIS, 2025–2034, (USD MILLION)
FIGURE 45 BRAZIL INTRAOCULAR LENS CURRENT AND FUTURE TYPE ANALYSIS, 2025–2034, (USD MILLION)
FIGURE 46 BRAZIL INTRAOCULAR LENS CURRENT AND FUTURE END USER ANALYSIS, 2025–2034, (USD MILLION)
FIGURE 47 ARGENTINA INTRAOCULAR LENS CURRENT AND FUTURE TYPE ANALYSIS, 2025–2034, (USD MILLION)
FIGURE 48 ARGENTINA INTRAOCULAR LENS CURRENT AND FUTURE END USER ANALYSIS, 2025–2034, (USD MILLION)
FIGURE 49 COLUMBIA INTRAOCULAR LENS CURRENT AND FUTURE TYPE ANALYSIS, 2025–2034, (USD MILLION)
FIGURE 50 COLUMBIA INTRAOCULAR LENS CURRENT AND FUTURE END USER ANALYSIS, 2025–2034, (USD MILLION)
FIGURE 51 REST OF LATIN AMERICA INTRAOCULAR LENS CURRENT AND FUTURE TYPE ANALYSIS, 2025–2034, (USD MILLION)
FIGURE 52 REST OF LATIN AMERICA INTRAOCULAR LENS CURRENT AND FUTURE END USER ANALYSIS, 2025–2034, (USD MILLION)
FIGURE 53 EASTERN EUROPE INTRAOCULAR LENS CURRENT AND FUTURE MARKET VOLUME SHARE REGIONAL ANALYSIS, 2025–2034, (USD MILLION)
FIGURE 54 POLAND INTRAOCULAR LENS CURRENT AND FUTURE TYPE ANALYSIS, 2025–2034, (USD MILLION)
FIGURE 55 POLAND INTRAOCULAR LENS CURRENT AND FUTURE END USER ANALYSIS, 2025–2034, (USD MILLION)
FIGURE 56 RUSSIA INTRAOCULAR LENS CURRENT AND FUTURE TYPE ANALYSIS, 2025–2034, (USD MILLION)
FIGURE 57 RUSSIA INTRAOCULAR LENS CURRENT AND FUTURE END USER ANALYSIS, 2025–2034, (USD MILLION)
FIGURE 58 CZECH REPUBLIC INTRAOCULAR LENS CURRENT AND FUTURE TYPE ANALYSIS, 2025–2034, (USD MILLION)
FIGURE 59 CZECH REPUBLIC INTRAOCULAR LENS CURRENT AND FUTURE END USER ANALYSIS, 2025–2034, (USD MILLION)
FIGURE 60 ROMANIA INTRAOCULAR LENS CURRENT AND FUTURE TYPE ANALYSIS, 2025–2034, (USD MILLION)
FIGURE 61 ROMANIA INTRAOCULAR LENS CURRENT AND FUTURE END USER ANALYSIS, 2025–2034, (USD MILLION)
FIGURE 62 REST OF EASTERN EUROPE INTRAOCULAR LENS CURRENT AND FUTURE TYPE ANALYSIS, 2025–2034, (USD MILLION)
FIGURE 63 REST OF EASTERN EUROPE INTRAOCULAR LENS CURRENT AND FUTURE END USER ANALYSIS, 2025–2034, (USD MILLION)
FIGURE 64 WESTERN EUROPE INTRAOCULAR LENS CURRENT AND FUTURE MARKET VOLUME SHARE REGIONAL ANALYSIS, 2025–2034, (USD MILLION)
FIGURE 65 GERMANY INTRAOCULAR LENS CURRENT AND FUTURE TYPE ANALYSIS, 2025–2034, (USD MILLION)
FIGURE 66 GERMANY INTRAOCULAR LENS CURRENT AND FUTURE END USER ANALYSIS, 2025–2034, (USD MILLION)
FIGURE 67 FRANCE INTRAOCULAR LENS CURRENT AND FUTURE TYPE ANALYSIS, 2025–2034, (USD MILLION)
FIGURE 68 FRANCE INTRAOCULAR LENS CURRENT AND FUTURE END USER ANALYSIS, 2025–2034, (USD MILLION)
FIGURE 69 UK INTRAOCULAR LENS CURRENT AND FUTURE TYPE ANALYSIS, 2025–2034, (USD MILLION)
FIGURE 70 UK INTRAOCULAR LENS CURRENT AND FUTURE END USER ANALYSIS, 2025–2034, (USD MILLION)
FIGURE 71 SPAIN INTRAOCULAR LENS CURRENT AND FUTURE TYPE ANALYSIS, 2025–2034, (USD MILLION)
FIGURE 72 SPAIN INTRAOCULAR LENS CURRENT AND FUTURE END USER ANALYSIS, 2025–2034, (USD MILLION)
FIGURE 73 ITALY INTRAOCULAR LENS CURRENT AND FUTURE TYPE ANALYSIS, 2025–2034, (USD MILLION)
FIGURE 74 ITALY INTRAOCULAR LENS CURRENT AND FUTURE END USER ANALYSIS, 2025–2034, (USD MILLION)
FIGURE 75 REST OF WESTERN EUROPE INTRAOCULAR LENS CURRENT AND FUTURE TYPE ANALYSIS, 2025–2034, (USD MILLION)
FIGURE 76 REST OF WESTERN EUROPE INTRAOCULAR LENS CURRENT AND FUTURE END USER ANALYSIS, 2025–2034, (USD MILLION)
FIGURE 77 EAST ASIA AND PACIFIC INTRAOCULAR LENS CURRENT AND FUTURE MARKET VOLUME SHARE REGIONAL ANALYSIS, 2025–2034, (USD MILLION)
FIGURE 78 CHINA INTRAOCULAR LENS CURRENT AND FUTURE TYPE ANALYSIS, 2025–2034, (USD MILLION)
FIGURE 79 CHINA INTRAOCULAR LENS CURRENT AND FUTURE END USER ANALYSIS, 2025–2034, (USD MILLION)
FIGURE 80 JAPAN INTRAOCULAR LENS CURRENT AND FUTURE TYPE ANALYSIS, 2025–2034, (USD MILLION)
FIGURE 81 JAPAN INTRAOCULAR LENS CURRENT AND FUTURE END USER ANALYSIS, 2025–2034, (USD MILLION)
FIGURE 82 AUSTRALIA INTRAOCULAR LENS CURRENT AND FUTURE TYPE ANALYSIS, 2025–2034, (USD MILLION)
FIGURE 83 AUSTRALIA INTRAOCULAR LENS CURRENT AND FUTURE END USER ANALYSIS, 2025–2034, (USD MILLION)
FIGURE 84 CAMBODIA INTRAOCULAR LENS CURRENT AND FUTURE TYPE ANALYSIS, 2025–2034, (USD MILLION)
FIGURE 85 CAMBODIA INTRAOCULAR LENS CURRENT AND FUTURE END USER ANALYSIS, 2025–2034, (USD MILLION)
FIGURE 86 FIJI INTRAOCULAR LENS CURRENT AND FUTURE TYPE ANALYSIS, 2025–2034, (USD MILLION)
FIGURE 87 FIJI INTRAOCULAR LENS CURRENT AND FUTURE END USER ANALYSIS, 2025–2034, (USD MILLION)
FIGURE 88 INDONESIA INTRAOCULAR LENS CURRENT AND FUTURE TYPE ANALYSIS, 2025–2034, (USD MILLION)
FIGURE 89 INDONESIA INTRAOCULAR LENS CURRENT AND FUTURE END USER ANALYSIS, 2025–2034, (USD MILLION)
FIGURE 90 SOUTH KOREA INTRAOCULAR LENS CURRENT AND FUTURE TYPE ANALYSIS, 2025–2034, (USD MILLION)
FIGURE 91 SOUTH KOREA INTRAOCULAR LENS CURRENT AND FUTURE END USER ANALYSIS, 2025–2034, (USD MILLION)
FIGURE 92 REST OF EAST ASIA AND PACIFIC INTRAOCULAR LENS CURRENT AND FUTURE TYPE ANALYSIS, 2025–2034, (USD MILLION)
FIGURE 93 REST OF EAST ASIA AND PACIFIC INTRAOCULAR LENS CURRENT AND FUTURE END USER ANALYSIS, 2025–2034, (USD MILLION)
FIGURE 94 SEA AND SOUTH ASIA INTRAOCULAR LENS CURRENT AND FUTURE MARKET VOLUME SHARE REGIONAL ANALYSIS, 2025–2034, (USD MILLION)
FIGURE 95 BANGLADESH INTRAOCULAR LENS CURRENT AND FUTURE TYPE ANALYSIS, 2025–2034, (USD MILLION)
FIGURE 96 BANGLADESH INTRAOCULAR LENS CURRENT AND FUTURE END USER ANALYSIS, 2025–2034, (USD MILLION)
FIGURE 97 NEW ZEALAND INTRAOCULAR LENS CURRENT AND FUTURE TYPE ANALYSIS, 2025–2034, (USD MILLION)
FIGURE 98 NEW ZEALAND INTRAOCULAR LENS CURRENT AND FUTURE END USER ANALYSIS, 2025–2034, (USD MILLION)
FIGURE 99 INDIA INTRAOCULAR LENS CURRENT AND FUTURE TYPE ANALYSIS, 2025–2034, (USD MILLION)
FIGURE 100 INDIA INTRAOCULAR LENS CURRENT AND FUTURE END USER ANALYSIS, 2025–2034, (USD MILLION)
FIGURE 101 SINGAPORE INTRAOCULAR LENS CURRENT AND FUTURE TYPE ANALYSIS, 2025–2034, (USD MILLION)
FIGURE 102 SINGAPORE INTRAOCULAR LENS CURRENT AND FUTURE END USER ANALYSIS, 2025–2034, (USD MILLION)
FIGURE 103 THAILAND INTRAOCULAR LENS CURRENT AND FUTURE TYPE ANALYSIS, 2025–2034, (USD MILLION)
FIGURE 104 THAILAND INTRAOCULAR LENS CURRENT AND FUTURE END USER ANALYSIS, 2025–2034, (USD MILLION)
FIGURE 105 TAIWAN INTRAOCULAR LENS CURRENT AND FUTURE TYPE ANALYSIS, 2025–2034, (USD MILLION)
FIGURE 106 TAIWAN INTRAOCULAR LENS CURRENT AND FUTURE END USER ANALYSIS, 2025–2034, (USD MILLION)
FIGURE 107 MALAYSIA INTRAOCULAR LENS CURRENT AND FUTURE TYPE ANALYSIS, 2025–2034, (USD MILLION)
FIGURE 108 MALAYSIA INTRAOCULAR LENS CURRENT AND FUTURE END USER ANALYSIS, 2025–2034, (USD MILLION)
FIGURE 109 REST OF SEA AND SOUTH ASIA INTRAOCULAR LENS CURRENT AND FUTURE TYPE ANALYSIS, 2025–2034, (USD MILLION)
FIGURE 110 REST OF SEA AND SOUTH ASIA INTRAOCULAR LENS CURRENT AND FUTURE END USER ANALYSIS, 2025–2034, (USD MILLION)
FIGURE 111 MIDDLE EAST AND AFRICA INTRAOCULAR LENS CURRENT AND FUTURE MARKET VOLUME SHARE REGIONAL ANALYSIS, 2025–2034, (USD MILLION)
FIGURE 112 GCC COUNTRIES INTRAOCULAR LENS CURRENT AND FUTURE TYPE ANALYSIS, 2025–2034, (USD MILLION)
FIGURE 113 GCC COUNTRIES INTRAOCULAR LENS CURRENT AND FUTURE END USER ANALYSIS, 2025–2034, (USD MILLION)
FIGURE 114 SAUDI ARABIA INTRAOCULAR LENS CURRENT AND FUTURE TYPE ANALYSIS, 2025–2034, (USD MILLION)
FIGURE 115 SAUDI ARABIA INTRAOCULAR LENS CURRENT AND FUTURE END USER ANALYSIS, 2025–2034, (USD MILLION)
FIGURE 116 UAE INTRAOCULAR LENS CURRENT AND FUTURE TYPE ANALYSIS, 2025–2034, (USD MILLION)
FIGURE 117 UAE INTRAOCULAR LENS CURRENT AND FUTURE END USER ANALYSIS, 2025–2034, (USD MILLION)
FIGURE 118 BAHRAIN INTRAOCULAR LENS CURRENT AND FUTURE TYPE ANALYSIS, 2025–2034, (USD MILLION)
FIGURE 119 BAHRAIN INTRAOCULAR LENS CURRENT AND FUTURE END USER ANALYSIS, 2025–2034, (USD MILLION)
FIGURE 120 KUWAIT INTRAOCULAR LENS CURRENT AND FUTURE TYPE ANALYSIS, 2025–2034, (USD MILLION)
FIGURE 121 KUWAIT INTRAOCULAR LENS CURRENT AND FUTURE END USER ANALYSIS, 2025–2034, (USD MILLION)
FIGURE 122 OMAN INTRAOCULAR LENS CURRENT AND FUTURE TYPE ANALYSIS, 2025–2034, (USD MILLION)
FIGURE 123 OMAN INTRAOCULAR LENS CURRENT AND FUTURE END USER ANALYSIS, 2025–2034, (USD MILLION)
FIGURE 124 QATAR INTRAOCULAR LENS CURRENT AND FUTURE TYPE ANALYSIS, 2025–2034, (USD MILLION)
FIGURE 125 QATAR INTRAOCULAR LENS CURRENT AND FUTURE END USER ANALYSIS, 2025–2034, (USD MILLION)
FIGURE 126 EGYPT INTRAOCULAR LENS CURRENT AND FUTURE TYPE ANALYSIS, 2025–2034, (USD MILLION)
FIGURE 127 EGYPT INTRAOCULAR LENS CURRENT AND FUTURE END USER ANALYSIS, 2025–2034, (USD MILLION)
FIGURE 128 NIGERIA INTRAOCULAR LENS CURRENT AND FUTURE TYPE ANALYSIS, 2025–2034, (USD MILLION)
FIGURE 129 NIGERIA INTRAOCULAR LENS CURRENT AND FUTURE END USER ANALYSIS, 2025–2034, (USD MILLION)
FIGURE 130 SOUTH AFRICA INTRAOCULAR LENS CURRENT AND FUTURE TYPE ANALYSIS, 2025–2034, (USD MILLION)
FIGURE 131 SOUTH AFRICA INTRAOCULAR LENS CURRENT AND FUTURE END USER ANALYSIS, 2025–2034, (USD MILLION)
FIGURE 132 ISRAEL INTRAOCULAR LENS CURRENT AND FUTURE TYPE ANALYSIS, 2025–2034, (USD MILLION)
FIGURE 133 ISRAEL INTRAOCULAR LENS CURRENT AND FUTURE END USER ANALYSIS, 2025–2034, (USD MILLION)
FIGURE 134 REST OF MEA INTRAOCULAR LENS CURRENT AND FUTURE TYPE ANALYSIS, 2025–2034, (USD MILLION)
FIGURE 135 REST OF MEA INTRAOCULAR LENS CURRENT AND FUTURE END USER ANALYSIS, 2025–2034, (USD MILLION)
FIGURE 136 U. S. MARKET SHARE ANALYSIS BY TYPE (2024)
FIGURE 137 U. S. MARKET SHARE ANALYSIS BY END USER (2024)
FIGURE 138 CANADA MARKET SHARE ANALYSIS BY TYPE (2024)
FIGURE 139 CANADA MARKET SHARE ANALYSIS BY END USER (2024)
FIGURE 140 MEXICO MARKET SHARE ANALYSIS BY TYPE (2024)
FIGURE 141 MEXICO MARKET SHARE ANALYSIS BY END USER (2024)
FIGURE 142 CHINA MARKET SHARE ANALYSIS BY TYPE (2024)
FIGURE 143 CHINA MARKET SHARE ANALYSIS BY END USER (2024)
FIGURE 144 JAPAN MARKET SHARE ANALYSIS BY TYPE (2024)
FIGURE 145 JAPAN MARKET SHARE ANALYSIS BY END USER (2024)
FIGURE 146 INDIA MARKET SHARE ANALYSIS BY TYPE (2024)
FIGURE 147 INDIA MARKET SHARE ANALYSIS BY END USER (2024)
FIGURE 148 SOUTH KOREA MARKET SHARE ANALYSIS BY TYPE (2024)
FIGURE 149 SOUTH KOREA MARKET SHARE ANALYSIS BY END USER (2024)
FIGURE 150 SAUDI ARABIA MARKET SHARE ANALYSIS BY TYPE (2024)
FIGURE 151 SAUDI ARABIA MARKET SHARE ANALYSIS BY END USER (2024)
FIGURE 152 UAE MARKET SHARE ANALYSIS BY TYPE (2024)
FIGURE 153 UAE MARKET SHARE ANALYSIS BY END USER (2024)
FIGURE 154 EGYPT MARKET SHARE ANALYSIS BY TYPE (2024)
FIGURE 155 EGYPT MARKET SHARE ANALYSIS BY END USER (2024)
FIGURE 156 NIGERIA MARKET SHARE ANALYSIS BY TYPE (2024)
FIGURE 157 NIGERIA MARKET SHARE ANALYSIS BY END USER (2024)
FIGURE 158 SOUTH AFRICA MARKET SHARE ANALYSIS BY TYPE (2024)
FIGURE 159 SOUTH AFRICA MARKET SHARE ANALYSIS BY END USER (2024)
FIGURE 160 GERMANY MARKET SHARE ANALYSIS BY TYPE (2024)
FIGURE 161 GERMANY MARKET SHARE ANALYSIS BY END USER (2024)
FIGURE 162 FRANCE MARKET SHARE ANALYSIS BY TYPE (2024)
FIGURE 163 FRANCE MARKET SHARE ANALYSIS BY END USER (2024)
FIGURE 164 UK MARKET SHARE ANALYSIS BY TYPE (2024)
FIGURE 165 UK MARKET SHARE ANALYSIS BY END USER (2024)
FIGURE 166 SPAIN MARKET SHARE ANALYSIS BY TYPE (2024)
FIGURE 167 SPAIN MARKET SHARE ANALYSIS BY END USER (2024)
FIGURE 168 ITALY MARKET SHARE ANALYSIS BY TYPE (2024)
FIGURE 169 ITALY MARKET SHARE ANALYSIS BY END USER (2024)
FIGURE 170 BRAZIL MARKET SHARE ANALYSIS BY TYPE (2024)
FIGURE 171 BRAZIL MARKET SHARE ANALYSIS BY END USER (2024)
FIGURE 172 ARGENTINA MARKET SHARE ANALYSIS BY TYPE (2024)
FIGURE 173 ARGENTINA MARKET SHARE ANALYSIS BY END USER (2024)
FIGURE 174 COLUMBIA MARKET SHARE ANALYSIS BY TYPE (2024)
FIGURE 175 COLUMBIA MARKET SHARE ANALYSIS BY END USER (2024)
FIGURE 176 GLOBAL INTRAOCULAR LENS CURRENT AND FUTURE MARKET KEY COUNTRY LEVEL ANALYSIS, 2024–2034, (USD MILLION)
FIGURE 177 FINANCIAL OVERVIEW:
Key Player Analysis
Aurolab: Aurolab positions as a cost leader and high‑volume manufacturer in intraocular lenses with strong reach across South Asia and Africa. Its portfolio spans PMMA and acrylic IOLs, including monofocal and premium categories, supported by sterilized packaging and ISO-compliant processes. The company ties closely to high-throughput surgical programs, enabling reliable supply at scale. In 2025, Aurolab expands hydrophobic acrylic capacity and strengthens OEM partnerships with mission hospitals, targeting double‑digit export growth. Its differentiator is price discipline with consistent quality, which helps you address large public tenders and NGO‑backed cataract camps.
Aurolab’s strategy focuses on affordability, regional manufacturing depth, and standardized clinical performance. The firm invests in automated molding and edge‑polishing to reduce defect rates. It also builds training and service support for surgeons using phacoemulsification systems in high‑volume centers. With rising procedure volumes in India and East Africa, Aurolab is positioned to defend share in monofocal lenses while selectively scaling premium SKUs where reimbursement allows.
Care Group Sight Solution Pvt. Ltd.: Care Group positions as a challenger with a broad IOL and phakic lens portfolio and growing international footprint. The company markets hydrophobic and hydrophilic acrylic IOLs, toric and multifocal options, and its IPCL line for refractive correction, supported by a large manufacturing site in Vadodara. As of 2025, the company reports a strong bank rating profile and continues to expand exports to 30+ countries, focusing on distributor-led growth and hospital procurement. Its differentiators are product breadth, price competitiveness in premium segments, and a footprint that spans both government programs and private clinics.
Strategically, Care Group invests in tooling upgrades for foldable lenses, tighter in‑process metrology, and surgeon education programs to lift adoption of premium IOLs. The firm is pursuing regional partnerships in the Middle East and Southeast Asia and adding SKUs that align with rising astigmatism correction demand. Expect steady revenue growth tied to premium mix shift and deeper penetration of ambulatory surgery centers where out‑of‑pocket purchases favor cost‑effective premium options.
Carl Zeiss Meditec AG: Carl Zeiss Meditec is a leader in ophthalmology systems and a top‑tier player in premium IOLs with the CT LUCIA family, toric variants, and EDOF offerings. The company’s core strength lies in end‑to‑end platforms spanning diagnostics, surgical microscopes, visualization, and digital workflow software, which anchor surgeon loyalty and drive IOL pull‑through. In fiscal 2023/24, group revenue was around €2.0 billion with ophthalmology representing the majority, and the firm enters 2025 with healthy margins and global reach across North America, Europe, and APAC. Its differentiators are optical design pedigree, integrated software, and training ecosystems that support consistent outcomes.
Zeiss advances AI‑assisted planning and biometry integration to improve lens selection and refractive accuracy, and invests in clinical evidence for EDOF adoption. The company pursues selective acquisitions in imaging and data platforms to reinforce surgical workflow leadership. For you, Zeiss offers a premium play with defensible pricing, strong regulatory credentials, and installed base synergies that enhance lifetime customer value across diagnostics and surgery.
Dahlgren India: Dahlgren India operates as a niche player with targeted presence in ophthalmic consumables and select IOL lines, focusing on domestic distribution and value‑tier products. The company leans on contract manufacturing and regional channel relationships to serve independent clinics and smaller hospitals where cost and availability drive decisions. Its differentiators are local supply reliability, responsive service, and competitive pricing in monofocal and select toric SKUs.
Strategically, Dahlgren India prioritizes steady expansion into Tier‑2 and Tier‑3 cities, aligning inventory cycles with peak surgery seasons and tender schedules. The firm invests in quality assurance and packaging upgrades to meet hospital procurement standards and is exploring partnerships for hydrophobic acrylic capacity. Expect modest growth tied to regional coverage and tender wins, with potential upside if the company deepens capabilities in premium lenses and surgeon training programs.
Market Key Players
HOYA CORPORATION
Aurolab
Truviz Ophthalmic
Johnson and Johnson Vision Care, Inc.
Global Ophthalmic Pvt. Ltd.
HumanOptics AG
EyeKon Medical, Inc.
Appasamy Associates
STAAR Surgical Company
Alcon, Inc.
Care Group Sight Solution Pvt. Ltd.
Bausch & Lomb Incorporated
Dahlgren India
Omni Lens Pvt Ltd
Lenstec, Inc.
Carl Zeiss Meditec AG
NanoVision
Other Key Players
Driver:
Rising Cataract Surgery Volumes Worldwide
As of 2025, cataract surgery is the most common eye procedure performed globally, with more than 30 million cases each year. The growing number of age-related cataracts affects over 80 million people around the world, increasing the pool of potential patients. Older populations in North America, Europe, Japan, and China are the main contributors, as the incidence of cataracts rises sharply after age 60.
Government Programs Driving IOL Adoption
Public health programs are boosting demand. Governments and health organizations are focusing on cataract elimination efforts, especially in Asia and Africa, where surgical backlogs are still high. Subsidized procedures, mobile surgical units, and public-private partnerships are speeding up the adoption of intraocular lenses in underserved areas. For investors, this ongoing rise in surgery numbers means steady, long-term demand for both standard and premium IOLs.
Restraint:
Limited Insurance Coverage for Premium IOLs
Even with strong clinical demand, reimbursement issues remain a significant barrier. Multifocal and toric IOLs, which often cost two to three times more than monofocal lenses, are often not covered by public or private insurance. In major markets like the United States, Medicare only covers basic monofocal lenses, shifting the cost of premium options to patients.
Affordability Barriers in Cost-Sensitive Markets
This pricing structure limits adoption mainly to higher-income patients and private-pay segments. In developing countries, where healthcare budgets are tight and out-of-pocket payments are common, the affordability issue is even more noticeable. Without broader reimbursement reforms or tiered pricing strategies, the penetration of premium IOLs will stay limited, slowing overall value growth despite their strong clinical benefits.
New lens technologies offer the best growth potential. Light-adjustable lenses, which allow for adjustments after surgery, are becoming more popular after gaining regulatory approval in the United States and Europe. These products help fix residual refractive errors and greatly improve patient satisfaction, making them an attractive premium option in cataract care.
Untapped Demand in Emerging Economies
Geographic expansion presents another major opportunity. Cataract surgery rates remain below 50% in some parts of Asia and Africa, highlighting a significant unmet need. Manufacturers that pair cost-effective monofocal lenses with select premium offerings are well placed to grow in these regions. Smart pricing, local manufacturing, and partnerships with government programs will be key to achieving volume-led growth.
Trend:
Rapid Adoption of EDOF Lens Technologies
Extended depth-of-focus (EDOF) lenses are becoming a major trend in 2025. These lenses provide continuous vision for near, intermediate, and far distances while minimizing visual disruptions common in multifocal designs. As a result, they are gaining acceptance among both surgeons and patients.
Premiumization of the IOL Market
Top manufacturers are expanding their EDOF product lines, backed by clinical evidence showing higher patient satisfaction and less reliance on glasses. Global adoption of EDOF lenses is expected to grow at over 8% annually through 2033. This trend highlights a broader shift toward premium offerings in the intraocular lens market, where differences increasingly rely on optical performance, customization, and patient-centered outcomes rather than just volume.
Recent Developments
Jan 2025 – Eyebright Medical Technology: The company’s Phakic intraocular lens, "Loong Crystal PR," received Class III Medical Device certification from China's National Medical Products Administration (NMPA). This approval opens access to the domestic Chinese market and strengthens the company's position in the phakic IOL segment.
Mar 2025 – Alcon: Alcon acquired LENSAR, a leader in femtosecond laser technology for cataract surgery, in a deal valued at approximately $356 million. The acquisition significantly bolsters Alcon's portfolio of advanced cataract surgery equipment, integrating laser precision into its lens offerings.
Apr 2025 – Alcon: The company launched its Clareon® PanOptix® Pro intraocular lens for cataract patients in the United States. This product features proprietary ENLIGHTEN® NXT Optical technology, which provides high light utilization and minimal light scatter, enhancing its premium trifocal IOL portfolio.
Aug 2025 – Alcon: In a major strategic move, Alcon announced the acquisition of STAAR Surgical for $1.5 billion. This transaction adds STAAR’s EVO ICL (Implantable Collamer Lens) technology to Alcon's portfolio, expanding its presence in the refractive vision correction market beyond traditional cataract solutions.
Sep 2025 – CooperCompanies: The parent company of CooperVision is reportedly exploring strategic alternatives, including a potential merger with Bausch + Lomb. Such a merger would create a dominant force in the global eye care market, combining strong contact lens and surgical portfolios.