Global Investment Banking Market Size, Share & Analysis By Service Type (Mergers and Acquisitions (M&A) Advisory, Debt Capital Markets, Equity Capital Markets, Syndicated Loans, Other Service Types), By End-User (Corporate Clients, Institutional Investors, Government and Public Sector, Individuals), By Deal Size, By Region Industry Overview, Fee Pool Dynamics, Competitive Benchmarking, Digitalization Trends & Forecast 2025–2034
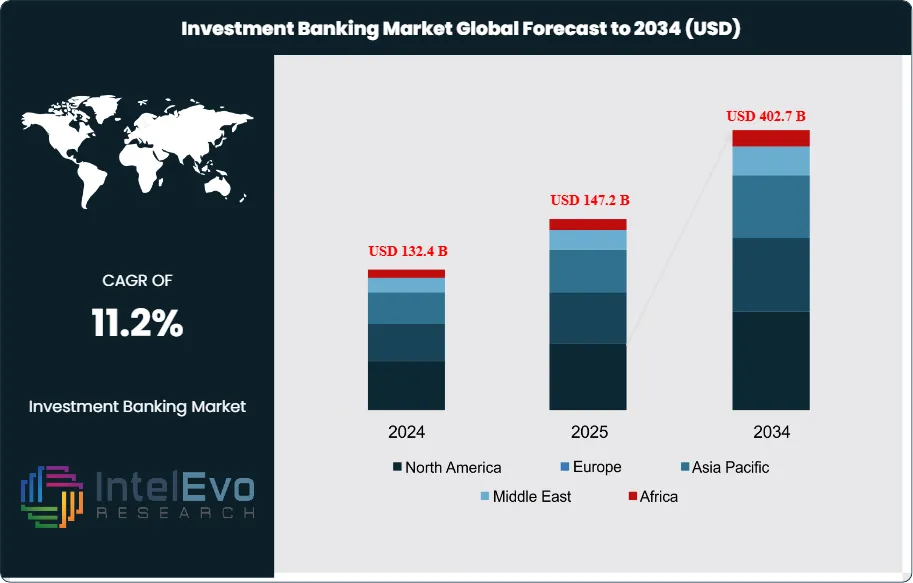
The Investment Banking Market is valued at approximately USD 132.4 billion in 2024 and is projected to reach nearly USD 402.7 billion by 2034, registering a robust CAGR of around 11.2% during 2025–2034. Growing deal activity in private markets, digital banking transformation, and rising cross-border M&A are reshaping global investment banking demand. With AI-driven analytics, automated advisory tools, and sovereign wealth fund expansion accelerating capital flows, the sector is entering a new phase of high-value strategic transactions and technology-enabled dealmaking.
The fee pool has expanded materially from its pandemic-era trough as equity issuance normalizes, debt capital markets reopen across investment-grade and high-yield tiers, and advisory pipelines remain elevated on the back of portfolio reshaping, carve-outs, and cross-border consolidation. North America retains clear primacy with a 38.9% revenue share—about USD 47.26 billion in 2023—supported by deep capital markets, robust private credit participation, and resilient corporate balance sheets. At the top end of the industry, scale advantages persist: the largest U.S. bank by market capitalization stood at USD 491.76 billion (assets: USD 3.744 trillion as of January 2024), underscoring the capital firepower and technology investment capacity shaping competitive dynamics.
Demand-side drivers include renewed CEO confidence, secular capex in energy transition and digital infrastructure, and the rise of private capital as both financing partner and buyer of assets. On the supply side, improved underwriting backlogs and tighter spreads are expanding deal viability, while balance-sheet optimization and risk transfer to private markets are freeing capacity. Policy and multilateral flows add momentum: the IFC’s record USD 56 billion commitment in FY2024 to private companies and financial institutions, the World Bank’s USD 1.5 billion for India’s low-carbon projects, and the ADB’s lending capacity exceeding USD 20 billion illustrate a durable pipeline in sustainable finance and emerging-market development.
Technological innovation is accelerating adoption and productivity. AI-enabled origination and diligence, model-driven pricing for syndications, digital client onboarding, and algorithmic execution are compressing cycle times and improving hit rates. Advanced analytics in market-making and risk transfer are also sharpening capital allocation, while tokenization of assets and real-time settlement remain watch areas for scalability and regulatory clarity. Key challenges persist: revenue cyclicality tied to rates and volatility, heavier conduct and capital requirements, cyber and model risk, and competition from fintechs and private platforms that disintermediate traditional workflows.
Regionally, North America will remain the anchor market, but investors should watch Asia—particularly India and ASEAN—where reform, infrastructure financing, and domestic capital formation are accelerating. Select EMEA hubs and the Gulf are poised to gain share via sovereign-led diversification and listings. Overall, the market’s trajectory reflects structurally broader participation, deeper sustainability mandates, and a technology-driven shift toward higher-velocity, insights-led banking.
Key Takeaways
Market Growth: The global Investment Banking market totaled USD 132.4 billion in 2024 and is projected to reach USD 402.7 billion by 2034 at a 11.2% CAGR (2025–2034), supported by reopening equity/debt issuance windows, robust advisory pipelines, and financing tied to energy transition and digital infrastructure.
Service Type (M&A Advisory): M&A Advisory led with 40.5% share in 2023, equivalent to roughly USD 49.2 billion of fee pool, reflecting portfolio reshaping, carve-outs, and cross-border consolidation that continue to drive high-value advisory mandates.
End User (Corporate Clients): Corporate clients accounted for 47.5% in 2023 (about USD 57.7 billion), underpinned by balance-sheet optimization, refinancing, and transformation programs that sustain multi-product mandates across advisory, ECM, and DCM.
Driver: Depth of capital markets remains a core growth engine—North America contributed 38.9% of global fees (about USD 47.26 billion in 2023)—while policy/multilateral flows (e.g., large-scale commitments to private-sector projects) expand pipelines in emerging markets and sustainability-linked finance.
Restraint: The industry’s revenue cyclicality and regional concentration elevate sensitivity to macro shocks; for example, a 5-percentage-point swing in North America’s share would shift roughly USD 6.1 billion of the 2023 global fee pool, pressuring utilization, staffing, and risk appetite.
Opportunity: APAC expansion and sustainable finance represent outsized upside; if APAC’s market share rises by 3–5 percentage points by 2033, this translates to ~USD 9.5–15.9 billion incremental annual fees on the 2033 market base, with green/transition financing and domestic listings as key catalysts.
Trend: Digitization and AI-enabled workflows (deal origination, diligence, KYC/AML, and execution) are compressing cycle times and boosting hit rates, while sustainability-linked and transition instruments broaden addressable fee pools as issuers target lower funding costs and investors seek measurable ESG outcomes.
Regional Analysis: North America remains the anchor at 38.9% of revenues given deep liquidity and private-capital participation; Asia (notably India and ASEAN) is set to outpace global growth on reforms, infrastructure finance, and active IPO calendars, while EMEA/Gulf benefit from sovereign-led diversification and listings momentum.
Type Analysis
M&A advisory remains the anchor product, accounting for an estimated ~40.5% of fee pools in 2023 and benefiting from a visible pipeline of portfolio realignments, carve-outs, and cross-border consolidation. After a cyclical trough, global M&A activity reaccelerated in late 2024 and into 2025—M&A value was up ~9% YTD to US$2.82 trillion by November 2024, setting the stage for stronger advisory revenues as financing markets normalize and boardroom confidence improves.
Debt Capital Markets (DCM) are set to be the volume workhorse through 2025–2026 as issuers tackle the refinancing wall. Investment-grade bond issuance reached ~US$1.5 trillion in 2024 (+~24% YoY), while high-yield issuance recovered to ~US$302 billion, aided by tighter spreads and robust demand; rating agencies forecast another year of issuance growth in 2025. The structural context is supportive: outstanding global corporate bonds climbed to ~US$35 trillion by end-2024. Syndicated lending also surged—global syndicated loans hit a record ~US$5.9 trillion in 2024 (+32% YoY)—underpinned by acquisition finance and large recapitalizations, with CLO demand reinforcing bank distribution capacity.
Equity Capital Markets (ECM) are gradually reopening. Global IPO proceeds totaled ~US$121 billion across 1,215 deals in 2024, then improved in H1-2025 to US$61.4 billion (+17%YoY), with record cross-border flows into U.S. venues. “Other” services—restructuring, fairness opinions, and strategic advisory—remain counter-cyclical buffers and are increasingly data- and AI-enabled, enhancing pitch conversion and diligence efficiency across the product suite.
Application Analysis
Strategic advisory and restructuring services are regaining momentum as CFOs optimize portfolios, exit noncore assets, and address higher-for-longer funding costs. Board-level mandates are increasingly tied to value-creation programs and synergy realization, sustaining fee density even when issuance windows are uneven. The rebound in announced deal value since late 2024 suggests a healthier conversion pipeline for 2025 closings as financing conditions stabilize.
Capital raising and refinancing applications dominate near-term activity. Issuers are front-loading 2025–2026 maturities into favorable windows, reflected in the ~US$1.5 trillion IG and ~US$302 billion HY prints in 2024 and rating-agency expectations for continued growth in 2025. IPOs and follow-ons are selectively active—H1-2025 IPO proceeds rose 17% YoY—with cross-border listings and sector-specific themes (industrial tech, energy transition) leading.
Sustainability-linked and transition finance remain a structural application across DCM and ECM. While definitions and disclosure standards continue to evolve, investor demand for credible transition pathways and use-of-proceeds transparency is supporting steady deal flow and premium pricing for high-quality issuers, particularly in Europe and parts of Asia.
End-Use Analysis
Corporate clients are the largest demand pool (about ~47.5% share in 2023), leveraging multi-product mandates that combine M&A advisory with bridge-to-bond/refi strategies. The reopening of new-money and liability-management windows—plus healthy equity follow-ons (global equity issuance rose ~21.5% in 2024)—has reinforced wallet concentration among frequent issuers.
Institutional investors (pension funds, insurers, asset managers) drive underwriting depth and secondary liquidity. Their role is expanding via alternatives and private credit allocations; notably, U.S. CLO new-issue volume reached ~US$202 billion in 2024, while CLO ETF AUM grew from ~US$6.3 billion (Dec-2023) to ~US$22.5 billion (Dec-2024) and ~US$32 billion by mid-2025, buttressing demand for broadly syndicated loans.
Government & public sector clients remain pivotal for sovereign, agency, and infrastructure issuance, using banks for structuring, ESG labeling, and cross-jurisdictional distribution. Individuals/entrepreneurs and family offices—though a smaller slice—are increasingly active in pre-IPO placements, SPAC-like alternatives, and secondary blocks, aided by digital access and the institutionalization of private-markets platforms.
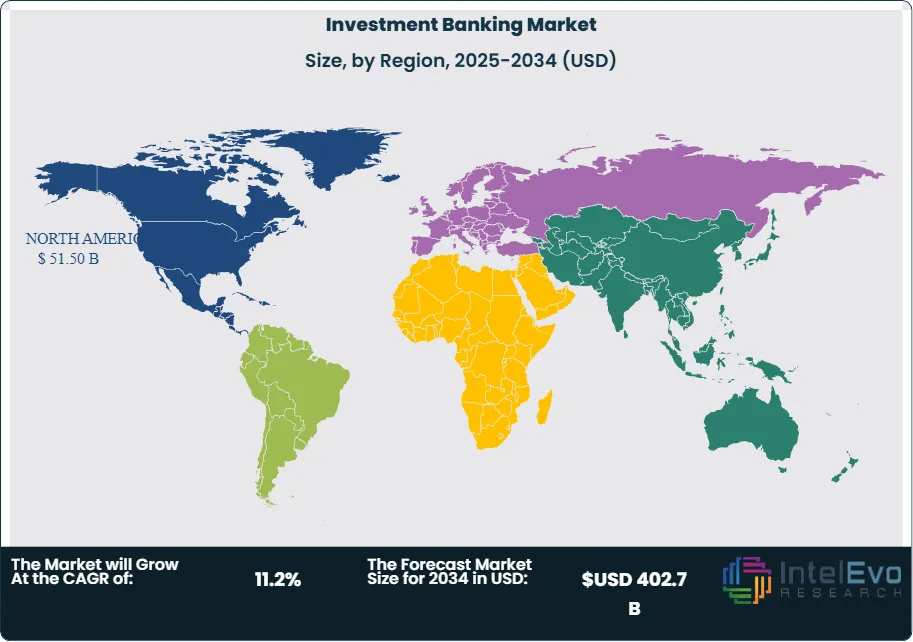
Regional Analysis
North America retains primacy with a ~38.9% revenue share (about US$51.50 billion in 2024), underpinned by deep dollar liquidity, private-capital participation, and outsized structured-finance activity that reached post-crisis highs in 2024. Europe remains a diversified fee pool with strong ESG issuance and a rapidly expanding private-credit ecosystem; European CLO issuance nearly doubled in 2024 as investors chased yield, and lawyers structured more complex private-credit deals across fragmented jurisdictions.
Asia Pacific is the key growth theatre. H1-2025 saw US$61.4 billion in IPO proceeds globally (+17% YoY) with high cross-border participation; India’s IPO market set a 2024 record at ~US$20.5 billion and carries a strong 2025 pipeline, signaling continued wallet mix shift toward APAC exchanges and depository receipts. Latin America and the Middle East & Africa are emerging hotspots, supported by sovereign diversification agendas, privatizations, and infrastructure finance, albeit with higher policy and FX risk premia.
By Service Type (Mergers and Acquisitions (M&A) Advisory, Debt Capital Markets, Equity Capital Markets, Syndicated Loans, Other Service Types), By End-User (Corporate Clients, Institutional Investors, Government and Public Sector, Individuals)
Research Methodology
Primary Research- 100 Interviews of Stakeholders
Secondary Research
Desk Research
Regional scope
North America (United States, Canada, Mexico)
Latin America (Brazil, Argentina, Columbia)
East Asia And Pacific (China, Japan, South Korea, Australia, Cambodia, Fiji, Indonesia)
Sea And South Asia (India, Singapore, Thailand, Taiwan, Malaysia)
Eastern Europe (Poland, Russia, Czech Republic, Romania)
Western Europe (Germany, U.K., France, Spain, Itlay)
Middle East & Africa (GCC Countries, Egypt, Nigeria, South Africa, Israel)
Competitive Landscape
Deutsche Bank AG, Citigroup Inc., Nomura Holdings, Inc., Goldman Sachs Group, Inc., UBS Group AG, Barclays PLC, HSBC Holdings plc, Morgan Stanley, BNP Paribas, JPMorgan Chase & Co., Wells Fargo, Credit Suisse Group, Bank of America Corporation, Other Key Player
Customization Scope
Customization for segments, region/country-level will be provided. Moreover, additional customization can be done based on the requirements.
Pricing and Purchase Options
Avail customized purchase options to meet your exact research needs. We have three licenses to opt for: Single User License, Multi-User License (Up to 5 Users), Corporate Use License (Unlimited User and Printable PDF).
TABLE OF CONTENTS
1. EXECUTIVE SUMMARY
1.1. MARKET SNAPSHOT
1.2. KEY FINDINGS & INSIGHTS
1.3. ANALYST RECOMMENDATIONS
1.4. FUTURE OUTLOOK
2. RESEARCH METHODOLOGY
2.1. MARKET DEFINITION & SCOPE
2.2. RESEARCH OBJECTIVES: PRIMARY & SECONDARY DATA SOURCES
2.3. DATA COLLECTION SOURCES
2.3.1. COVERAGE OF 100+ PRIMARY RESEARCH/CONSULTATION CALLS WITH INDUSTRY STAKEHOLDERS
FIGURE 17 NORTH AMERICA INVESTMENT BANKING CURRENT AND FUTURE TYPE ANALYSIS, 2025–2034, (USD MILLION)
FIGURE 18 NORTH AMERICA INVESTMENT BANKING CURRENT AND FUTURE END USER ANALYSIS, 2025–2034, (USD MILLION)
FIGURE 19 MARKET SHARE BY COUNTRY
FIGURE 20 LATIN AMERICA INVESTMENT BANKING CURRENT AND FUTURE TYPE ANALYSIS, 2025–2034, (USD MILLION)
FIGURE 21 LATIN AMERICA INVESTMENT BANKING CURRENT AND FUTURE END USER ANALYSIS, 2025–2034, (USD MILLION)
FIGURE 22 MARKET SHARE BY COUNTRY
FIGURE 23 EASTERN EUROPE INVESTMENT BANKING CURRENT AND FUTURE TYPE ANALYSIS, 2025–2034, (USD MILLION)
FIGURE 24 EASTERN EUROPE INVESTMENT BANKING CURRENT AND FUTURE END USER ANALYSIS, 2025–2034, (USD MILLION)
FIGURE 25 MARKET SHARE BY COUNTRY
FIGURE 26 WESTERN EUROPE INVESTMENT BANKING CURRENT AND FUTURE TYPE ANALYSIS, 2025–2034, (USD MILLION)
FIGURE 27 WESTERN EUROPE INVESTMENT BANKING CURRENT AND FUTURE END USER ANALYSIS, 2025–2034, (USD MILLION)
FIGURE 28 MARKET SHARE BY COUNTRY
FIGURE 29 EAST ASIA AND PACIFIC INVESTMENT BANKING CURRENT AND FUTURE TYPE ANALYSIS, 2025–2034, (USD MILLION)
FIGURE 30 EAST ASIA AND PACIFIC INVESTMENT BANKING CURRENT AND FUTURE END USER ANALYSIS, 2025–2034, (USD MILLION)
FIGURE 31 MARKET SHARE BY COUNTRY
FIGURE 32 SEA AND SOUTH ASIA INVESTMENT BANKING CURRENT AND FUTURE TYPE ANALYSIS, 2025–2034, (USD MILLION)
FIGURE 33 SEA AND SOUTH ASIA INVESTMENT BANKING CURRENT AND FUTURE END USER ANALYSIS, 2025–2034, (USD MILLION)
FIGURE 34 MARKET SHARE BY COUNTRY
FIGURE 35 MIDDLE EAST AND AFRICA INVESTMENT BANKING CURRENT AND FUTURE TYPE ANALYSIS, 2025–2034, (USD MILLION)
FIGURE 36 MIDDLE EAST AND AFRICA INVESTMENT BANKING CURRENT AND FUTURE END USER ANALYSIS, 2025–2034, (USD MILLION)
FIGURE 37 NORTH AMERICA INVESTMENT BANKING CURRENT AND FUTURE MARKET VOLUME SHARE REGIONAL ANALYSIS, 2025–2034, (USD MILLION)
FIGURE 38 U.S. INVESTMENT BANKING CURRENT AND FUTURE TYPE ANALYSIS, 2025–2034, (USD MILLION)
FIGURE 39 U.S. INVESTMENT BANKING CURRENT AND FUTURE END USER ANALYSIS, 2025–2034, (USD MILLION)
FIGURE 40 CANADA INVESTMENT BANKING CURRENT AND FUTURE TYPE ANALYSIS, 2025–2034, (USD MILLION)
FIGURE 41 CANADA INVESTMENT BANKING CURRENT AND FUTURE END USER ANALYSIS, 2025–2034, (USD MILLION)
FIGURE 42 LATIN AMERICA INVESTMENT BANKING CURRENT AND FUTURE MARKET VOLUME SHARE REGIONAL ANALYSIS, 2025–2034, (USD MILLION)
FIGURE 43 MEXICO INVESTMENT BANKING CURRENT AND FUTURE TYPE ANALYSIS, 2025–2034, (USD MILLION)
FIGURE 44 MEXICO INVESTMENT BANKING CURRENT AND FUTURE END USER ANALYSIS, 2025–2034, (USD MILLION)
FIGURE 45 BRAZIL INVESTMENT BANKING CURRENT AND FUTURE TYPE ANALYSIS, 2025–2034, (USD MILLION)
FIGURE 46 BRAZIL INVESTMENT BANKING CURRENT AND FUTURE END USER ANALYSIS, 2025–2034, (USD MILLION)
FIGURE 47 ARGENTINA INVESTMENT BANKING CURRENT AND FUTURE TYPE ANALYSIS, 2025–2034, (USD MILLION)
FIGURE 48 ARGENTINA INVESTMENT BANKING CURRENT AND FUTURE END USER ANALYSIS, 2025–2034, (USD MILLION)
FIGURE 49 COLUMBIA INVESTMENT BANKING CURRENT AND FUTURE TYPE ANALYSIS, 2025–2034, (USD MILLION)
FIGURE 50 COLUMBIA INVESTMENT BANKING CURRENT AND FUTURE END USER ANALYSIS, 2025–2034, (USD MILLION)
FIGURE 51 REST OF LATIN AMERICA INVESTMENT BANKING CURRENT AND FUTURE TYPE ANALYSIS, 2025–2034, (USD MILLION)
FIGURE 52 REST OF LATIN AMERICA INVESTMENT BANKING CURRENT AND FUTURE END USER ANALYSIS, 2025–2034, (USD MILLION)
FIGURE 53 EASTERN EUROPE INVESTMENT BANKING CURRENT AND FUTURE MARKET VOLUME SHARE REGIONAL ANALYSIS, 2025–2034, (USD MILLION)
FIGURE 54 POLAND INVESTMENT BANKING CURRENT AND FUTURE TYPE ANALYSIS, 2025–2034, (USD MILLION)
FIGURE 55 POLAND INVESTMENT BANKING CURRENT AND FUTURE END USER ANALYSIS, 2025–2034, (USD MILLION)
FIGURE 56 RUSSIA INVESTMENT BANKING CURRENT AND FUTURE TYPE ANALYSIS, 2025–2034, (USD MILLION)
FIGURE 57 RUSSIA INVESTMENT BANKING CURRENT AND FUTURE END USER ANALYSIS, 2025–2034, (USD MILLION)
FIGURE 58 CZECH REPUBLIC INVESTMENT BANKING CURRENT AND FUTURE TYPE ANALYSIS, 2025–2034, (USD MILLION)
FIGURE 59 CZECH REPUBLIC INVESTMENT BANKING CURRENT AND FUTURE END USER ANALYSIS, 2025–2034, (USD MILLION)
FIGURE 60 ROMANIA INVESTMENT BANKING CURRENT AND FUTURE TYPE ANALYSIS, 2025–2034, (USD MILLION)
FIGURE 61 ROMANIA INVESTMENT BANKING CURRENT AND FUTURE END USER ANALYSIS, 2025–2034, (USD MILLION)
FIGURE 62 REST OF EASTERN EUROPE INVESTMENT BANKING CURRENT AND FUTURE TYPE ANALYSIS, 2025–2034, (USD MILLION)
FIGURE 63 REST OF EASTERN EUROPE INVESTMENT BANKING CURRENT AND FUTURE END USER ANALYSIS, 2025–2034, (USD MILLION)
FIGURE 64 WESTERN EUROPE INVESTMENT BANKING CURRENT AND FUTURE MARKET VOLUME SHARE REGIONAL ANALYSIS, 2025–2034, (USD MILLION)
FIGURE 65 GERMANY INVESTMENT BANKING CURRENT AND FUTURE TYPE ANALYSIS, 2025–2034, (USD MILLION)
FIGURE 66 GERMANY INVESTMENT BANKING CURRENT AND FUTURE END USER ANALYSIS, 2025–2034, (USD MILLION)
FIGURE 67 FRANCE INVESTMENT BANKING CURRENT AND FUTURE TYPE ANALYSIS, 2025–2034, (USD MILLION)
FIGURE 68 FRANCE INVESTMENT BANKING CURRENT AND FUTURE END USER ANALYSIS, 2025–2034, (USD MILLION)
FIGURE 69 UK INVESTMENT BANKING CURRENT AND FUTURE TYPE ANALYSIS, 2025–2034, (USD MILLION)
FIGURE 70 UK INVESTMENT BANKING CURRENT AND FUTURE END USER ANALYSIS, 2025–2034, (USD MILLION)
FIGURE 71 SPAIN INVESTMENT BANKING CURRENT AND FUTURE TYPE ANALYSIS, 2025–2034, (USD MILLION)
FIGURE 72 SPAIN INVESTMENT BANKING CURRENT AND FUTURE END USER ANALYSIS, 2025–2034, (USD MILLION)
FIGURE 73 ITALY INVESTMENT BANKING CURRENT AND FUTURE TYPE ANALYSIS, 2025–2034, (USD MILLION)
FIGURE 74 ITALY INVESTMENT BANKING CURRENT AND FUTURE END USER ANALYSIS, 2025–2034, (USD MILLION)
FIGURE 75 REST OF WESTERN EUROPE INVESTMENT BANKING CURRENT AND FUTURE TYPE ANALYSIS, 2025–2034, (USD MILLION)
FIGURE 76 REST OF WESTERN EUROPE INVESTMENT BANKING CURRENT AND FUTURE END USER ANALYSIS, 2025–2034, (USD MILLION)
FIGURE 77 EAST ASIA AND PACIFIC INVESTMENT BANKING CURRENT AND FUTURE MARKET VOLUME SHARE REGIONAL ANALYSIS, 2025–2034, (USD MILLION)
FIGURE 78 CHINA INVESTMENT BANKING CURRENT AND FUTURE TYPE ANALYSIS, 2025–2034, (USD MILLION)
FIGURE 79 CHINA INVESTMENT BANKING CURRENT AND FUTURE END USER ANALYSIS, 2025–2034, (USD MILLION)
FIGURE 80 JAPAN INVESTMENT BANKING CURRENT AND FUTURE TYPE ANALYSIS, 2025–2034, (USD MILLION)
FIGURE 81 JAPAN INVESTMENT BANKING CURRENT AND FUTURE END USER ANALYSIS, 2025–2034, (USD MILLION)
FIGURE 82 AUSTRALIA INVESTMENT BANKING CURRENT AND FUTURE TYPE ANALYSIS, 2025–2034, (USD MILLION)
FIGURE 83 AUSTRALIA INVESTMENT BANKING CURRENT AND FUTURE END USER ANALYSIS, 2025–2034, (USD MILLION)
FIGURE 84 CAMBODIA INVESTMENT BANKING CURRENT AND FUTURE TYPE ANALYSIS, 2025–2034, (USD MILLION)
FIGURE 85 CAMBODIA INVESTMENT BANKING CURRENT AND FUTURE END USER ANALYSIS, 2025–2034, (USD MILLION)
FIGURE 86 FIJI INVESTMENT BANKING CURRENT AND FUTURE TYPE ANALYSIS, 2025–2034, (USD MILLION)
FIGURE 87 FIJI INVESTMENT BANKING CURRENT AND FUTURE END USER ANALYSIS, 2025–2034, (USD MILLION)
FIGURE 88 INDONESIA INVESTMENT BANKING CURRENT AND FUTURE TYPE ANALYSIS, 2025–2034, (USD MILLION)
FIGURE 89 INDONESIA INVESTMENT BANKING CURRENT AND FUTURE END USER ANALYSIS, 2025–2034, (USD MILLION)
FIGURE 90 SOUTH KOREA INVESTMENT BANKING CURRENT AND FUTURE TYPE ANALYSIS, 2025–2034, (USD MILLION)
FIGURE 91 SOUTH KOREA INVESTMENT BANKING CURRENT AND FUTURE END USER ANALYSIS, 2025–2034, (USD MILLION)
FIGURE 92 REST OF EAST ASIA AND PACIFIC INVESTMENT BANKING CURRENT AND FUTURE TYPE ANALYSIS, 2025–2034, (USD MILLION)
FIGURE 93 REST OF EAST ASIA AND PACIFIC INVESTMENT BANKING CURRENT AND FUTURE END USER ANALYSIS, 2025–2034, (USD MILLION)
FIGURE 94 SEA AND SOUTH ASIA INVESTMENT BANKING CURRENT AND FUTURE MARKET VOLUME SHARE REGIONAL ANALYSIS, 2025–2034, (USD MILLION)
FIGURE 95 BANGLADESH INVESTMENT BANKING CURRENT AND FUTURE TYPE ANALYSIS, 2025–2034, (USD MILLION)
FIGURE 96 BANGLADESH INVESTMENT BANKING CURRENT AND FUTURE END USER ANALYSIS, 2025–2034, (USD MILLION)
FIGURE 97 NEW ZEALAND INVESTMENT BANKING CURRENT AND FUTURE TYPE ANALYSIS, 2025–2034, (USD MILLION)
FIGURE 98 NEW ZEALAND INVESTMENT BANKING CURRENT AND FUTURE END USER ANALYSIS, 2025–2034, (USD MILLION)
FIGURE 99 INDIA INVESTMENT BANKING CURRENT AND FUTURE TYPE ANALYSIS, 2025–2034, (USD MILLION)
FIGURE 100 INDIA INVESTMENT BANKING CURRENT AND FUTURE END USER ANALYSIS, 2025–2034, (USD MILLION)
FIGURE 101 SINGAPORE INVESTMENT BANKING CURRENT AND FUTURE TYPE ANALYSIS, 2025–2034, (USD MILLION)
FIGURE 102 SINGAPORE INVESTMENT BANKING CURRENT AND FUTURE END USER ANALYSIS, 2025–2034, (USD MILLION)
FIGURE 103 THAILAND INVESTMENT BANKING CURRENT AND FUTURE TYPE ANALYSIS, 2025–2034, (USD MILLION)
FIGURE 104 THAILAND INVESTMENT BANKING CURRENT AND FUTURE END USER ANALYSIS, 2025–2034, (USD MILLION)
FIGURE 105 TAIWAN INVESTMENT BANKING CURRENT AND FUTURE TYPE ANALYSIS, 2025–2034, (USD MILLION)
FIGURE 106 TAIWAN INVESTMENT BANKING CURRENT AND FUTURE END USER ANALYSIS, 2025–2034, (USD MILLION)
FIGURE 107 MALAYSIA INVESTMENT BANKING CURRENT AND FUTURE TYPE ANALYSIS, 2025–2034, (USD MILLION)
FIGURE 108 MALAYSIA INVESTMENT BANKING CURRENT AND FUTURE END USER ANALYSIS, 2025–2034, (USD MILLION)
FIGURE 109 REST OF SEA AND SOUTH ASIA INVESTMENT BANKING CURRENT AND FUTURE TYPE ANALYSIS, 2025–2034, (USD MILLION)
FIGURE 110 REST OF SEA AND SOUTH ASIA INVESTMENT BANKING CURRENT AND FUTURE END USER ANALYSIS, 2025–2034, (USD MILLION)
FIGURE 111 MIDDLE EAST AND AFRICA INVESTMENT BANKING CURRENT AND FUTURE MARKET VOLUME SHARE REGIONAL ANALYSIS, 2025–2034, (USD MILLION)
FIGURE 112 GCC COUNTRIES INVESTMENT BANKING CURRENT AND FUTURE TYPE ANALYSIS, 2025–2034, (USD MILLION)
FIGURE 113 GCC COUNTRIES INVESTMENT BANKING CURRENT AND FUTURE END USER ANALYSIS, 2025–2034, (USD MILLION)
FIGURE 114 SAUDI ARABIA INVESTMENT BANKING CURRENT AND FUTURE TYPE ANALYSIS, 2025–2034, (USD MILLION)
FIGURE 115 SAUDI ARABIA INVESTMENT BANKING CURRENT AND FUTURE END USER ANALYSIS, 2025–2034, (USD MILLION)
FIGURE 116 UAE INVESTMENT BANKING CURRENT AND FUTURE TYPE ANALYSIS, 2025–2034, (USD MILLION)
FIGURE 117 UAE INVESTMENT BANKING CURRENT AND FUTURE END USER ANALYSIS, 2025–2034, (USD MILLION)
FIGURE 118 BAHRAIN INVESTMENT BANKING CURRENT AND FUTURE TYPE ANALYSIS, 2025–2034, (USD MILLION)
FIGURE 119 BAHRAIN INVESTMENT BANKING CURRENT AND FUTURE END USER ANALYSIS, 2025–2034, (USD MILLION)
FIGURE 120 KUWAIT INVESTMENT BANKING CURRENT AND FUTURE TYPE ANALYSIS, 2025–2034, (USD MILLION)
FIGURE 121 KUWAIT INVESTMENT BANKING CURRENT AND FUTURE END USER ANALYSIS, 2025–2034, (USD MILLION)
FIGURE 122 OMAN INVESTMENT BANKING CURRENT AND FUTURE TYPE ANALYSIS, 2025–2034, (USD MILLION)
FIGURE 123 OMAN INVESTMENT BANKING CURRENT AND FUTURE END USER ANALYSIS, 2025–2034, (USD MILLION)
FIGURE 124 QATAR INVESTMENT BANKING CURRENT AND FUTURE TYPE ANALYSIS, 2025–2034, (USD MILLION)
FIGURE 125 QATAR INVESTMENT BANKING CURRENT AND FUTURE END USER ANALYSIS, 2025–2034, (USD MILLION)
FIGURE 126 EGYPT INVESTMENT BANKING CURRENT AND FUTURE TYPE ANALYSIS, 2025–2034, (USD MILLION)
FIGURE 127 EGYPT INVESTMENT BANKING CURRENT AND FUTURE END USER ANALYSIS, 2025–2034, (USD MILLION)
FIGURE 128 NIGERIA INVESTMENT BANKING CURRENT AND FUTURE TYPE ANALYSIS, 2025–2034, (USD MILLION)
FIGURE 129 NIGERIA INVESTMENT BANKING CURRENT AND FUTURE END USER ANALYSIS, 2025–2034, (USD MILLION)
FIGURE 130 SOUTH AFRICA INVESTMENT BANKING CURRENT AND FUTURE TYPE ANALYSIS, 2025–2034, (USD MILLION)
FIGURE 131 SOUTH AFRICA INVESTMENT BANKING CURRENT AND FUTURE END USER ANALYSIS, 2025–2034, (USD MILLION)
FIGURE 132 ISRAEL INVESTMENT BANKING CURRENT AND FUTURE TYPE ANALYSIS, 2025–2034, (USD MILLION)
FIGURE 133 ISRAEL INVESTMENT BANKING CURRENT AND FUTURE END USER ANALYSIS, 2025–2034, (USD MILLION)
FIGURE 134 REST OF MEA INVESTMENT BANKING CURRENT AND FUTURE TYPE ANALYSIS, 2025–2034, (USD MILLION)
FIGURE 135 REST OF MEA INVESTMENT BANKING CURRENT AND FUTURE END USER ANALYSIS, 2025–2034, (USD MILLION)
FIGURE 136 U. S. MARKET SHARE ANALYSIS BY TYPE (2024)
FIGURE 137 U. S. MARKET SHARE ANALYSIS BY END USER (2024)
FIGURE 138 CANADA MARKET SHARE ANALYSIS BY TYPE (2024)
FIGURE 139 CANADA MARKET SHARE ANALYSIS BY END USER (2024)
FIGURE 140 MEXICO MARKET SHARE ANALYSIS BY TYPE (2024)
FIGURE 141 MEXICO MARKET SHARE ANALYSIS BY END USER (2024)
FIGURE 142 CHINA MARKET SHARE ANALYSIS BY TYPE (2024)
FIGURE 143 CHINA MARKET SHARE ANALYSIS BY END USER (2024)
FIGURE 144 JAPAN MARKET SHARE ANALYSIS BY TYPE (2024)
FIGURE 145 JAPAN MARKET SHARE ANALYSIS BY END USER (2024)
FIGURE 146 INDIA MARKET SHARE ANALYSIS BY TYPE (2024)
FIGURE 147 INDIA MARKET SHARE ANALYSIS BY END USER (2024)
FIGURE 148 SOUTH KOREA MARKET SHARE ANALYSIS BY TYPE (2024)
FIGURE 149 SOUTH KOREA MARKET SHARE ANALYSIS BY END USER (2024)
FIGURE 150 SAUDI ARABIA MARKET SHARE ANALYSIS BY TYPE (2024)
FIGURE 151 SAUDI ARABIA MARKET SHARE ANALYSIS BY END USER (2024)
FIGURE 152 UAE MARKET SHARE ANALYSIS BY TYPE (2024)
FIGURE 153 UAE MARKET SHARE ANALYSIS BY END USER (2024)
FIGURE 154 EGYPT MARKET SHARE ANALYSIS BY TYPE (2024)
FIGURE 155 EGYPT MARKET SHARE ANALYSIS BY END USER (2024)
FIGURE 156 NIGERIA MARKET SHARE ANALYSIS BY TYPE (2024)
FIGURE 157 NIGERIA MARKET SHARE ANALYSIS BY END USER (2024)
FIGURE 158 SOUTH AFRICA MARKET SHARE ANALYSIS BY TYPE (2024)
FIGURE 159 SOUTH AFRICA MARKET SHARE ANALYSIS BY END USER (2024)
FIGURE 160 GERMANY MARKET SHARE ANALYSIS BY TYPE (2024)
FIGURE 161 GERMANY MARKET SHARE ANALYSIS BY END USER (2024)
FIGURE 162 FRANCE MARKET SHARE ANALYSIS BY TYPE (2024)
FIGURE 163 FRANCE MARKET SHARE ANALYSIS BY END USER (2024)
FIGURE 164 UK MARKET SHARE ANALYSIS BY TYPE (2024)
FIGURE 165 UK MARKET SHARE ANALYSIS BY END USER (2024)
FIGURE 166 SPAIN MARKET SHARE ANALYSIS BY TYPE (2024)
FIGURE 167 SPAIN MARKET SHARE ANALYSIS BY END USER (2024)
FIGURE 168 ITALY MARKET SHARE ANALYSIS BY TYPE (2024)
FIGURE 169 ITALY MARKET SHARE ANALYSIS BY END USER (2024)
FIGURE 170 BRAZIL MARKET SHARE ANALYSIS BY TYPE (2024)
FIGURE 171 BRAZIL MARKET SHARE ANALYSIS BY END USER (2024)
FIGURE 172 ARGENTINA MARKET SHARE ANALYSIS BY TYPE (2024)
FIGURE 173 ARGENTINA MARKET SHARE ANALYSIS BY END USER (2024)
FIGURE 174 COLUMBIA MARKET SHARE ANALYSIS BY TYPE (2024)
FIGURE 175 COLUMBIA MARKET SHARE ANALYSIS BY END USER (2024)
FIGURE 176 GLOBAL INVESTMENT BANKING CURRENT AND FUTURE MARKET KEY COUNTRY LEVEL ANALYSIS, 2024–2034, (USD MILLION)
FIGURE 177 FINANCIAL OVERVIEW:
Key Player Analysis
JPMorgan Chase & Co.: Leader. JPMorgan maintains the top position in global investment-banking fees year-to-date 2025, reflecting broad strength across M&A, ECM, DCM, and loans. The firm consolidated its businesses into a unified Commercial & Investment Bank in 2024, reporting $8.9 billion of investment-banking fees that year and ending 2024 with a 15.7% CET1 ratio, underscoring scale and balance-sheet resilience. Strategic priorities include deepening sponsor coverage, scaling private-capital and hedging solutions, and deploying LLM Suite—its in-house generative-AI assistant—to tens of thousands of employees to accelerate origination, research, and client service. These moves improve cross-sell on multi-product mandates and shorten execution cycles, reinforcing share gains in 2025.
Goldman Sachs Group, Inc.: Challenger/Category leader in M&A. Goldman entered 2025 with strong momentum after lifting 2024 net revenues 16% to $53.5 billion and delivering a standout first half in equities and advisory; 2Q25 brought record equities revenue and a 26% jump in investment-banking revenue. The franchise remains a product leader in global M&A fees YTD 2025, while its strategy pivots around scaling Asset & Wealth Management, including >$70 billion raised in alternatives in 2024, and expanding private-credit/financing solutions. Differentiation rests on sponsor connectivity, complex risk intermediation, and a growing alternatives platform that ties fee businesses to durable AUM economics.
Morgan Stanley: Innovator (wealth-led universal advisor). Under CEO Ted Pick, Morgan Stanley is leveraging its scaled wealth and investment-management engine to feed advisory and capital-markets pipelines, with total client assets reaching $8.2 trillion in 2Q25. The firm has embedded OpenAI-powered assistants across wealth—>98% advisor adoption—and is extending AI tools into institutional securities to compress diligence and pitch cycles. Selective, bolt-on M&A remains on the table to deepen capabilities in high-growth adjacencies, while the integrated model (Wealth + Institutional Securities + Investment Management) supports resilient fee mix and capital-light growth.
Bank of America Corporation: Scaled universal bank/Challenger. BofA’s investment-banking recovery accelerated into late 2024 with IB fees up 44% in 4Q24, and it holds a top-three global fee position YTD 2025. The franchise differentiates through end-to-end distribution (BofA Securities) and a powerful digital core: the Erica AI assistant surpassed 3 billion client interactions by August 2025, while total digital interactions topped 26 billion earlier in the year—evidence of data assets that increasingly inform origination and distribution. Trading durability and a broad corporate client base support wallet capture across DCM, loans, and risk solutions as issuance windows normalize in 2025.
As of 2025, dealmaking conditions have improved across multiple fee pools, creating a broader base of demand for investment banks. Issuers are actively addressing the 2025–2027 “refinancing wall,” with U.S. corporate bond issuance reaching ~$1.45 trillion by end-August 2025 (+3.6% YoY), while global equity issuance rebounded to $504.8 billion in 2024 (+21.5% YoY), signaling healthier risk appetite and underwriting pipelines. IPO activity also regained momentum—H1 2025 listings raised $61.4 billion (+17% YoY)—and announced M&A value accelerated into late 2024, providing a fuller advisory backlog into 2025. Together, these dynamics expand fee visibility across DCM, ECM, and advisory.
Cross-Selling & Multi-Product Mandates Boosting Fee Depth and Utilization
Strategically, sustained issuance windows and a richer M&A slate enable banks to cross-sell bridge-to-bond solutions, hedging, and liability management, lifting share of wallet on multi-product mandates while improving operating leverage as utilization rises.
Regulatory intensity and shifting economics of intermediation continue to constrain risk capacity and returns. While capital markets are open, global long-term fixed-income issuance fell 1.9% in 2024 and mid-market M&A remained subdued, underscoring cyclicality and the sensitivity of fee pools to rates and volatility. Simultaneously, alternative lenders now intermediate a growing slice of credit; private credit neared $2 trillion globally by mid-2024, diverting financings that once flowed through bank balance sheets and syndicated markets.
Fewer Larger Deals Intensifying Competition and Compressing Fees
The quantifiable impact is a persistent mix shift: fewer, larger transactions (deal value up, deal count down in 2025) compress the opportunity set for mid-ticket fees and intensify competition on marquee mandates, pressuring pricing and returns without tighter cost discipline and sharper sector specialization.
Two secular vectors offer outsized upside for 2025–2027. First, sustainability-linked finance is scaling: aligned GSS+ issuance reached ~$1.05 trillion in 2024 (+31% YoY), establishing a repeat-issuance cohort across sovereigns, SSAs, and corporates. Banks that standardize verification, impact reporting, and transition-linked structures can capture premium economics and deepen client stickiness.
Second, cross-border equity flows and APAC activity are rising—H1 2025 set record cross-border participation, with 62% of U.S. IPOs by foreign issuers—expanding advisory, listing, and follow-on opportunities. Building Asia-centric coverage, local syndication partnerships, and depository receipt capabilities can unlock double-digit growth in ECM and ancillary services. (
The operating model is digitizing end-to-end while wallet mix tilts to larger, more complex transactions. Banks are deploying AI for origination screening, diligence automation, and model-driven pricing; on the product side, thematic finance continues to outgrow the market—aligned sustainable debt now totals $6.9 trillion cumulatively, with $670.9 billion of aligned green bonds in 2024—embedding ESG analytics into structuring and distribution.
Market Shifting Toward Larger Complex Deals Favoring Scaled Global Banks
Concurrently, the market is skewing toward “fewer but bigger” deals—2025 YTD shows higher aggregate M&A value despite fewer transactions—favoring firms with sector depth, balance-sheet solutions, and global distribution. Leaders will pair data-driven coverage with scalable execution (e.g., digital KYC/AML, automated bookbuilding) to compress cycle times and defend margins as competition from private platforms intensifies.
Recent Developments
Dec 2024 – Goldman Sachs Group, Inc.: CEO David Solomon signaled that 2025 dealmaking in M&A and equities could meet or exceed 10-year averages, pointing to improving CEO confidence and reopening issuance windows. Strategic impact: Sets a bullish tone for advisory and underwriting pipelines entering 2025, supporting wallet share gains in fee-rich segments.
Feb 2025 – Bank of America Corporation: The bank reported 26 billion digital client interactions in 2024 (+12% YoY) and said Erica® surpassed 2.5 billion cumulative interactions across ~20 million users, underscoring rapid AI-driven engagement at scale. Strategic impact: Expanding digital reach enhances cross-sell and origination efficiency, deepening relationships ahead of a busier issuance cycle.
Apr 2025 – JPMorgan Chase & Co.: JPMorgan formally highlighted the integration of its Commercial & Investment Bank, consolidating coverage, financing, and risk solutions under a single platform to improve client delivery and operating leverage. Strategic impact: Unifying franchises strengthens end-to-end execution (bridge-to-bond, hedging, and advisory), reinforcing #1 positioning in global fee pools.
Jul 2025 – Goldman Sachs Group, Inc.: Q2 results featured record equities net revenues (~$4.3 billion) and total quarterly net revenues of $14.6 billion, with advisory remaining solid as activity normalized. Strategic impact: Demonstrates product leadership in trading and a resurgent fee engine, bolstering capacity to invest in talent, technology, and private-capital adjacencies.
Sep 2025 – UBS Group AG: The Swiss government opened consultation on a capital framework that could require UBS to add ~$24 billion over a seven-year phase-in for foreign subsidiaries following the Credit Suisse integration. Strategic impact: Regulatory clarity supports systemic stability and integration credibility, though higher capital could temper near-term RWA deployment and returns.