IoT in Chemical Market Size,Share to Reach $251.95 Bn by 2034 | 13.19% CAGR
Global IoT in Chemical Market Size, Share, Analysis ,Forecast Report Type By Technology (Operational Technology, Enabling Technology),By Component (Software, Hardware, Services), By Verticals (Pharmaceuticals, Chemicals, Mining and Metals, Food and Beverages, Paper and Pulp), Enterprise Size (Small and Medium Enterprises, Large Enterprises) Industry Region & Key Players-Industry Segment Overview, Market Dynamics, Competitive Strategies, Trends & Forecast 2025-2034
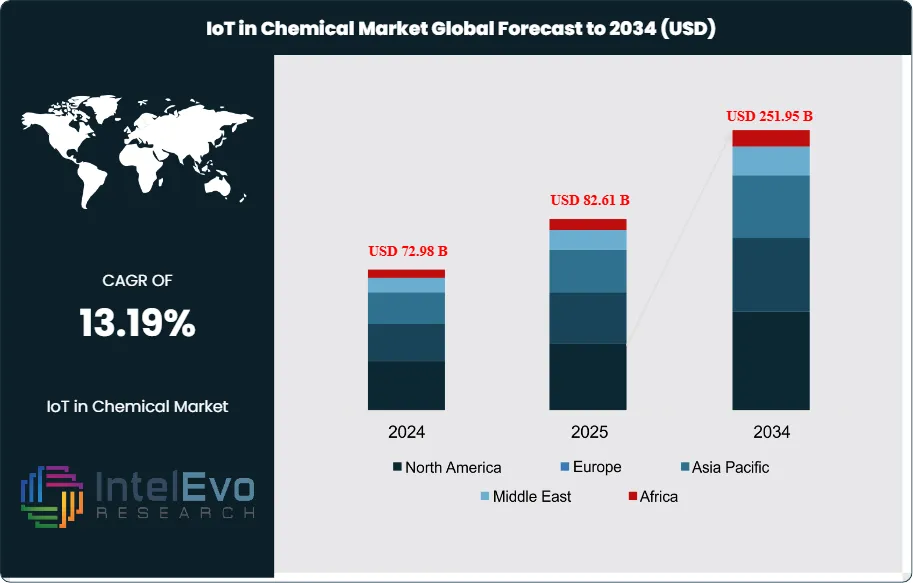
The IoT in Chemical Market size is expected to be worth around USD 251.95 Billion by 2034, from USD 72.98 Billion in 2024, growing at a CAGR of 13.19% during the forecast period from 2024 to 2034. The Internet of Things (IoT) in chemical market encompasses comprehensive digital solutions that leverage connected devices, sensors, and analytics platforms to optimize chemical manufacturing processes, enhance operational efficiency, and improve safety protocols.
This market includes hardware components such as sensors, actuators, and gateways, software platforms for data analytics and process control, and integrated services for implementation and maintenance. The IoT ecosystem serves diverse chemical industry verticals including petrochemicals, pharmaceuticals, specialty chemicals, fertilizers, and agrochemicals, enabling real-time monitoring, predictive maintenance, and automated process control across manufacturing facilities worldwide.
The IoT in chemical market is experiencing robust growth driven by increasing demand for process optimization and operational efficiency enhancement across chemical manufacturing operations. Key growth catalysts include the integration of advanced technologies such as artificial intelligence, machine learning, and digital twins that enable predictive analytics and intelligent decision-making capabilities. The market benefits from rising emphasis on predictive maintenance strategies that minimize equipment downtime and reduce operational costs through real-time asset monitoring and condition-based maintenance scheduling. Additionally, stringent regulatory compliance requirements and growing focus on workplace safety are pushing chemical companies to adopt IoT-enabled monitoring systems for hazardous material handling and environmental compliance reporting.
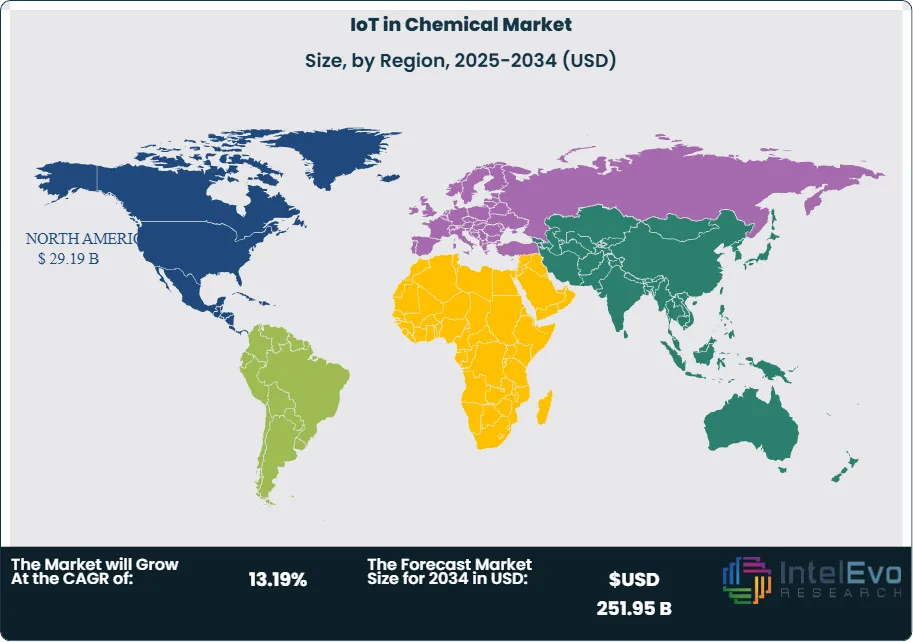
North America maintains its position as the leading regional market for IoT applications in the chemical industry, commanding the largest global market share and generating the highest revenues within the sector. This market dominance is attributed to the region's early embrace of Industry 4.0 technologies, well-established chemical manufacturing base, and significant capital investments in digital transformation programs undertaken by major chemical corporations. The United States serves as the primary contributor to North America's market leadership, with substantial revenue generation and strong growth projections driven by robust adoption rates. Meanwhile, the Asia-Pacific region emerges as the most rapidly expanding market segment, propelled by accelerating industrialization processes, expanding chemical production capabilities, and governmental policies that actively encourage the implementation of smart manufacturing technologies across emerging economies throughout the region.
The COVID-19 pandemic accelerated digital transformation initiatives across the chemical industry as companies sought remote monitoring capabilities and automated processes to maintain operations during lockdowns and social distancing measures. The crisis highlighted the importance of IoT-enabled systems for ensuring business continuity, enabling remote facility monitoring, and reducing dependency on on-site personnel. While initial supply chain disruptions temporarily affected IoT hardware availability, the long-term impact has been positive, with increased recognition of digital technologies' value in building operational resilience and enabling distributed workforce management.
Rising geopolitical tensions and trade restrictions have influenced IoT adoption patterns in the chemical industry, with companies seeking to reduce dependency on single-source suppliers and diversify their technology procurement strategies. International sanctions and export controls on advanced technologies have created opportunities for domestic IoT solution providers while challenging global supply chains. Additionally, increasing focus on supply chain transparency and security has driven demand for blockchain-enabled IoT solutions that provide end-to-end traceability and ensure compliance with international trade regulations.
Key Takeaways
Market Growth: The IoT in Chemical Market is expected to reach USD 251.95 Billion by 2034, fueled by growing demand for process optimization and operational efficiency improvements across chemical manufacturing facilities, driven by advanced technology integration including artificial intelligence, machine learning, and digital twins that enable predictive analytics and intelligent decision-making.
Technology Dominance: Enabling Technology leads the segment, due to foundational role in IoT infrastructure and rapid technological advancement.
Component Dominance: Hardware components dominate the segment, driven by essential role in data collection and process control.
Enterprise Size Dominance: Large Enterprises lead the enterprise segment, primarily due to higher investment capacity and complex operational requirements.
Verticals Dominance: Chemicals holds the largest share, owing to broad application scope and automation requirements.
Driver: Key drivers accelerating growth include process optimization demand and predictive maintenance adoption, which boost market expansion through enhanced operational efficiency and cost reduction capabilities.
Restraint: Growth is hindered by high initial investment costs and cybersecurity concerns, which create challenges such as capital barriers and data security risks.
Opportunity: The market is poised for expansion due to opportunities like AI integration and emerging market penetration, which enable advanced analytics capabilities and geographic diversification.
Trend: Emerging trends including digital twins implementation and 5G connectivity adoption are reshaping the market by enabling real-time simulation and low-latency communications.
RegionalAnalysis: North America leads owing to early technology adoption and established manufacturing infrastructure. Asia-Pacific shows high promise due to rapid industrialization and increasing chemical production capacity.
Technology Analysis:
The Enabling Technology category stands out as the leading force, serving as the essential infrastructure backbone that supports IoT deployments in chemical manufacturing. This segment encompasses technologies like industrial robotics, machine vision, artificial intelligence, digital twins, and big data analytics, all of which are crucial for enabling sophisticated process control and operational optimization. The prominent role of Enabling Technology is driven by ongoing advancements, fundamental infrastructure needs, and its critical function in supporting holistic IoT ecosystems across chemical facilities.
Component Analysis:
Hardware components hold a leading position in the market, highlighting their vital role in data acquisition, process monitoring, and control system functions within challenging chemical manufacturing environments. This category includes sensors, actuators, gateways, RFID tags, and embedded systems designed to endure extreme temperatures, corrosive substances, and hazardous conditions while ensuring dependable performance. The prominence of hardware is driven by the growing need for durable, industrial-grade devices capable of continuous operation and the fundamental importance of physical infrastructure in supporting IoT deployments.
Enterprise Size Analysis:
Large enterprises dominate the market, reflecting that extensive chemical manufacturing operations with complex demands primarily drive the need for comprehensive IoT solutions. These organizations have the financial capacity, technical knowledge, and operational scale required to deploy advanced IoT platforms, while also contending with the most rigorous regulatory compliance and safety standards that necessitate sophisticated monitoring and control systems.
Verticals Analysis:
Chemicals Leads With more than 35% Market Share In IoT in Chemical Market. The chemicals vertical holds a leading position in the market, driven by its wide range of application demands and intricate process monitoring requirements across petrochemical, specialty chemical, and industrial chemical manufacturing sectors. Its prominence is supported by extensive IoT use cases such as reactor monitoring, batch process control, quality assurance, and safety compliance systems. This segment benefits from significant automation investments, stringent regulatory compliance, and the vital importance of process optimization in sustaining competitiveness and ensuring operational safety.
Region Analysis:
North America Leads With nearly 40% Market Share In IoT in Chemical Market. North America stands as the clear leader in the global IoT market within the chemical industry, supported by its highly advanced manufacturing infrastructure, proactive adoption of Industry 4.0 technologies, and significant investments by major corporations in digital transformation. The region boasts a mature network of IoT solution providers, robust research and development capabilities, and long-standing technology partnerships, all of which collectively drive widespread innovation and deployment of IoT solutions across chemical manufacturing. The United States, in particular, plays a pivotal role in shaping industry trends due to its focus on integrating real-time process monitoring, data analytics, and operational optimization.
In contrast, the Asia-Pacific region is experiencing the fastest market growth, fueled by rapid industrialization, increasing chemical production capacity, and strong government policies championing smart manufacturing. Countries such as China and India are at the forefront of this expansion, with many chemical companies accelerating the modernization of their facilities and investing in advanced process control systems to improve efficiency, safety, and regulatory compliance. These developments are further propelled by broader digital infrastructure enhancements and collaborative industry initiatives across the region.
Europe continues to maintain a substantial presence through well-established chemical production hubs and a regulatory environment that prioritizes environmental sustainability. The region's adoption of IoT is significantly influenced by stringent environmental compliance requirements and the active involvement of leading technology providers who specialize in developing innovative industrial IoT solutions. Additionally, European manufacturers benefit from close industry-academia collaborations and government-supported R&D projects, ensuring that the sector remains competitive and technology-driven.
Technology (Operational Technology, Enabling Technology), Component (Software, Hardware, Services), Verticals (Pharmaceuticals, Chemicals, Mining and Metals, Food and Beverages, Paper and Pulp), Enterprise Size (Small and Medium Enterprises, Large Enterprises)
Research Methodology
Primary Research- 100 Interviews of Stakeholders
Secondary Research
Desk Research
Regional scope
North America (United States, Canada, Mexico)
Latin America (Brazil, Argentina, Columbia)
East Asia And Pacific (China, Japan, South Korea, Australia, Cambodia, Fiji, Indonesia)
Sea And South Asia (India, Singapore, Thailand, Taiwan, Malaysia)
Eastern Europe (Poland, Russia, Czech Republic, Romania)
Western Europe (Germany, U.K., France, Spain, Itlay)
Middle East & Africa (GCC Countries, Egypt, Nigeria, South Africa, Israel)
Competitive Landscape
Siemens AG, General Electric Company (GE), ABB Ltd, Honeywell International Inc, Schneider Electric SE, Cognite AS, PTC Inc., Seeq Corporation , Altizon Inc, Yokogawa Electric Corporation, Emerson Electric Co., Mitsubishi Electric Corporation
Customization Scope
Customization for segments, region/country-level will be provided. Moreover, additional customization can be done based on the requirements.
Pricing and Purchase Options
Avail customized purchase options to meet your exact research needs. We have three licenses to opt for: Single User License, Multi-User License (Up to 5 Users), Corporate Use License (Unlimited User and Printable PDF).
TABLE OF CONTENTS
1. EXECUTIVE SUMMARY
1.1. MARKET SNAPSHOT
1.2. KEY FINDINGS & INSIGHTS
1.3. ANALYST RECOMMENDATIONS
1.4. FUTURE OUTLOOK
2. RESEARCH METHODOLOGY
2.1. MARKET DEFINITION & SCOPE
2.2. RESEARCH OBJECTIVES: PRIMARY & SECONDARY DATA SOURCES
2.3. DATA COLLECTION SOURCES
2.3.1. COVERAGE OF 100+ PRIMARY RESEARCH/CONSULTATION CALLS WITH INDUSTRY STAKEHOLDERS
FIGURE 17 NORTH AMERICA IOT IN CHEMICAL CURRENT AND FUTURE TYPE ANALYSIS, 2025–2034, (USD MILLION)
FIGURE 18 NORTH AMERICA IOT IN CHEMICAL CURRENT AND FUTURE END USER ANALYSIS, 2025–2034, (USD MILLION)
FIGURE 19 MARKET SHARE BY COUNTRY
FIGURE 20 LATIN AMERICA IOT IN CHEMICAL CURRENT AND FUTURE TYPE ANALYSIS, 2025–2034, (USD MILLION)
FIGURE 21 LATIN AMERICA IOT IN CHEMICAL CURRENT AND FUTURE END USER ANALYSIS, 2025–2034, (USD MILLION)
FIGURE 22 MARKET SHARE BY COUNTRY
FIGURE 23 EASTERN EUROPE IOT IN CHEMICAL CURRENT AND FUTURE TYPE ANALYSIS, 2025–2034, (USD MILLION)
FIGURE 24 EASTERN EUROPE IOT IN CHEMICAL CURRENT AND FUTURE END USER ANALYSIS, 2025–2034, (USD MILLION)
FIGURE 25 MARKET SHARE BY COUNTRY
FIGURE 26 WESTERN EUROPE IOT IN CHEMICAL CURRENT AND FUTURE TYPE ANALYSIS, 2025–2034, (USD MILLION)
FIGURE 27 WESTERN EUROPE IOT IN CHEMICAL CURRENT AND FUTURE END USER ANALYSIS, 2025–2034, (USD MILLION)
FIGURE 28 MARKET SHARE BY COUNTRY
FIGURE 29 EAST ASIA AND PACIFIC IOT IN CHEMICAL CURRENT AND FUTURE TYPE ANALYSIS, 2025–2034, (USD MILLION)
FIGURE 30 EAST ASIA AND PACIFIC IOT IN CHEMICAL CURRENT AND FUTURE END USER ANALYSIS, 2025–2034, (USD MILLION)
FIGURE 31 MARKET SHARE BY COUNTRY
FIGURE 32 SEA AND SOUTH ASIA IOT IN CHEMICAL CURRENT AND FUTURE TYPE ANALYSIS, 2025–2034, (USD MILLION)
FIGURE 33 SEA AND SOUTH ASIA IOT IN CHEMICAL CURRENT AND FUTURE END USER ANALYSIS, 2025–2034, (USD MILLION)
FIGURE 34 MARKET SHARE BY COUNTRY
FIGURE 35 MIDDLE EAST AND AFRICA IOT IN CHEMICAL CURRENT AND FUTURE TYPE ANALYSIS, 2025–2034, (USD MILLION)
FIGURE 36 MIDDLE EAST AND AFRICA IOT IN CHEMICAL CURRENT AND FUTURE END USER ANALYSIS, 2025–2034, (USD MILLION)
FIGURE 37 NORTH AMERICA IOT IN CHEMICAL CURRENT AND FUTURE MARKET VOLUME SHARE REGIONAL ANALYSIS, 2025–2034, (USD MILLION)
FIGURE 38 U.S. IOT IN CHEMICAL CURRENT AND FUTURE TYPE ANALYSIS, 2025–2034, (USD MILLION)
FIGURE 39 U.S. IOT IN CHEMICAL CURRENT AND FUTURE END USER ANALYSIS, 2025–2034, (USD MILLION)
FIGURE 40 CANADA IOT IN CHEMICAL CURRENT AND FUTURE TYPE ANALYSIS, 2025–2034, (USD MILLION)
FIGURE 41 CANADA IOT IN CHEMICAL CURRENT AND FUTURE END USER ANALYSIS, 2025–2034, (USD MILLION)
FIGURE 42 LATIN AMERICA IOT IN CHEMICAL CURRENT AND FUTURE MARKET VOLUME SHARE REGIONAL ANALYSIS, 2025–2034, (USD MILLION)
FIGURE 43 MEXICO IOT IN CHEMICAL CURRENT AND FUTURE TYPE ANALYSIS, 2025–2034, (USD MILLION)
FIGURE 44 MEXICO IOT IN CHEMICAL CURRENT AND FUTURE END USER ANALYSIS, 2025–2034, (USD MILLION)
FIGURE 45 BRAZIL IOT IN CHEMICAL CURRENT AND FUTURE TYPE ANALYSIS, 2025–2034, (USD MILLION)
FIGURE 46 BRAZIL IOT IN CHEMICAL CURRENT AND FUTURE END USER ANALYSIS, 2025–2034, (USD MILLION)
FIGURE 47 ARGENTINA IOT IN CHEMICAL CURRENT AND FUTURE TYPE ANALYSIS, 2025–2034, (USD MILLION)
FIGURE 48 ARGENTINA IOT IN CHEMICAL CURRENT AND FUTURE END USER ANALYSIS, 2025–2034, (USD MILLION)
FIGURE 49 COLUMBIA IOT IN CHEMICAL CURRENT AND FUTURE TYPE ANALYSIS, 2025–2034, (USD MILLION)
FIGURE 50 COLUMBIA IOT IN CHEMICAL CURRENT AND FUTURE END USER ANALYSIS, 2025–2034, (USD MILLION)
FIGURE 51 REST OF LATIN AMERICA IOT IN CHEMICAL CURRENT AND FUTURE TYPE ANALYSIS, 2025–2034, (USD MILLION)
FIGURE 52 REST OF LATIN AMERICA IOT IN CHEMICAL CURRENT AND FUTURE END USER ANALYSIS, 2025–2034, (USD MILLION)
FIGURE 53 EASTERN EUROPE IOT IN CHEMICAL CURRENT AND FUTURE MARKET VOLUME SHARE REGIONAL ANALYSIS, 2025–2034, (USD MILLION)
FIGURE 54 POLAND IOT IN CHEMICAL CURRENT AND FUTURE TYPE ANALYSIS, 2025–2034, (USD MILLION)
FIGURE 55 POLAND IOT IN CHEMICAL CURRENT AND FUTURE END USER ANALYSIS, 2025–2034, (USD MILLION)
FIGURE 56 RUSSIA IOT IN CHEMICAL CURRENT AND FUTURE TYPE ANALYSIS, 2025–2034, (USD MILLION)
FIGURE 57 RUSSIA IOT IN CHEMICAL CURRENT AND FUTURE END USER ANALYSIS, 2025–2034, (USD MILLION)
FIGURE 58 CZECH REPUBLIC IOT IN CHEMICAL CURRENT AND FUTURE TYPE ANALYSIS, 2025–2034, (USD MILLION)
FIGURE 59 CZECH REPUBLIC IOT IN CHEMICAL CURRENT AND FUTURE END USER ANALYSIS, 2025–2034, (USD MILLION)
FIGURE 60 ROMANIA IOT IN CHEMICAL CURRENT AND FUTURE TYPE ANALYSIS, 2025–2034, (USD MILLION)
FIGURE 61 ROMANIA IOT IN CHEMICAL CURRENT AND FUTURE END USER ANALYSIS, 2025–2034, (USD MILLION)
FIGURE 62 REST OF EASTERN EUROPE IOT IN CHEMICAL CURRENT AND FUTURE TYPE ANALYSIS, 2025–2034, (USD MILLION)
FIGURE 63 REST OF EASTERN EUROPE IOT IN CHEMICAL CURRENT AND FUTURE END USER ANALYSIS, 2025–2034, (USD MILLION)
FIGURE 64 WESTERN EUROPE IOT IN CHEMICAL CURRENT AND FUTURE MARKET VOLUME SHARE REGIONAL ANALYSIS, 2025–2034, (USD MILLION)
FIGURE 65 GERMANY IOT IN CHEMICAL CURRENT AND FUTURE TYPE ANALYSIS, 2025–2034, (USD MILLION)
FIGURE 66 GERMANY IOT IN CHEMICAL CURRENT AND FUTURE END USER ANALYSIS, 2025–2034, (USD MILLION)
FIGURE 67 FRANCE IOT IN CHEMICAL CURRENT AND FUTURE TYPE ANALYSIS, 2025–2034, (USD MILLION)
FIGURE 68 FRANCE IOT IN CHEMICAL CURRENT AND FUTURE END USER ANALYSIS, 2025–2034, (USD MILLION)
FIGURE 69 UK IOT IN CHEMICAL CURRENT AND FUTURE TYPE ANALYSIS, 2025–2034, (USD MILLION)
FIGURE 70 UK IOT IN CHEMICAL CURRENT AND FUTURE END USER ANALYSIS, 2025–2034, (USD MILLION)
FIGURE 71 SPAIN IOT IN CHEMICAL CURRENT AND FUTURE TYPE ANALYSIS, 2025–2034, (USD MILLION)
FIGURE 72 SPAIN IOT IN CHEMICAL CURRENT AND FUTURE END USER ANALYSIS, 2025–2034, (USD MILLION)
FIGURE 73 ITALY IOT IN CHEMICAL CURRENT AND FUTURE TYPE ANALYSIS, 2025–2034, (USD MILLION)
FIGURE 74 ITALY IOT IN CHEMICAL CURRENT AND FUTURE END USER ANALYSIS, 2025–2034, (USD MILLION)
FIGURE 75 REST OF WESTERN EUROPE IOT IN CHEMICAL CURRENT AND FUTURE TYPE ANALYSIS, 2025–2034, (USD MILLION)
FIGURE 76 REST OF WESTERN EUROPE IOT IN CHEMICAL CURRENT AND FUTURE END USER ANALYSIS, 2025–2034, (USD MILLION)
FIGURE 77 EAST ASIA AND PACIFIC IOT IN CHEMICAL CURRENT AND FUTURE MARKET VOLUME SHARE REGIONAL ANALYSIS, 2025–2034, (USD MILLION)
FIGURE 78 CHINA IOT IN CHEMICAL CURRENT AND FUTURE TYPE ANALYSIS, 2025–2034, (USD MILLION)
FIGURE 79 CHINA IOT IN CHEMICAL CURRENT AND FUTURE END USER ANALYSIS, 2025–2034, (USD MILLION)
FIGURE 80 JAPAN IOT IN CHEMICAL CURRENT AND FUTURE TYPE ANALYSIS, 2025–2034, (USD MILLION)
FIGURE 81 JAPAN IOT IN CHEMICAL CURRENT AND FUTURE END USER ANALYSIS, 2025–2034, (USD MILLION)
FIGURE 82 AUSTRALIA IOT IN CHEMICAL CURRENT AND FUTURE TYPE ANALYSIS, 2025–2034, (USD MILLION)
FIGURE 83 AUSTRALIA IOT IN CHEMICAL CURRENT AND FUTURE END USER ANALYSIS, 2025–2034, (USD MILLION)
FIGURE 84 CAMBODIA IOT IN CHEMICAL CURRENT AND FUTURE TYPE ANALYSIS, 2025–2034, (USD MILLION)
FIGURE 85 CAMBODIA IOT IN CHEMICAL CURRENT AND FUTURE END USER ANALYSIS, 2025–2034, (USD MILLION)
FIGURE 86 FIJI IOT IN CHEMICAL CURRENT AND FUTURE TYPE ANALYSIS, 2025–2034, (USD MILLION)
FIGURE 87 FIJI IOT IN CHEMICAL CURRENT AND FUTURE END USER ANALYSIS, 2025–2034, (USD MILLION)
FIGURE 88 INDONESIA IOT IN CHEMICAL CURRENT AND FUTURE TYPE ANALYSIS, 2025–2034, (USD MILLION)
FIGURE 89 INDONESIA IOT IN CHEMICAL CURRENT AND FUTURE END USER ANALYSIS, 2025–2034, (USD MILLION)
FIGURE 90 SOUTH KOREA IOT IN CHEMICAL CURRENT AND FUTURE TYPE ANALYSIS, 2025–2034, (USD MILLION)
FIGURE 91 SOUTH KOREA IOT IN CHEMICAL CURRENT AND FUTURE END USER ANALYSIS, 2025–2034, (USD MILLION)
FIGURE 92 REST OF EAST ASIA AND PACIFIC IOT IN CHEMICAL CURRENT AND FUTURE TYPE ANALYSIS, 2025–2034, (USD MILLION)
FIGURE 93 REST OF EAST ASIA AND PACIFIC IOT IN CHEMICAL CURRENT AND FUTURE END USER ANALYSIS, 2025–2034, (USD MILLION)
FIGURE 94 SEA AND SOUTH ASIA IOT IN CHEMICAL CURRENT AND FUTURE MARKET VOLUME SHARE REGIONAL ANALYSIS, 2025–2034, (USD MILLION)
FIGURE 95 BANGLADESH IOT IN CHEMICAL CURRENT AND FUTURE TYPE ANALYSIS, 2025–2034, (USD MILLION)
FIGURE 96 BANGLADESH IOT IN CHEMICAL CURRENT AND FUTURE END USER ANALYSIS, 2025–2034, (USD MILLION)
FIGURE 97 NEW ZEALAND IOT IN CHEMICAL CURRENT AND FUTURE TYPE ANALYSIS, 2025–2034, (USD MILLION)
FIGURE 98 NEW ZEALAND IOT IN CHEMICAL CURRENT AND FUTURE END USER ANALYSIS, 2025–2034, (USD MILLION)
FIGURE 99 INDIA IOT IN CHEMICAL CURRENT AND FUTURE TYPE ANALYSIS, 2025–2034, (USD MILLION)
FIGURE 100 INDIA IOT IN CHEMICAL CURRENT AND FUTURE END USER ANALYSIS, 2025–2034, (USD MILLION)
FIGURE 101 SINGAPORE IOT IN CHEMICAL CURRENT AND FUTURE TYPE ANALYSIS, 2025–2034, (USD MILLION)
FIGURE 102 SINGAPORE IOT IN CHEMICAL CURRENT AND FUTURE END USER ANALYSIS, 2025–2034, (USD MILLION)
FIGURE 103 THAILAND IOT IN CHEMICAL CURRENT AND FUTURE TYPE ANALYSIS, 2025–2034, (USD MILLION)
FIGURE 104 THAILAND IOT IN CHEMICAL CURRENT AND FUTURE END USER ANALYSIS, 2025–2034, (USD MILLION)
FIGURE 105 TAIWAN IOT IN CHEMICAL CURRENT AND FUTURE TYPE ANALYSIS, 2025–2034, (USD MILLION)
FIGURE 106 TAIWAN IOT IN CHEMICAL CURRENT AND FUTURE END USER ANALYSIS, 2025–2034, (USD MILLION)
FIGURE 107 MALAYSIA IOT IN CHEMICAL CURRENT AND FUTURE TYPE ANALYSIS, 2025–2034, (USD MILLION)
FIGURE 108 MALAYSIA IOT IN CHEMICAL CURRENT AND FUTURE END USER ANALYSIS, 2025–2034, (USD MILLION)
FIGURE 109 REST OF SEA AND SOUTH ASIA IOT IN CHEMICAL CURRENT AND FUTURE TYPE ANALYSIS, 2025–2034, (USD MILLION)
FIGURE 110 REST OF SEA AND SOUTH ASIA IOT IN CHEMICAL CURRENT AND FUTURE END USER ANALYSIS, 2025–2034, (USD MILLION)
FIGURE 111 MIDDLE EAST AND AFRICA IOT IN CHEMICAL CURRENT AND FUTURE MARKET VOLUME SHARE REGIONAL ANALYSIS, 2025–2034, (USD MILLION)
FIGURE 112 GCC COUNTRIES IOT IN CHEMICAL CURRENT AND FUTURE TYPE ANALYSIS, 2025–2034, (USD MILLION)
FIGURE 113 GCC COUNTRIES IOT IN CHEMICAL CURRENT AND FUTURE END USER ANALYSIS, 2025–2034, (USD MILLION)
FIGURE 114 SAUDI ARABIA IOT IN CHEMICAL CURRENT AND FUTURE TYPE ANALYSIS, 2025–2034, (USD MILLION)
FIGURE 115 SAUDI ARABIA IOT IN CHEMICAL CURRENT AND FUTURE END USER ANALYSIS, 2025–2034, (USD MILLION)
FIGURE 116 UAE IOT IN CHEMICAL CURRENT AND FUTURE TYPE ANALYSIS, 2025–2034, (USD MILLION)
FIGURE 117 UAE IOT IN CHEMICAL CURRENT AND FUTURE END USER ANALYSIS, 2025–2034, (USD MILLION)
FIGURE 118 BAHRAIN IOT IN CHEMICAL CURRENT AND FUTURE TYPE ANALYSIS, 2025–2034, (USD MILLION)
FIGURE 119 BAHRAIN IOT IN CHEMICAL CURRENT AND FUTURE END USER ANALYSIS, 2025–2034, (USD MILLION)
FIGURE 120 KUWAIT IOT IN CHEMICAL CURRENT AND FUTURE TYPE ANALYSIS, 2025–2034, (USD MILLION)
FIGURE 121 KUWAIT IOT IN CHEMICAL CURRENT AND FUTURE END USER ANALYSIS, 2025–2034, (USD MILLION)
FIGURE 122 OMAN IOT IN CHEMICAL CURRENT AND FUTURE TYPE ANALYSIS, 2025–2034, (USD MILLION)
FIGURE 123 OMAN IOT IN CHEMICAL CURRENT AND FUTURE END USER ANALYSIS, 2025–2034, (USD MILLION)
FIGURE 124 QATAR IOT IN CHEMICAL CURRENT AND FUTURE TYPE ANALYSIS, 2025–2034, (USD MILLION)
FIGURE 125 QATAR IOT IN CHEMICAL CURRENT AND FUTURE END USER ANALYSIS, 2025–2034, (USD MILLION)
FIGURE 126 EGYPT IOT IN CHEMICAL CURRENT AND FUTURE TYPE ANALYSIS, 2025–2034, (USD MILLION)
FIGURE 127 EGYPT IOT IN CHEMICAL CURRENT AND FUTURE END USER ANALYSIS, 2025–2034, (USD MILLION)
FIGURE 128 NIGERIA IOT IN CHEMICAL CURRENT AND FUTURE TYPE ANALYSIS, 2025–2034, (USD MILLION)
FIGURE 129 NIGERIA IOT IN CHEMICAL CURRENT AND FUTURE END USER ANALYSIS, 2025–2034, (USD MILLION)
FIGURE 130 SOUTH AFRICA IOT IN CHEMICAL CURRENT AND FUTURE TYPE ANALYSIS, 2025–2034, (USD MILLION)
FIGURE 131 SOUTH AFRICA IOT IN CHEMICAL CURRENT AND FUTURE END USER ANALYSIS, 2025–2034, (USD MILLION)
FIGURE 132 ISRAEL IOT IN CHEMICAL CURRENT AND FUTURE TYPE ANALYSIS, 2025–2034, (USD MILLION)
FIGURE 133 ISRAEL IOT IN CHEMICAL CURRENT AND FUTURE END USER ANALYSIS, 2025–2034, (USD MILLION)
FIGURE 134 REST OF MEA IOT IN CHEMICAL CURRENT AND FUTURE TYPE ANALYSIS, 2025–2034, (USD MILLION)
FIGURE 135 REST OF MEA IOT IN CHEMICAL CURRENT AND FUTURE END USER ANALYSIS, 2025–2034, (USD MILLION)
FIGURE 136 U. S. MARKET SHARE ANALYSIS BY TYPE (2024)
FIGURE 137 U. S. MARKET SHARE ANALYSIS BY END USER (2024)
FIGURE 138 CANADA MARKET SHARE ANALYSIS BY TYPE (2024)
FIGURE 139 CANADA MARKET SHARE ANALYSIS BY END USER (2024)
FIGURE 140 MEXICO MARKET SHARE ANALYSIS BY TYPE (2024)
FIGURE 141 MEXICO MARKET SHARE ANALYSIS BY END USER (2024)
FIGURE 142 CHINA MARKET SHARE ANALYSIS BY TYPE (2024)
FIGURE 143 CHINA MARKET SHARE ANALYSIS BY END USER (2024)
FIGURE 144 JAPAN MARKET SHARE ANALYSIS BY TYPE (2024)
FIGURE 145 JAPAN MARKET SHARE ANALYSIS BY END USER (2024)
FIGURE 146 INDIA MARKET SHARE ANALYSIS BY TYPE (2024)
FIGURE 147 INDIA MARKET SHARE ANALYSIS BY END USER (2024)
FIGURE 148 SOUTH KOREA MARKET SHARE ANALYSIS BY TYPE (2024)
FIGURE 149 SOUTH KOREA MARKET SHARE ANALYSIS BY END USER (2024)
FIGURE 150 SAUDI ARABIA MARKET SHARE ANALYSIS BY TYPE (2024)
FIGURE 151 SAUDI ARABIA MARKET SHARE ANALYSIS BY END USER (2024)
FIGURE 152 UAE MARKET SHARE ANALYSIS BY TYPE (2024)
FIGURE 153 UAE MARKET SHARE ANALYSIS BY END USER (2024)
FIGURE 154 EGYPT MARKET SHARE ANALYSIS BY TYPE (2024)
FIGURE 155 EGYPT MARKET SHARE ANALYSIS BY END USER (2024)
FIGURE 156 NIGERIA MARKET SHARE ANALYSIS BY TYPE (2024)
FIGURE 157 NIGERIA MARKET SHARE ANALYSIS BY END USER (2024)
FIGURE 158 SOUTH AFRICA MARKET SHARE ANALYSIS BY TYPE (2024)
FIGURE 159 SOUTH AFRICA MARKET SHARE ANALYSIS BY END USER (2024)
FIGURE 160 GERMANY MARKET SHARE ANALYSIS BY TYPE (2024)
FIGURE 161 GERMANY MARKET SHARE ANALYSIS BY END USER (2024)
FIGURE 162 FRANCE MARKET SHARE ANALYSIS BY TYPE (2024)
FIGURE 163 FRANCE MARKET SHARE ANALYSIS BY END USER (2024)
FIGURE 164 UK MARKET SHARE ANALYSIS BY TYPE (2024)
FIGURE 165 UK MARKET SHARE ANALYSIS BY END USER (2024)
FIGURE 166 SPAIN MARKET SHARE ANALYSIS BY TYPE (2024)
FIGURE 167 SPAIN MARKET SHARE ANALYSIS BY END USER (2024)
FIGURE 168 ITALY MARKET SHARE ANALYSIS BY TYPE (2024)
FIGURE 169 ITALY MARKET SHARE ANALYSIS BY END USER (2024)
FIGURE 170 BRAZIL MARKET SHARE ANALYSIS BY TYPE (2024)
FIGURE 171 BRAZIL MARKET SHARE ANALYSIS BY END USER (2024)
FIGURE 172 ARGENTINA MARKET SHARE ANALYSIS BY TYPE (2024)
FIGURE 173 ARGENTINA MARKET SHARE ANALYSIS BY END USER (2024)
FIGURE 174 COLUMBIA MARKET SHARE ANALYSIS BY TYPE (2024)
FIGURE 175 COLUMBIA MARKET SHARE ANALYSIS BY END USER (2024)
FIGURE 176 GLOBAL IOT IN CHEMICAL CURRENT AND FUTURE MARKET KEY COUNTRY LEVEL ANALYSIS, 2024–2034, (USD MILLION)
FIGURE 177 FINANCIAL OVERVIEW:
Key Players Analysis:
Siemens AG: Siemens maintains a dominant market position through comprehensive industrial automation solutions and advanced IoT platforms that integrate seamlessly with chemical manufacturing processes. The company's competitive advantage lies in its extensive portfolio spanning process control systems, industrial software, and digital twin technologies that provide end-to-end solutions for chemical companies. Siemens' strength comes from decades of experience in process industries, established relationships with major chemical manufacturers, and continuous innovation in industrial digitalization technologies that address evolving customer needs.
General Electric Company (GE): GE dominates the industrial IoT platform segment through its Predix platform and comprehensive suite of predictive analytics solutions designed specifically for chemical and process industries. The company's competitive differentiation stems from its focus on asset performance management, advanced analytics capabilities, and deep understanding of industrial equipment and processes. GE's market strength is reinforced by its global service network, proven track record in industrial applications, and ability to provide complete lifecycle support from implementation through ongoing optimization.
ABB Ltd: ABB specializes in advanced process automation and control systems that leverage IoT technologies to optimize chemical manufacturing operations and improve safety performance. The company's competitive advantage comes from its integrated approach combining hardware, software, and services in comprehensive solutions tailored to chemical industry requirements. ABB maintains market leadership through its focus on safety-critical applications, robust industrial-grade products, and extensive experience in hazardous environment operations that are essential in chemical manufacturing.
Honeywell International Inc.: Honeywell provides integrated IoT solutions focused on process optimization, safety management, and regulatory compliance for chemical manufacturing operations. The company's competitive strength lies in its comprehensive understanding of chemical processes, proven safety systems, and ability to integrate diverse technologies into cohesive solutions. Honeywell's market position is supported by its strong reputation for reliability, extensive customer relationships, and continuous innovation in process control and safety technologies.
Market Key Players
Siemens AG
General Electric Company (GE)
ABB Ltd
Honeywell International Inc
Schneider Electric SE
Cognite AS
PTC Inc.
Seeq Corporation
Altizon Inc
Yokogawa Electric Corporation
Emerson Electric Co.
Mitsubishi Electric Corporation
Driver:
Process Optimization and Operational Efficiency Enhancement:
The increasing demand for enhanced process efficiency, operational optimization, and cost reduction represents the primary driver of IoT adoption within the chemical industry. IoT technologies enable real-time monitoring of manufacturing processes, equipment performance tracking, and predictive analytics that identify optimization opportunities and prevent operational inefficiencies. Chemical companies are leveraging IoT solutions to monitor critical parameters such as temperature, pressure, flow rates, and chemical compositions in real-time, allowing for immediate process adjustments and quality control measures. This driver is reinforced by competitive pressures to reduce production costs, improve product quality, and maintain operational excellence while meeting stringent safety and environmental standards.
Predictive Maintenance and Asset Management Revolution:
The growing emphasis on predictive maintenance and comprehensive asset management strategies is fundamentally transforming how chemical companies approach equipment reliability and operational continuity. IoT-enabled predictive maintenance systems utilize advanced sensors, machine learning algorithms, and historical data analysis to predict equipment failures before they occur, enabling proactive maintenance scheduling and minimizing unplanned downtime. This approach significantly reduces maintenance costs, extends equipment lifespan, and improves overall operational reliability compared to traditional reactive or scheduled maintenance approaches. The driver is particularly strong in the chemical industry due to the high cost of equipment failures, safety implications of unexpected shutdowns, and the critical nature of continuous production processes.
Restrain:
High Initial Investment and Implementation Complexity:
The substantial upfront investment required for comprehensive IoT infrastructure implementation creates significant barriers to adoption, particularly for smaller chemical companies and operations with limited capital resources. These costs encompass sophisticated sensors, cloud platforms, data analytics software, system integration services, and ongoing maintenance expenses that can strain organizational budgets. The complexity of integrating IoT solutions with existing legacy systems, ensuring seamless communication between devices, and maintaining data integrity across diverse platforms presents additional implementation challenges. This restraint is particularly acute for companies operating older facilities that require extensive retrofitting to accommodate modern IoT technologies, creating both financial and operational barriers to adoption.
Cybersecurity Concerns and Data Privacy Risks:
The increased connectivity and data sharing inherent in IoT implementations create substantial cybersecurity vulnerabilities and data privacy concerns that limit widespread adoption across the chemical industry. The networked nature of IoT devices creates multiple potential entry points for cyber attacks, putting sensitive operational data, intellectual property, and critical infrastructure at risk. Chemical companies handle highly sensitive information about hazardous materials, proprietary processes, and safety protocols that require robust security measures and compliance with strict data protection regulations. The industry's critical infrastructure status makes it a high-value target for cybercriminals and state-sponsored attacks, necessitating substantial investment in cybersecurity solutions and creating ongoing operational concerns about system vulnerabilities.
Opportunities:
Artificial Intelligence Integration and Advanced Analytics:
The convergence of IoT with artificial intelligence, machine learning, and advanced analytics technologies creates substantial opportunities for next-generation chemical process optimization and intelligent decision-making systems. AI-powered IoT platforms can analyze vast amounts of operational data to identify patterns, predict outcomes, and recommend optimal process parameters that human operators might not detect. This integration enables autonomous process control, intelligent quality management, and sophisticated supply chain optimization that can significantly improve operational efficiency and product quality. The opportunity extends to developing industry-specific AI models that understand unique chemical processes, regulatory requirements, and safety protocols, creating competitive advantages for companies that successfully implement these advanced capabilities.
Emerging Market Penetration and Global Expansion:
Developing regions in Asia-Pacific, Latin America, and other emerging markets present significant growth opportunities driven by rapid industrialization, expanding chemical production capacity, and increasing adoption of advanced manufacturing technologies. These markets offer substantial untapped potential due to growing investment in chemical infrastructure, government initiatives promoting industrial modernization, and rising demand for chemical products driven by economic development. Market penetration opportunities include establishing IoT solution partnerships with local chemical companies, developing cost-effective solutions tailored to emerging market requirements, and providing comprehensive implementation and support services. The expansion potential is enhanced by lower competition levels, government support for industrial technology adoption, and increasing recognition of IoT benefits for operational efficiency and environmental compliance.
Trends:
Digital Twins Implementation and Virtual Process Modeling:
The chemical industry is experiencing accelerated adoption of digital twin technology that creates detailed virtual replicas of physical chemical processes, equipment, and entire manufacturing facilities. Digital twins enable real-time simulation, scenario modeling, and predictive analysis that support better decision-making, risk assessment, and process optimization without disrupting actual production operations. This trend is exemplified by companies like AGC Inc., which introduced Process Digital Twin systems for chemical plants that import real-time operational data into process simulators, enabling high-speed calculations and instant situational awareness. The technology allows chemical companies to test process modifications, predict equipment behavior, and optimize operations in virtual environments before implementing changes in physical systems.
5G Connectivity and Edge Computing Integration:
The deployment of 5G networks and edge computing infrastructure is transforming IoT capabilities in chemical manufacturing by enabling ultra-low latency communications, massive device connectivity, and real-time data processing at the network edge. 5G connectivity supports advanced applications such as augmented reality for maintenance operations, real-time video analytics for safety monitoring, and autonomous systems that require immediate response capabilities. Edge computing reduces dependence on cloud connectivity by processing critical data locally, improving system reliability and reducing latency for time-sensitive applications. This trend enables new IoT use cases including collaborative robotics, advanced machine vision systems, and real-time quality control that require high-bandwidth, low-latency communications.
Recent Development
In February 2025: In early 2025, a significant legacy equipment modernization project took place at a petrochemical facility in Texas, where a critical machine known as the "Cyclone" underwent an IoT retrofit. This upgrade replaced the traditional analog relay logic system with advanced sensor technology, automated control mechanisms, and capabilities for remote monitoring. The integration of these digital technologies transformed the Cyclone’s operational framework, resulting in enhanced safety measures by enabling real-time hazard detection and reducing manual intervention.
In April 2024: ABB has partnered to launch a new interoperability initiative aimed at enhancing the Industrial Internet of Things (IIoT) ecosystem by enabling seamless data exchange and integration across diverse industrial platforms. This collaborative effort focuses on breaking down existing barriers between different IIoT systems, fostering a more connected and interoperable environment that empowers industries to unlock actionable insights from their operational data.