Global IoT Insurance Market Size, Share, Analysis Report By Component (Services, Solution), Insurance Type (Health and Life Insurance, Property and Casualty Insurance, Others Insurance Types), Application (Agriculture, Automotive and Transportation, Buildings, Retail, Health and Life, Other Applications) Industry Region & Key Players-Industry Segment Overview, Market Dynamics, Competitive Strategies, Trends & Forecast 2025-2034
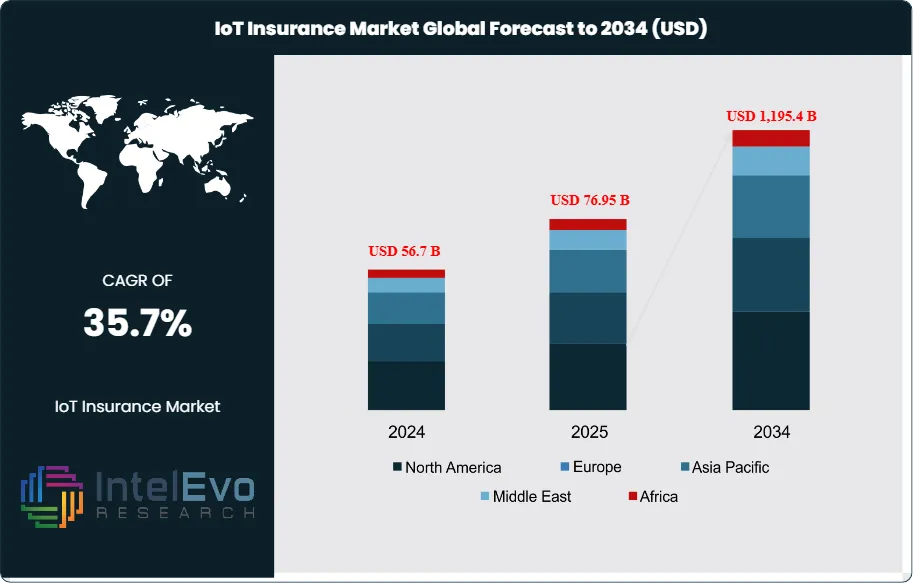
The IoT Insurance Market size is expected to be worth around USD 1,195.4 Billion by 2034, up from USD 56.7 Billion in 2024, growing at a CAGR of 35.7% during the forecast period from 2025 to 2034. The rapid integration of IoT-enabled devices across automotive, healthcare, and smart home ecosystems is revolutionizing risk management and claims processing. Insurers are leveraging real-time data analytics, AI, and connected technologies to create personalized, usage-based policies, driving exponential market growth. The fusion of IoT with predictive analytics is reshaping the future of the insurance industry—making it smarter, faster, and more customer-centric.
This market encompasses solutions and services that leverage IoT-enabled devices such as telematics systems, wearable health monitors, smart home sensors, and connected vehicle technologies to provide real-time data analytics for risk assessment, policy customization, and claims processing. The integration of IoT technologies enables insurers to shift from reactive to proactive risk management models, offering personalized policies based on actual behavior patterns and real-time risk factors rather than historical data alone.
Several key factors are driving the remarkable growth of the IoT insurance market, including the proliferation of connected devices across various sectors, advancing 5G connectivity infrastructure, and increasing consumer acceptance of usage-based insurance models. The market is further propelled by regulatory support for telematics-based insurance programs, growing awareness of preventive healthcare through wearable devices, and the insurance industry's digital transformation initiatives. Additionally, the rising frequency of cyber threats and climate-related risks has intensified the demand for real-time monitoring and predictive analytics capabilities that IoT solutions provide.
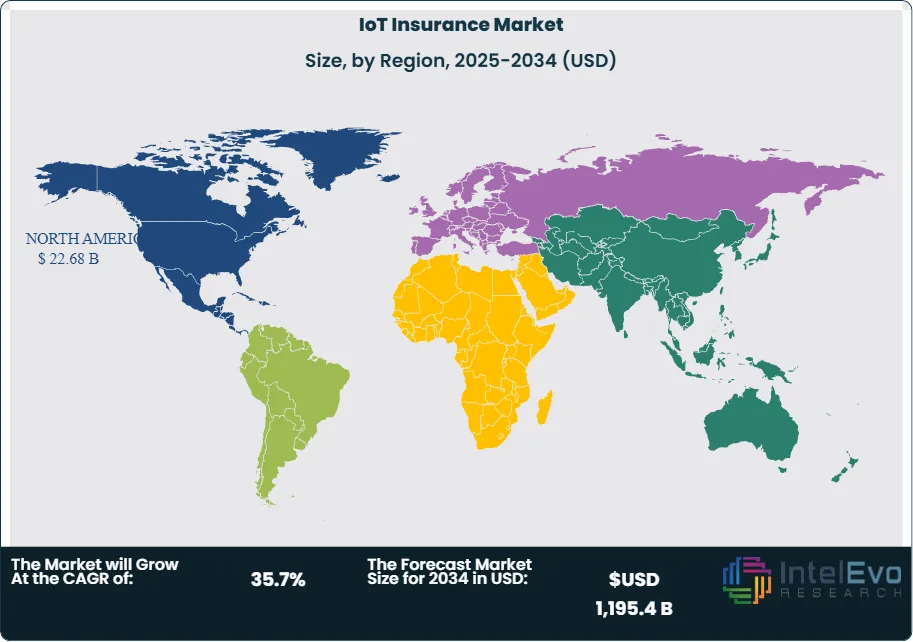
North America continues to dominate the IoT insurance market with approximately 38% market share, driven by established digital infrastructure, early adoption of telematics technology, and strong partnerships between insurers and technology companies. The region benefits from regulatory frameworks that support usage-based insurance models and a tech-savvy consumer base willing to embrace connected insurance solutions.
The COVID-19 pandemic accelerated the adoption of IoT insurance solutions as social distancing measures increased reliance on digital technologies and remote monitoring capabilities. Health insurance segments experienced significant growth in wearable device integration for remote patient monitoring, while automotive insurance saw temporary disruptions due to reduced driving but later benefited from increased focus on usage-based models as driving patterns normalized.
Ongoing geopolitical tensions and trade disputes between major economies have created supply chain challenges for IoT device manufacturing, potentially impacting the availability and cost of connected sensors and hardware components essential for IoT insurance solutions. Tariffs on electronic components and semiconductors have increased operational costs for insurance technology providers, while data sovereignty concerns have led to increased emphasis on local data processing and storage solutions. These factors have prompted insurers to diversify their technology supply chains and invest in regional partnerships to mitigate risks associated with international trade disruptions.
Key Takeaways
Market Growth: The IoT Insurance Market is expected to reach USD 1,195.4 Billion by 2034, due to rising connected device adoption and the need for real-time risk assessment. Solutions and services that enable data-driven underwriting are propelling revenue generation across insurance types and applications.
Component Dominance: Solutions hold the largest share of the market, as insurers prioritize IoT-enabled platforms and analytics systems to enhance operational efficiency and reduce claims costs.
Insurance Type Dominance: Health and Life Insurance dominates insurance types, driven by widespread use of wearables and connected health devices that monitor policyholder wellness.
Application Dominance: Automotive and Transportation is the leading application, with telematics and UBI policies revolutionizing motor insurance models and fostering safer driving practices.
Driver: Increasing regulatory support for risk-based pricing and advancements in sensor technology are significant drivers enabling insurers to offer innovative, customized policies.
Restraint: Data security concerns and high initial implementation costs limit market adoption, particularly among small and mid-sized insurers.
Opportunity: Growing demand for personalized policies and the expansion of IoT ecosystems in emerging economies present lucrative opportunities for market players.
Trend: Integration of artificial intelligence with IoT insurance platforms and the rise of blockchain-based data management are notable trends shaping the market landscape.
Regional Analysis: North America leads the market due to a robust technological ecosystem and early telematics adoption, while Asia Pacific shows strong growth potential supported by digitization initiatives.
Component Analysis:
Solutions are the backbone of IoT insurance adoption. Insurers are deploying platforms that collect and analyze sensor data, enabling more accurate risk modeling and premium calculations. Predictive analytics tools, policy administration systems, and cloud-based claims management platforms are integral to modern insurance ecosystems. Market leaders like SAP SE and SAS Institute Inc. provide comprehensive solutions that connect IoT device data with underwriting and fraud detection workflows. The emphasis on cost reduction and enhanced customer experiences continues to propel this segment’s dominance.
Insurance Type Analysis:
Health and Life Insurance Leads With more than 45% Market Share In IoT Insurance Market. The Health and Life Insurance segment leads due to widespread adoption of connected health devices and wearables. Insurers incentivize healthier lifestyles by offering lower premiums for customers who share data from fitness trackers and biometric sensors. This proactive monitoring reduces long-term healthcare costs and enables early intervention in chronic conditions. Health and life insurers are also using IoT data to streamline claims adjudication and detect fraud. The growing focus on preventive healthcare is likely to sustain this segment’s growth trajectory.
Application Analysis:
Automotive and Transportation applications command a significant share of the market, as telematics-based insurance has become mainstream. Usage-based insurance models leverage data from vehicle sensors and onboard diagnostics to assess driving behavior, mileage, and accident risks. Insurers are rewarding safe driving habits with premium discounts, enhancing customer loyalty. The growing fleet management market and regulatory mandates for telematics installation in commercial vehicles further strengthen this segment’s leadership.
Region Analysis:
North America Leads With nearly 40% Market Share In IoT Insurance Market. North America maintains its leadership position in the IoT insurance market, accounting for approximately 38% of global market share, primarily due to its well-established digital infrastructure, early adoption of telematics technology, and strong regulatory framework supporting usage-based insurance models. The region benefits from mature partnerships between insurance companies and technology providers, enabling rapid deployment of IoT solutions across automotive, health, and property insurance sectors. Major insurers in the United States and Canada have successfully implemented large-scale telematics programs that demonstrate clear value propositions for both companies and consumers.
Europe represents the second-largest market, driven by stringent data protection regulations that have actually enhanced consumer trust in IoT insurance solutions by ensuring robust privacy safeguards. The European market shows strong growth in smart home insurance applications and automotive telematics, supported by government initiatives promoting digital transformation and sustainable transportation. Asia-Pacific emerges as the fastest-growing region, fueled by increasing smartphone penetration, government digitalization programs, and rapidly expanding middle-class populations in countries like China and India. The region's growth is further accelerated by supportive regulatory environments and significant investments in 5G infrastructure that enable advanced IoT applications.
Component: (Services, Solution), Insurance Type: (Health and Life Insurance, Property and Casualty Insurance, Others Insurance Types), Application: (Agriculture, Automotive and Transportation, Buildings, Retail, Health and Life, Other Applications)
Research Methodology
Primary Research- 100 Interviews of Stakeholders
Secondary Research
Desk Research
Regional scope
North America (United States, Canada, Mexico)
Latin America (Brazil, Argentina, Columbia)
East Asia And Pacific (China, Japan, South Korea, Australia, Cambodia, Fiji, Indonesia)
Sea And South Asia (India, Singapore, Thailand, Taiwan, Malaysia)
Eastern Europe (Poland, Russia, Czech Republic, Romania)
Western Europe (Germany, U.K., France, Spain, Itlay)
Middle East & Africa (GCC Countries, Egypt, Nigeria, South Africa, Israel)
Competitive Landscape
SAP SE, Accenture PLC, Wipro, SAS Institute Inc., Cisco Systems Inc., Flatirons Development, LLC, Cognizant, Allerin Tech Pvt Ltd., Intel Corporation, Telit Cinterion, StreamLabs, Inc., Microsoft Corporation, Synechron, IBM Corporation
Customization Scope
Customization for segments, region/country-level will be provided. Moreover, additional customization can be done based on the requirements.
Pricing and Purchase Options
Avail customized purchase options to meet your exact research needs. We have three licenses to opt for: Single User License, Multi-User License (Up to 5 Users), Corporate Use License (Unlimited User and Printable PDF).
TABLE OF CONTENTS
1. EXECUTIVE SUMMARY
1.1. MARKET SNAPSHOT
1.2. KEY FINDINGS & INSIGHTS
1.3. ANALYST RECOMMENDATIONS
1.4. FUTURE OUTLOOK
2. RESEARCH METHODOLOGY
2.1. MARKET DEFINITION & SCOPE
2.2. RESEARCH OBJECTIVES: PRIMARY & SECONDARY DATA SOURCES
2.3. DATA COLLECTION SOURCES
2.3.1. COVERAGE OF 100+ PRIMARY RESEARCH/CONSULTATION CALLS WITH INDUSTRY STAKEHOLDERS
FIGURE 17 NORTH AMERICA IOT INSURANCE CURRENT AND FUTURE TYPE ANALYSIS, 2025–2034, (USD MILLION)
FIGURE 18 NORTH AMERICA IOT INSURANCE CURRENT AND FUTURE END USER ANALYSIS, 2025–2034, (USD MILLION)
FIGURE 19 MARKET SHARE BY COUNTRY
FIGURE 20 LATIN AMERICA IOT INSURANCE CURRENT AND FUTURE TYPE ANALYSIS, 2025–2034, (USD MILLION)
FIGURE 21 LATIN AMERICA IOT INSURANCE CURRENT AND FUTURE END USER ANALYSIS, 2025–2034, (USD MILLION)
FIGURE 22 MARKET SHARE BY COUNTRY
FIGURE 23 EASTERN EUROPE IOT INSURANCE CURRENT AND FUTURE TYPE ANALYSIS, 2025–2034, (USD MILLION)
FIGURE 24 EASTERN EUROPE IOT INSURANCE CURRENT AND FUTURE END USER ANALYSIS, 2025–2034, (USD MILLION)
FIGURE 25 MARKET SHARE BY COUNTRY
FIGURE 26 WESTERN EUROPE IOT INSURANCE CURRENT AND FUTURE TYPE ANALYSIS, 2025–2034, (USD MILLION)
FIGURE 27 WESTERN EUROPE IOT INSURANCE CURRENT AND FUTURE END USER ANALYSIS, 2025–2034, (USD MILLION)
FIGURE 28 MARKET SHARE BY COUNTRY
FIGURE 29 EAST ASIA AND PACIFIC IOT INSURANCE CURRENT AND FUTURE TYPE ANALYSIS, 2025–2034, (USD MILLION)
FIGURE 30 EAST ASIA AND PACIFIC IOT INSURANCE CURRENT AND FUTURE END USER ANALYSIS, 2025–2034, (USD MILLION)
FIGURE 31 MARKET SHARE BY COUNTRY
FIGURE 32 SEA AND SOUTH ASIA IOT INSURANCE CURRENT AND FUTURE TYPE ANALYSIS, 2025–2034, (USD MILLION)
FIGURE 33 SEA AND SOUTH ASIA IOT INSURANCE CURRENT AND FUTURE END USER ANALYSIS, 2025–2034, (USD MILLION)
FIGURE 34 MARKET SHARE BY COUNTRY
FIGURE 35 MIDDLE EAST AND AFRICA IOT INSURANCE CURRENT AND FUTURE TYPE ANALYSIS, 2025–2034, (USD MILLION)
FIGURE 36 MIDDLE EAST AND AFRICA IOT INSURANCE CURRENT AND FUTURE END USER ANALYSIS, 2025–2034, (USD MILLION)
FIGURE 37 NORTH AMERICA IOT INSURANCE CURRENT AND FUTURE MARKET VOLUME SHARE REGIONAL ANALYSIS, 2025–2034, (USD MILLION)
FIGURE 38 U.S. IOT INSURANCE CURRENT AND FUTURE TYPE ANALYSIS, 2025–2034, (USD MILLION)
FIGURE 39 U.S. IOT INSURANCE CURRENT AND FUTURE END USER ANALYSIS, 2025–2034, (USD MILLION)
FIGURE 40 CANADA IOT INSURANCE CURRENT AND FUTURE TYPE ANALYSIS, 2025–2034, (USD MILLION)
FIGURE 41 CANADA IOT INSURANCE CURRENT AND FUTURE END USER ANALYSIS, 2025–2034, (USD MILLION)
FIGURE 42 LATIN AMERICA IOT INSURANCE CURRENT AND FUTURE MARKET VOLUME SHARE REGIONAL ANALYSIS, 2025–2034, (USD MILLION)
FIGURE 43 MEXICO IOT INSURANCE CURRENT AND FUTURE TYPE ANALYSIS, 2025–2034, (USD MILLION)
FIGURE 44 MEXICO IOT INSURANCE CURRENT AND FUTURE END USER ANALYSIS, 2025–2034, (USD MILLION)
FIGURE 45 BRAZIL IOT INSURANCE CURRENT AND FUTURE TYPE ANALYSIS, 2025–2034, (USD MILLION)
FIGURE 46 BRAZIL IOT INSURANCE CURRENT AND FUTURE END USER ANALYSIS, 2025–2034, (USD MILLION)
FIGURE 47 ARGENTINA IOT INSURANCE CURRENT AND FUTURE TYPE ANALYSIS, 2025–2034, (USD MILLION)
FIGURE 48 ARGENTINA IOT INSURANCE CURRENT AND FUTURE END USER ANALYSIS, 2025–2034, (USD MILLION)
FIGURE 49 COLUMBIA IOT INSURANCE CURRENT AND FUTURE TYPE ANALYSIS, 2025–2034, (USD MILLION)
FIGURE 50 COLUMBIA IOT INSURANCE CURRENT AND FUTURE END USER ANALYSIS, 2025–2034, (USD MILLION)
FIGURE 51 REST OF LATIN AMERICA IOT INSURANCE CURRENT AND FUTURE TYPE ANALYSIS, 2025–2034, (USD MILLION)
FIGURE 52 REST OF LATIN AMERICA IOT INSURANCE CURRENT AND FUTURE END USER ANALYSIS, 2025–2034, (USD MILLION)
FIGURE 53 EASTERN EUROPE IOT INSURANCE CURRENT AND FUTURE MARKET VOLUME SHARE REGIONAL ANALYSIS, 2025–2034, (USD MILLION)
FIGURE 54 POLAND IOT INSURANCE CURRENT AND FUTURE TYPE ANALYSIS, 2025–2034, (USD MILLION)
FIGURE 55 POLAND IOT INSURANCE CURRENT AND FUTURE END USER ANALYSIS, 2025–2034, (USD MILLION)
FIGURE 56 RUSSIA IOT INSURANCE CURRENT AND FUTURE TYPE ANALYSIS, 2025–2034, (USD MILLION)
FIGURE 57 RUSSIA IOT INSURANCE CURRENT AND FUTURE END USER ANALYSIS, 2025–2034, (USD MILLION)
FIGURE 58 CZECH REPUBLIC IOT INSURANCE CURRENT AND FUTURE TYPE ANALYSIS, 2025–2034, (USD MILLION)
FIGURE 59 CZECH REPUBLIC IOT INSURANCE CURRENT AND FUTURE END USER ANALYSIS, 2025–2034, (USD MILLION)
FIGURE 60 ROMANIA IOT INSURANCE CURRENT AND FUTURE TYPE ANALYSIS, 2025–2034, (USD MILLION)
FIGURE 61 ROMANIA IOT INSURANCE CURRENT AND FUTURE END USER ANALYSIS, 2025–2034, (USD MILLION)
FIGURE 62 REST OF EASTERN EUROPE IOT INSURANCE CURRENT AND FUTURE TYPE ANALYSIS, 2025–2034, (USD MILLION)
FIGURE 63 REST OF EASTERN EUROPE IOT INSURANCE CURRENT AND FUTURE END USER ANALYSIS, 2025–2034, (USD MILLION)
FIGURE 64 WESTERN EUROPE IOT INSURANCE CURRENT AND FUTURE MARKET VOLUME SHARE REGIONAL ANALYSIS, 2025–2034, (USD MILLION)
FIGURE 65 GERMANY IOT INSURANCE CURRENT AND FUTURE TYPE ANALYSIS, 2025–2034, (USD MILLION)
FIGURE 66 GERMANY IOT INSURANCE CURRENT AND FUTURE END USER ANALYSIS, 2025–2034, (USD MILLION)
FIGURE 67 FRANCE IOT INSURANCE CURRENT AND FUTURE TYPE ANALYSIS, 2025–2034, (USD MILLION)
FIGURE 68 FRANCE IOT INSURANCE CURRENT AND FUTURE END USER ANALYSIS, 2025–2034, (USD MILLION)
FIGURE 69 UK IOT INSURANCE CURRENT AND FUTURE TYPE ANALYSIS, 2025–2034, (USD MILLION)
FIGURE 70 UK IOT INSURANCE CURRENT AND FUTURE END USER ANALYSIS, 2025–2034, (USD MILLION)
FIGURE 71 SPAIN IOT INSURANCE CURRENT AND FUTURE TYPE ANALYSIS, 2025–2034, (USD MILLION)
FIGURE 72 SPAIN IOT INSURANCE CURRENT AND FUTURE END USER ANALYSIS, 2025–2034, (USD MILLION)
FIGURE 73 ITALY IOT INSURANCE CURRENT AND FUTURE TYPE ANALYSIS, 2025–2034, (USD MILLION)
FIGURE 74 ITALY IOT INSURANCE CURRENT AND FUTURE END USER ANALYSIS, 2025–2034, (USD MILLION)
FIGURE 75 REST OF WESTERN EUROPE IOT INSURANCE CURRENT AND FUTURE TYPE ANALYSIS, 2025–2034, (USD MILLION)
FIGURE 76 REST OF WESTERN EUROPE IOT INSURANCE CURRENT AND FUTURE END USER ANALYSIS, 2025–2034, (USD MILLION)
FIGURE 77 EAST ASIA AND PACIFIC IOT INSURANCE CURRENT AND FUTURE MARKET VOLUME SHARE REGIONAL ANALYSIS, 2025–2034, (USD MILLION)
FIGURE 78 CHINA IOT INSURANCE CURRENT AND FUTURE TYPE ANALYSIS, 2025–2034, (USD MILLION)
FIGURE 79 CHINA IOT INSURANCE CURRENT AND FUTURE END USER ANALYSIS, 2025–2034, (USD MILLION)
FIGURE 80 JAPAN IOT INSURANCE CURRENT AND FUTURE TYPE ANALYSIS, 2025–2034, (USD MILLION)
FIGURE 81 JAPAN IOT INSURANCE CURRENT AND FUTURE END USER ANALYSIS, 2025–2034, (USD MILLION)
FIGURE 82 AUSTRALIA IOT INSURANCE CURRENT AND FUTURE TYPE ANALYSIS, 2025–2034, (USD MILLION)
FIGURE 83 AUSTRALIA IOT INSURANCE CURRENT AND FUTURE END USER ANALYSIS, 2025–2034, (USD MILLION)
FIGURE 84 CAMBODIA IOT INSURANCE CURRENT AND FUTURE TYPE ANALYSIS, 2025–2034, (USD MILLION)
FIGURE 85 CAMBODIA IOT INSURANCE CURRENT AND FUTURE END USER ANALYSIS, 2025–2034, (USD MILLION)
FIGURE 86 FIJI IOT INSURANCE CURRENT AND FUTURE TYPE ANALYSIS, 2025–2034, (USD MILLION)
FIGURE 87 FIJI IOT INSURANCE CURRENT AND FUTURE END USER ANALYSIS, 2025–2034, (USD MILLION)
FIGURE 88 INDONESIA IOT INSURANCE CURRENT AND FUTURE TYPE ANALYSIS, 2025–2034, (USD MILLION)
FIGURE 89 INDONESIA IOT INSURANCE CURRENT AND FUTURE END USER ANALYSIS, 2025–2034, (USD MILLION)
FIGURE 90 SOUTH KOREA IOT INSURANCE CURRENT AND FUTURE TYPE ANALYSIS, 2025–2034, (USD MILLION)
FIGURE 91 SOUTH KOREA IOT INSURANCE CURRENT AND FUTURE END USER ANALYSIS, 2025–2034, (USD MILLION)
FIGURE 92 REST OF EAST ASIA AND PACIFIC IOT INSURANCE CURRENT AND FUTURE TYPE ANALYSIS, 2025–2034, (USD MILLION)
FIGURE 93 REST OF EAST ASIA AND PACIFIC IOT INSURANCE CURRENT AND FUTURE END USER ANALYSIS, 2025–2034, (USD MILLION)
FIGURE 94 SEA AND SOUTH ASIA IOT INSURANCE CURRENT AND FUTURE MARKET VOLUME SHARE REGIONAL ANALYSIS, 2025–2034, (USD MILLION)
FIGURE 95 BANGLADESH IOT INSURANCE CURRENT AND FUTURE TYPE ANALYSIS, 2025–2034, (USD MILLION)
FIGURE 96 BANGLADESH IOT INSURANCE CURRENT AND FUTURE END USER ANALYSIS, 2025–2034, (USD MILLION)
FIGURE 97 NEW ZEALAND IOT INSURANCE CURRENT AND FUTURE TYPE ANALYSIS, 2025–2034, (USD MILLION)
FIGURE 98 NEW ZEALAND IOT INSURANCE CURRENT AND FUTURE END USER ANALYSIS, 2025–2034, (USD MILLION)
FIGURE 99 INDIA IOT INSURANCE CURRENT AND FUTURE TYPE ANALYSIS, 2025–2034, (USD MILLION)
FIGURE 100 INDIA IOT INSURANCE CURRENT AND FUTURE END USER ANALYSIS, 2025–2034, (USD MILLION)
FIGURE 101 SINGAPORE IOT INSURANCE CURRENT AND FUTURE TYPE ANALYSIS, 2025–2034, (USD MILLION)
FIGURE 102 SINGAPORE IOT INSURANCE CURRENT AND FUTURE END USER ANALYSIS, 2025–2034, (USD MILLION)
FIGURE 103 THAILAND IOT INSURANCE CURRENT AND FUTURE TYPE ANALYSIS, 2025–2034, (USD MILLION)
FIGURE 104 THAILAND IOT INSURANCE CURRENT AND FUTURE END USER ANALYSIS, 2025–2034, (USD MILLION)
FIGURE 105 TAIWAN IOT INSURANCE CURRENT AND FUTURE TYPE ANALYSIS, 2025–2034, (USD MILLION)
FIGURE 106 TAIWAN IOT INSURANCE CURRENT AND FUTURE END USER ANALYSIS, 2025–2034, (USD MILLION)
FIGURE 107 MALAYSIA IOT INSURANCE CURRENT AND FUTURE TYPE ANALYSIS, 2025–2034, (USD MILLION)
FIGURE 108 MALAYSIA IOT INSURANCE CURRENT AND FUTURE END USER ANALYSIS, 2025–2034, (USD MILLION)
FIGURE 109 REST OF SEA AND SOUTH ASIA IOT INSURANCE CURRENT AND FUTURE TYPE ANALYSIS, 2025–2034, (USD MILLION)
FIGURE 110 REST OF SEA AND SOUTH ASIA IOT INSURANCE CURRENT AND FUTURE END USER ANALYSIS, 2025–2034, (USD MILLION)
FIGURE 111 MIDDLE EAST AND AFRICA IOT INSURANCE CURRENT AND FUTURE MARKET VOLUME SHARE REGIONAL ANALYSIS, 2025–2034, (USD MILLION)
FIGURE 112 GCC COUNTRIES IOT INSURANCE CURRENT AND FUTURE TYPE ANALYSIS, 2025–2034, (USD MILLION)
FIGURE 113 GCC COUNTRIES IOT INSURANCE CURRENT AND FUTURE END USER ANALYSIS, 2025–2034, (USD MILLION)
FIGURE 114 SAUDI ARABIA IOT INSURANCE CURRENT AND FUTURE TYPE ANALYSIS, 2025–2034, (USD MILLION)
FIGURE 115 SAUDI ARABIA IOT INSURANCE CURRENT AND FUTURE END USER ANALYSIS, 2025–2034, (USD MILLION)
FIGURE 116 UAE IOT INSURANCE CURRENT AND FUTURE TYPE ANALYSIS, 2025–2034, (USD MILLION)
FIGURE 117 UAE IOT INSURANCE CURRENT AND FUTURE END USER ANALYSIS, 2025–2034, (USD MILLION)
FIGURE 118 BAHRAIN IOT INSURANCE CURRENT AND FUTURE TYPE ANALYSIS, 2025–2034, (USD MILLION)
FIGURE 119 BAHRAIN IOT INSURANCE CURRENT AND FUTURE END USER ANALYSIS, 2025–2034, (USD MILLION)
FIGURE 120 KUWAIT IOT INSURANCE CURRENT AND FUTURE TYPE ANALYSIS, 2025–2034, (USD MILLION)
FIGURE 121 KUWAIT IOT INSURANCE CURRENT AND FUTURE END USER ANALYSIS, 2025–2034, (USD MILLION)
FIGURE 122 OMAN IOT INSURANCE CURRENT AND FUTURE TYPE ANALYSIS, 2025–2034, (USD MILLION)
FIGURE 123 OMAN IOT INSURANCE CURRENT AND FUTURE END USER ANALYSIS, 2025–2034, (USD MILLION)
FIGURE 124 QATAR IOT INSURANCE CURRENT AND FUTURE TYPE ANALYSIS, 2025–2034, (USD MILLION)
FIGURE 125 QATAR IOT INSURANCE CURRENT AND FUTURE END USER ANALYSIS, 2025–2034, (USD MILLION)
FIGURE 126 EGYPT IOT INSURANCE CURRENT AND FUTURE TYPE ANALYSIS, 2025–2034, (USD MILLION)
FIGURE 127 EGYPT IOT INSURANCE CURRENT AND FUTURE END USER ANALYSIS, 2025–2034, (USD MILLION)
FIGURE 128 NIGERIA IOT INSURANCE CURRENT AND FUTURE TYPE ANALYSIS, 2025–2034, (USD MILLION)
FIGURE 129 NIGERIA IOT INSURANCE CURRENT AND FUTURE END USER ANALYSIS, 2025–2034, (USD MILLION)
FIGURE 130 SOUTH AFRICA IOT INSURANCE CURRENT AND FUTURE TYPE ANALYSIS, 2025–2034, (USD MILLION)
FIGURE 131 SOUTH AFRICA IOT INSURANCE CURRENT AND FUTURE END USER ANALYSIS, 2025–2034, (USD MILLION)
FIGURE 132 ISRAEL IOT INSURANCE CURRENT AND FUTURE TYPE ANALYSIS, 2025–2034, (USD MILLION)
FIGURE 133 ISRAEL IOT INSURANCE CURRENT AND FUTURE END USER ANALYSIS, 2025–2034, (USD MILLION)
FIGURE 134 REST OF MEA IOT INSURANCE CURRENT AND FUTURE TYPE ANALYSIS, 2025–2034, (USD MILLION)
FIGURE 135 REST OF MEA IOT INSURANCE CURRENT AND FUTURE END USER ANALYSIS, 2025–2034, (USD MILLION)
FIGURE 136 U. S. MARKET SHARE ANALYSIS BY TYPE (2024)
FIGURE 137 U. S. MARKET SHARE ANALYSIS BY END USER (2024)
FIGURE 138 CANADA MARKET SHARE ANALYSIS BY TYPE (2024)
FIGURE 139 CANADA MARKET SHARE ANALYSIS BY END USER (2024)
FIGURE 140 MEXICO MARKET SHARE ANALYSIS BY TYPE (2024)
FIGURE 141 MEXICO MARKET SHARE ANALYSIS BY END USER (2024)
FIGURE 142 CHINA MARKET SHARE ANALYSIS BY TYPE (2024)
FIGURE 143 CHINA MARKET SHARE ANALYSIS BY END USER (2024)
FIGURE 144 JAPAN MARKET SHARE ANALYSIS BY TYPE (2024)
FIGURE 145 JAPAN MARKET SHARE ANALYSIS BY END USER (2024)
FIGURE 146 INDIA MARKET SHARE ANALYSIS BY TYPE (2024)
FIGURE 147 INDIA MARKET SHARE ANALYSIS BY END USER (2024)
FIGURE 148 SOUTH KOREA MARKET SHARE ANALYSIS BY TYPE (2024)
FIGURE 149 SOUTH KOREA MARKET SHARE ANALYSIS BY END USER (2024)
FIGURE 150 SAUDI ARABIA MARKET SHARE ANALYSIS BY TYPE (2024)
FIGURE 151 SAUDI ARABIA MARKET SHARE ANALYSIS BY END USER (2024)
FIGURE 152 UAE MARKET SHARE ANALYSIS BY TYPE (2024)
FIGURE 153 UAE MARKET SHARE ANALYSIS BY END USER (2024)
FIGURE 154 EGYPT MARKET SHARE ANALYSIS BY TYPE (2024)
FIGURE 155 EGYPT MARKET SHARE ANALYSIS BY END USER (2024)
FIGURE 156 NIGERIA MARKET SHARE ANALYSIS BY TYPE (2024)
FIGURE 157 NIGERIA MARKET SHARE ANALYSIS BY END USER (2024)
FIGURE 158 SOUTH AFRICA MARKET SHARE ANALYSIS BY TYPE (2024)
FIGURE 159 SOUTH AFRICA MARKET SHARE ANALYSIS BY END USER (2024)
FIGURE 160 GERMANY MARKET SHARE ANALYSIS BY TYPE (2024)
FIGURE 161 GERMANY MARKET SHARE ANALYSIS BY END USER (2024)
FIGURE 162 FRANCE MARKET SHARE ANALYSIS BY TYPE (2024)
FIGURE 163 FRANCE MARKET SHARE ANALYSIS BY END USER (2024)
FIGURE 164 UK MARKET SHARE ANALYSIS BY TYPE (2024)
FIGURE 165 UK MARKET SHARE ANALYSIS BY END USER (2024)
FIGURE 166 SPAIN MARKET SHARE ANALYSIS BY TYPE (2024)
FIGURE 167 SPAIN MARKET SHARE ANALYSIS BY END USER (2024)
FIGURE 168 ITALY MARKET SHARE ANALYSIS BY TYPE (2024)
FIGURE 169 ITALY MARKET SHARE ANALYSIS BY END USER (2024)
FIGURE 170 BRAZIL MARKET SHARE ANALYSIS BY TYPE (2024)
FIGURE 171 BRAZIL MARKET SHARE ANALYSIS BY END USER (2024)
FIGURE 172 ARGENTINA MARKET SHARE ANALYSIS BY TYPE (2024)
FIGURE 173 ARGENTINA MARKET SHARE ANALYSIS BY END USER (2024)
FIGURE 174 COLUMBIA MARKET SHARE ANALYSIS BY TYPE (2024)
FIGURE 175 COLUMBIA MARKET SHARE ANALYSIS BY END USER (2024)
FIGURE 176 GLOBAL IOT INSURANCE CURRENT AND FUTURE MARKET KEY COUNTRY LEVEL ANALYSIS, 2024–2034, (USD MILLION)
FIGURE 177 FINANCIAL OVERVIEW:
Key Players Analysis:
Microsoft Corporation: Microsoft stands as a technology giant in the IoT insurance market, leveraging its comprehensive cloud computing platform Azure and artificial intelligence capabilities to provide end-to-end IoT insurance solutions. The company's strength lies in its ability to integrate IoT devices, data analytics, and machine learning capabilities into unified platforms that can scale to meet enterprise insurance requirements. Microsoft's Azure IoT platform provides the foundational infrastructure for many insurance companies' digital transformation initiatives, offering secure data processing, real-time analytics, and integration with existing enterprise systems. The company's extensive partner ecosystem and global reach enable insurance companies to implement IoT solutions across multiple markets while maintaining compliance with local regulations and data protection requirements.
SAP SE: SAP SE emerges as a dominant force in the IoT insurance market through its comprehensive enterprise resource planning solutions and specialized insurance industry expertise. The company's strength lies in providing integrated business platforms that combine IoT data collection with core insurance operations including policy management, claims processing, and customer relationship management. SAP's industry-specific solutions for insurance companies enable seamless integration of IoT data into existing business processes while maintaining regulatory compliance and operational efficiency. The company's global presence and extensive implementation experience make it a preferred partner for large insurance companies seeking to modernize their operations with IoT capabilities.
IBM Corporation: IBM Corporation leverages its decades of enterprise technology experience and artificial intelligence capabilities to provide sophisticated IoT insurance solutions that emphasize advanced analytics and cognitive computing. The company's strength lies in its ability to process complex IoT data streams using Watson AI platform and provide actionable insights for risk assessment, fraud detection, and customer service automation. IBM's consulting services and industry expertise enable insurance companies to develop comprehensive IoT strategies that align with business objectives while addressing technical and operational challenges. The company's focus on hybrid cloud solutions and data security makes it particularly attractive to large insurance companies with complex regulatory requirements and legacy system integration needs.
Intel Corporation: Intel Corporation plays a crucial role in the IoT insurance market by providing the semiconductor technology and edge computing capabilities that enable efficient processing of IoT data at the device level. The company's strength lies in its comprehensive IoT platform that includes processors, connectivity solutions, and software development tools that enable insurance companies to build customized IoT solutions. Intel's edge computing capabilities are particularly valuable for insurance applications that require real-time processing and low-latency responses, such as autonomous vehicle insurance and critical health monitoring systems. The company's partnerships with device manufacturers and system integrators create a robust ecosystem that supports widespread IoT insurance adoption.
Accenture PLC: Accenture PLC stands out as a consulting and technology services giant that helps insurance companies implement comprehensive IoT transformation strategies. The company's strength lies in its deep industry expertise combined with technology implementation capabilities that enable end-to-end IoT insurance solutions. Accenture's consulting services help insurers develop IoT strategies that align with business objectives while addressing regulatory, technical, and operational challenges. The company's global delivery capabilities and extensive partner network enable large-scale IoT insurance implementations across multiple markets and insurance sectors. Accenture's focus on innovation and emerging technologies positions it as a key enabler of next-generation IoT insurance solutions that incorporate artificial intelligence, blockchain, and advanced analytics capabilities.
Market Key Players
SAP SE
Accenture PLC
Wipro
SAS Institute Inc.
Cisco Systems Inc.
Flatirons Development, LLC
Cognizant
Allerin Tech Pvt Ltd.
Intel Corporation
Telit Cinterion
StreamLabs, Inc.
Microsoft Corporation
Synechron
IBM Corporation
Driver:
Regulatory Support for Risk-Based Pricing:
Regulatory authorities worldwide are encouraging insurers to adopt data-driven pricing models that reward responsible behavior and improve transparency. In North America, regulators have endorsed usage-based insurance to foster safer driving. In Europe, initiatives like eCall mandate telematics integration in vehicles, enabling real-time accident alerts and risk assessment. This support reduces adverse selection, improves solvency ratios, and drives innovation in insurance product design. As regulators increasingly favor risk-based underwriting, IoT solutions will become indispensable tools for insurers.
Advancements in Sensor Technology:
Rapid improvements in sensor accuracy, affordability, and interoperability are transforming IoT insurance. Modern sensors capture granular data on driving patterns, health metrics, and environmental conditions. These advancements enable real-time monitoring, predictive maintenance, and dynamic pricing. For example, insurers can detect early signs of engine failure in vehicles or monitor air quality in insured properties. As sensors become more reliable and energy-efficient, insurers will expand IoT deployment across new insurance lines and customer segments.
Restrain:
Data Security and Privacy Concerns:
Insurers face heightened scrutiny over how IoT data is collected, stored, and processed. Customers are wary of sharing sensitive information, such as health metrics and location data, fearing misuse or breaches. Regulatory frameworks like GDPR impose strict compliance requirements, increasing operational complexity. To maintain trust, insurers must invest heavily in cybersecurity, encryption, and transparent consent mechanisms, which can slow down IoT adoption.
High Implementation and Integration Costs:
Deploying IoT solutions requires substantial upfront investments in hardware, software, and employee training. Smaller insurers often lack the resources to integrate IoT platforms with legacy systems. Additionally, maintaining connectivity across diverse devices and ensuring data accuracy can increase operational costs. These challenges limit market penetration, especially in price-sensitive and emerging economies.
Opportunities:
Expansion in Emerging Economies:
Emerging markets in Asia Pacific and Latin America present enormous growth opportunities for IoT insurance. Rising internet penetration, a growing middle class, and supportive government policies are creating fertile ground for insurers to introduce affordable, personalized insurance products. Local partnerships with telecom operators and technology firms will accelerate IoT adoption and enable insurers to tap into underinsured populations.
Personalization of Insurance Products:
Customers increasingly demand tailored policies that reflect their unique lifestyles and risk profiles. IoT enables insurers to create dynamic insurance models, where premiums adjust based on real-time behavior and conditions. For example, life insurers can reward policyholders who maintain healthy habits tracked via wearables. Personalization not only improves customer satisfaction but also reduces claims incidence and fosters long-term loyalty.
Trends:
Integration of Artificial Intelligence with IoT Platforms:
AI-powered analytics are transforming IoT insurance by enabling predictive risk modeling and automated decision-making. Machine learning algorithms can detect anomalies in sensor data, flag fraudulent claims, and recommend interventions. AI also powers chatbots and virtual assistants, enhancing policyholder engagement. The convergence of AI and IoT will set new benchmarks for efficiency and precision in underwriting.
Adoption of Blockchain for Data Management:
Blockchain technology is emerging as a secure framework for managing IoT-generated data. Distributed ledgers ensure data integrity, prevent tampering, and streamline claims processing. Insurers are exploring smart contracts to automate payouts when IoT sensors trigger pre-defined conditions. This trend will drive transparency, reduce operational friction, and build customer trust in IoT insurance offerings.
Recent Development
In May 2025: Coalition, recognized as the world’s first Active Insurance provider focused on preventing digital risks before they occur, has officially launched its innovative Active Cyber Insurance product in the Nordic region. This expansion is being executed through its Danish subsidiary, Coalition Insurance Solutions, filial af Coalition Insurance Solutions GmbH, based in Germany. The coverage became available in Denmark starting May 1, 2025, with plans to extend availability to Sweden on May 8, 2025.
In December 2024: Insuritas has been officially acquired by VIU by HUB, a specialized division within HUB International. HUB International ranks as the fifth-largest insurance brokerage firm globally, known for its extensive network and comprehensive insurance solutions. This acquisition marks a strategic milestone for Insuritas, positioning the company to leverage HUB’s vast resources, industry expertise, and global reach. Together, they aim to accelerate innovation, expand service offerings, and deliver even greater value to clients and partners across the insurance landscape.