IT Solution for Dialysis Market Forecast 2024–2034 | 8.6% CAGR
Global IT Solution for Dialysis Market Size, Share & Analysis By Deployment Type (On-premise, Cloud-based), By Application (Data Acquisition, Data Management, Quality Assurance, Others) Industry Outlook, Healthcare Digitalization & Forecast 2025–2034
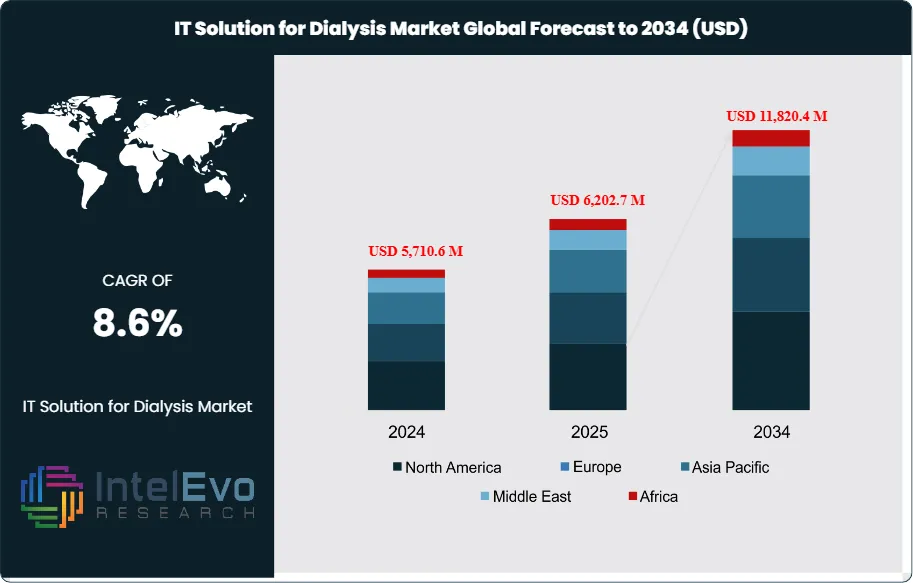
The IT Solution for Dialysis Market is valued at USD 5,710.6 million in 2024 and is projected to reach approximately USD 11,820.4 million by 2034, reflecting a robust CAGR of about 8.6% during 2025–2034. Growing digital transformation across dialysis centers, increasing adoption of workflow automation, and rising integration of AI-driven clinical decision tools are accelerating market expansion. As patient volumes climb and remote care models mature, dialysis providers are prioritizing scalable IT ecosystems, driving strong global demand. This shift positions dialysis IT solutions as a critical enabler of precision care and operational efficiency worldwide.
Rising incidence of kidney failure and the growing need for accessible, cost-efficient dialysis treatment are accelerating the adoption of IT-driven systems in nephrology care. Over the past decade, the market has shifted from facility-based hemodialysis models to more patient-centric home treatment options, enabled by digital interfaces and real-time monitoring tools. This evolution reflects broader healthcare trends favoring decentralized care and automation. As of 2023, the number of dialysis patients globally surpassed 3.5 million, with a consistent year-on-year increase driven by aging populations and rising rates of diabetes and hypertension.
Demand-side growth is further supported by the expanding use of home dialysis technologies, which reduce treatment time and hospital dependency. On the supply side, manufacturers are scaling R&D investments to enhance software integration, remote diagnostics, and predictive analytics. However, high implementation costs, regulatory constraints, and risks of data breaches pose notable barriers. Interoperability with hospital information systems and compliance with health data privacy regulations also remain significant concerns for healthcare providers.
Technological advances are shaping the market trajectory. Cloud-based platforms, AI-powered patient monitoring, and remote diagnostic capabilities now play a central role in improving clinical outcomes. For instance, AI algorithms are being developed to predict fluid imbalance or detect early signs of vascular access failure. These tools reduce complications, minimize hospital visits, and support clinical decision-making.
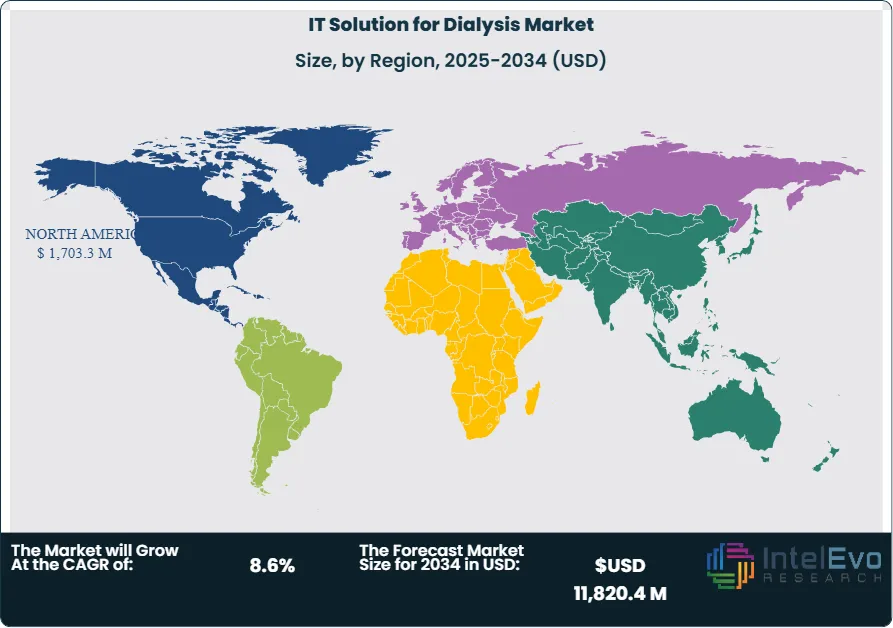
Regionally, North America leads the market due to strong healthcare IT infrastructure, reimbursement support, and high adoption of home dialysis solutions. Europe follows, driven by public health initiatives and increasing preference for digital tools in chronic care management. Meanwhile, Asia-Pacific is emerging as a high-growth region, particularly in countries like China and India where ESRD (End-Stage Renal Disease) cases are rising and healthcare digitization is expanding rapidly. Investors should monitor these emerging markets closely, where infrastructure gaps are narrowing and demand for scalable treatment solutions continues to rise.
As global health systems prioritize cost containment and remote care, IT solutions for dialysis are becoming integral to next-decade renal care delivery.
Key Takeaways
Market Growth: The global IT solution for dialysis market reached USD 5,710.6 million in 2024 and is projected to reach USD 11,820.4 million by 2034, expanding at a CAGR of 8.6%. Growth is driven by rising global dialysis procedures and the shift toward home-based treatment supported by digital platforms.
Deployment Type: On-premise solutions accounted for 58.3% of market share in 2023, driven by demand for greater data control and security within hospital and clinic-based dialysis centres.
Application: Data acquisition held 35.2% of the market in 2023, as real-time patient monitoring and electronic data capture remain critical for treatment accuracy and regulatory compliance.
Driver: Increasing dialysis prevalence due to the global rise in chronic kidney disease (CKD) cases, particularly linked to diabetes and hypertension, is boosting IT infrastructure investments in nephrology services.
Restraint: High implementation costs and ongoing maintenance of IT systems limit adoption among small- to mid-sized healthcare facilities, particularly in price-sensitive markets.
Opportunity: Asia-Pacific presents a strong growth opportunity, with expanding healthcare access and rising ESRD (End-Stage Renal Disease) rates. The region is expected to register a CAGR above the global average through 2033.
Trend: Integration of artificial intelligence and advanced analytics is gaining traction. AI-driven systems are being used to predict dialysis-related complications, enhancing clinical decision-making and reducing hospitalization rates.
Regional Analysis: North America led the market in 2023 with a 39.2% share and USD 1,703.3 million in revenue, supported by established healthcare IT systems and reimbursement models. Asia-Pacific is emerging rapidly, driven by increased investment in digital healthcare infrastructure and growing dialysis demand.
Deployment strategy significantly influences the operational efficiency and data security of dialysis centers implementing IT solutions. In 2025, on-premise solutions continue to lead, accounting for approximately 58.3% of the global market. These systems appeal to hospitals and clinics that prioritize internal data control and compliance, particularly where patient privacy regulations are strict. They also allow for greater customization and integration with legacy systems, which remains important in high-volume treatment centers.
However, the momentum is shifting toward cloud-based deployments. Healthcare providers are increasingly investing in cloud infrastructure to gain remote access to patient data, support telehealth functionality, and reduce dependence on physical IT assets. The cloud model offers scalability that supports fluctuating workloads and enables seamless collaboration between nephrologists, technicians, and administrative staff. With healthcare IT spending projected to rise at a CAGR of over 9% globally through 2030, cloud adoption in dialysis settings is expected to accelerate, especially in regions prioritizing digital health expansion.
Application Analysis
Among dialysis IT applications, data acquisition dominates with a 35.2% share as of 2025. This segment includes the capture of real-time clinical indicators such as blood pressure, treatment history, ultrafiltration levels, and laboratory results. Capturing accurate and timely data is vital for tailoring dialysis protocols, reducing treatment errors, and supporting long-term patient tracking. The demand for integrated monitoring systems is increasing, particularly as providers move toward value-based care models.
Data management is another critical area, focused on secure data storage, structured retrieval, and interoperability with hospital information systems. Efficient data management improves clinical workflow and supports regulatory compliance. Providers increasingly seek platforms that centralize patient records across multiple sites, making this application essential to both public and private sector initiatives.
Quality assurance tools are also gaining ground, particularly in mature healthcare markets. These systems support adherence to international treatment guidelines, monitor procedural deviations, and reduce risks of complications. With regulators tightening oversight on dialysis outcomes, IT solutions that incorporate QA dashboards and automated alerts are seeing wider deployment.
Regional Analysis
North America remains the dominant market, generating USD 1,703.3 million in revenue in 2023 and maintaining a 39.2% global share. This lead is reinforced by large-scale investments in health IT infrastructure, policy support for home-based dialysis, and strong collaborations between software providers and dialysis service operators. For example, Fresenius Medical Care and Acumen Physician Solutions have co-developed nephrology-specific EHR systems, reinforcing their market leadership through specialized digital offerings.
In contrast, Asia Pacific is the fastest-growing region, driven by rising ESRD prevalence, expanding healthcare budgets, and improving broadband access. Countries like India and China are deploying public-private partnerships to scale digital dialysis solutions in underserved areas. The regional market is projected to grow at a CAGR exceeding 8% through 2030.
In the Middle East and Africa, market expansion faces challenges related to logistics and supply chain disruptions. Countries like Saudi Arabia and Egypt have reported difficulties in sourcing equipment and software, which may delay large-scale IT deployments. Meanwhile, regulatory bodies in Europe, such as NHS England, are actively working with renal care networks to ensure continuity of services amid these supply constraints, indicating an evolving support structure but highlighting the risk of regional imbalances in deployment capacity.
By Deployment Type (On-premise, Cloud-based), By Application (Data Acquisition, Data Management, Quality Assurance, Others)
Research Methodology
Primary Research- 100 Interviews of Stakeholders
Secondary Research
Desk Research
Regional scope
North America (United States, Canada, Mexico)
Latin America (Brazil, Argentina, Columbia)
East Asia And Pacific (China, Japan, South Korea, Australia, Cambodia, Fiji, Indonesia)
Sea And South Asia (India, Singapore, Thailand, Taiwan, Malaysia)
Eastern Europe (Poland, Russia, Czech Republic, Romania)
Western Europe (Germany, U.K., France, Spain, Itlay)
Middle East & Africa (GCC Countries, Egypt, Nigeria, South Africa, Israel)
Competitive Landscape
Gaia Software, Fresenius Medical Care, CureMD Healthcare, Renalyx, CitiusTech, Visonex, Constellation Kidney Group, B.Braun, Document Storage Systems, Sagekey Software, iSalus Healthcare, Aithent, M Dialysis, Renesan Software, QuantumSys Technologies
Customization Scope
Customization for segments, region/country-level will be provided. Moreover, additional customization can be done based on the requirements.
Pricing and Purchase Options
Avail customized purchase options to meet your exact research needs. We have three licenses to opt for: Single User License, Multi-User License (Up to 5 Users), Corporate Use License (Unlimited User and Printable PDF).
TABLE OF CONTENTS
1. EXECUTIVE SUMMARY
1.1. MARKET SNAPSHOT
1.2. KEY FINDINGS & INSIGHTS
1.3. ANALYST RECOMMENDATIONS
1.4. FUTURE OUTLOOK
2. RESEARCH METHODOLOGY
2.1. MARKET DEFINITION & SCOPE
2.2. RESEARCH OBJECTIVES: PRIMARY & SECONDARY DATA SOURCES
2.3. DATA COLLECTION SOURCES
2.3.1. COVERAGE OF 100+ PRIMARY RESEARCH/CONSULTATION CALLS WITH INDUSTRY STAKEHOLDERS
FIGURE 17 NORTH AMERICA IT SOLUTION FOR DIALYSIS CURRENT AND FUTURE TYPE ANALYSIS, 2025–2034, (USD MILLION)
FIGURE 18 NORTH AMERICA IT SOLUTION FOR DIALYSIS CURRENT AND FUTURE END USER ANALYSIS, 2025–2034, (USD MILLION)
FIGURE 19 MARKET SHARE BY COUNTRY
FIGURE 20 LATIN AMERICA IT SOLUTION FOR DIALYSIS CURRENT AND FUTURE TYPE ANALYSIS, 2025–2034, (USD MILLION)
FIGURE 21 LATIN AMERICA IT SOLUTION FOR DIALYSIS CURRENT AND FUTURE END USER ANALYSIS, 2025–2034, (USD MILLION)
FIGURE 22 MARKET SHARE BY COUNTRY
FIGURE 23 EASTERN EUROPE IT SOLUTION FOR DIALYSIS CURRENT AND FUTURE TYPE ANALYSIS, 2025–2034, (USD MILLION)
FIGURE 24 EASTERN EUROPE IT SOLUTION FOR DIALYSIS CURRENT AND FUTURE END USER ANALYSIS, 2025–2034, (USD MILLION)
FIGURE 25 MARKET SHARE BY COUNTRY
FIGURE 26 WESTERN EUROPE IT SOLUTION FOR DIALYSIS CURRENT AND FUTURE TYPE ANALYSIS, 2025–2034, (USD MILLION)
FIGURE 27 WESTERN EUROPE IT SOLUTION FOR DIALYSIS CURRENT AND FUTURE END USER ANALYSIS, 2025–2034, (USD MILLION)
FIGURE 28 MARKET SHARE BY COUNTRY
FIGURE 29 EAST ASIA AND PACIFIC IT SOLUTION FOR DIALYSIS CURRENT AND FUTURE TYPE ANALYSIS, 2025–2034, (USD MILLION)
FIGURE 30 EAST ASIA AND PACIFIC IT SOLUTION FOR DIALYSIS CURRENT AND FUTURE END USER ANALYSIS, 2025–2034, (USD MILLION)
FIGURE 31 MARKET SHARE BY COUNTRY
FIGURE 32 SEA AND SOUTH ASIA IT SOLUTION FOR DIALYSIS CURRENT AND FUTURE TYPE ANALYSIS, 2025–2034, (USD MILLION)
FIGURE 33 SEA AND SOUTH ASIA IT SOLUTION FOR DIALYSIS CURRENT AND FUTURE END USER ANALYSIS, 2025–2034, (USD MILLION)
FIGURE 34 MARKET SHARE BY COUNTRY
FIGURE 35 MIDDLE EAST AND AFRICA IT SOLUTION FOR DIALYSIS CURRENT AND FUTURE TYPE ANALYSIS, 2025–2034, (USD MILLION)
FIGURE 36 MIDDLE EAST AND AFRICA IT SOLUTION FOR DIALYSIS CURRENT AND FUTURE END USER ANALYSIS, 2025–2034, (USD MILLION)
FIGURE 37 NORTH AMERICA IT SOLUTION FOR DIALYSIS CURRENT AND FUTURE MARKET VOLUME SHARE REGIONAL ANALYSIS, 2025–2034, (USD MILLION)
FIGURE 38 U.S. IT SOLUTION FOR DIALYSIS CURRENT AND FUTURE TYPE ANALYSIS, 2025–2034, (USD MILLION)
FIGURE 39 U.S. IT SOLUTION FOR DIALYSIS CURRENT AND FUTURE END USER ANALYSIS, 2025–2034, (USD MILLION)
FIGURE 40 CANADA IT SOLUTION FOR DIALYSIS CURRENT AND FUTURE TYPE ANALYSIS, 2025–2034, (USD MILLION)
FIGURE 41 CANADA IT SOLUTION FOR DIALYSIS CURRENT AND FUTURE END USER ANALYSIS, 2025–2034, (USD MILLION)
FIGURE 42 LATIN AMERICA IT SOLUTION FOR DIALYSIS CURRENT AND FUTURE MARKET VOLUME SHARE REGIONAL ANALYSIS, 2025–2034, (USD MILLION)
FIGURE 43 MEXICO IT SOLUTION FOR DIALYSIS CURRENT AND FUTURE TYPE ANALYSIS, 2025–2034, (USD MILLION)
FIGURE 44 MEXICO IT SOLUTION FOR DIALYSIS CURRENT AND FUTURE END USER ANALYSIS, 2025–2034, (USD MILLION)
FIGURE 45 BRAZIL IT SOLUTION FOR DIALYSIS CURRENT AND FUTURE TYPE ANALYSIS, 2025–2034, (USD MILLION)
FIGURE 46 BRAZIL IT SOLUTION FOR DIALYSIS CURRENT AND FUTURE END USER ANALYSIS, 2025–2034, (USD MILLION)
FIGURE 47 ARGENTINA IT SOLUTION FOR DIALYSIS CURRENT AND FUTURE TYPE ANALYSIS, 2025–2034, (USD MILLION)
FIGURE 48 ARGENTINA IT SOLUTION FOR DIALYSIS CURRENT AND FUTURE END USER ANALYSIS, 2025–2034, (USD MILLION)
FIGURE 49 COLUMBIA IT SOLUTION FOR DIALYSIS CURRENT AND FUTURE TYPE ANALYSIS, 2025–2034, (USD MILLION)
FIGURE 50 COLUMBIA IT SOLUTION FOR DIALYSIS CURRENT AND FUTURE END USER ANALYSIS, 2025–2034, (USD MILLION)
FIGURE 51 REST OF LATIN AMERICA IT SOLUTION FOR DIALYSIS CURRENT AND FUTURE TYPE ANALYSIS, 2025–2034, (USD MILLION)
FIGURE 52 REST OF LATIN AMERICA IT SOLUTION FOR DIALYSIS CURRENT AND FUTURE END USER ANALYSIS, 2025–2034, (USD MILLION)
FIGURE 53 EASTERN EUROPE IT SOLUTION FOR DIALYSIS CURRENT AND FUTURE MARKET VOLUME SHARE REGIONAL ANALYSIS, 2025–2034, (USD MILLION)
FIGURE 54 POLAND IT SOLUTION FOR DIALYSIS CURRENT AND FUTURE TYPE ANALYSIS, 2025–2034, (USD MILLION)
FIGURE 55 POLAND IT SOLUTION FOR DIALYSIS CURRENT AND FUTURE END USER ANALYSIS, 2025–2034, (USD MILLION)
FIGURE 56 RUSSIA IT SOLUTION FOR DIALYSIS CURRENT AND FUTURE TYPE ANALYSIS, 2025–2034, (USD MILLION)
FIGURE 57 RUSSIA IT SOLUTION FOR DIALYSIS CURRENT AND FUTURE END USER ANALYSIS, 2025–2034, (USD MILLION)
FIGURE 58 CZECH REPUBLIC IT SOLUTION FOR DIALYSIS CURRENT AND FUTURE TYPE ANALYSIS, 2025–2034, (USD MILLION)
FIGURE 59 CZECH REPUBLIC IT SOLUTION FOR DIALYSIS CURRENT AND FUTURE END USER ANALYSIS, 2025–2034, (USD MILLION)
FIGURE 60 ROMANIA IT SOLUTION FOR DIALYSIS CURRENT AND FUTURE TYPE ANALYSIS, 2025–2034, (USD MILLION)
FIGURE 61 ROMANIA IT SOLUTION FOR DIALYSIS CURRENT AND FUTURE END USER ANALYSIS, 2025–2034, (USD MILLION)
FIGURE 62 REST OF EASTERN EUROPE IT SOLUTION FOR DIALYSIS CURRENT AND FUTURE TYPE ANALYSIS, 2025–2034, (USD MILLION)
FIGURE 63 REST OF EASTERN EUROPE IT SOLUTION FOR DIALYSIS CURRENT AND FUTURE END USER ANALYSIS, 2025–2034, (USD MILLION)
FIGURE 64 WESTERN EUROPE IT SOLUTION FOR DIALYSIS CURRENT AND FUTURE MARKET VOLUME SHARE REGIONAL ANALYSIS, 2025–2034, (USD MILLION)
FIGURE 65 GERMANY IT SOLUTION FOR DIALYSIS CURRENT AND FUTURE TYPE ANALYSIS, 2025–2034, (USD MILLION)
FIGURE 66 GERMANY IT SOLUTION FOR DIALYSIS CURRENT AND FUTURE END USER ANALYSIS, 2025–2034, (USD MILLION)
FIGURE 67 FRANCE IT SOLUTION FOR DIALYSIS CURRENT AND FUTURE TYPE ANALYSIS, 2025–2034, (USD MILLION)
FIGURE 68 FRANCE IT SOLUTION FOR DIALYSIS CURRENT AND FUTURE END USER ANALYSIS, 2025–2034, (USD MILLION)
FIGURE 69 UK IT SOLUTION FOR DIALYSIS CURRENT AND FUTURE TYPE ANALYSIS, 2025–2034, (USD MILLION)
FIGURE 70 UK IT SOLUTION FOR DIALYSIS CURRENT AND FUTURE END USER ANALYSIS, 2025–2034, (USD MILLION)
FIGURE 71 SPAIN IT SOLUTION FOR DIALYSIS CURRENT AND FUTURE TYPE ANALYSIS, 2025–2034, (USD MILLION)
FIGURE 72 SPAIN IT SOLUTION FOR DIALYSIS CURRENT AND FUTURE END USER ANALYSIS, 2025–2034, (USD MILLION)
FIGURE 73 ITALY IT SOLUTION FOR DIALYSIS CURRENT AND FUTURE TYPE ANALYSIS, 2025–2034, (USD MILLION)
FIGURE 74 ITALY IT SOLUTION FOR DIALYSIS CURRENT AND FUTURE END USER ANALYSIS, 2025–2034, (USD MILLION)
FIGURE 75 REST OF WESTERN EUROPE IT SOLUTION FOR DIALYSIS CURRENT AND FUTURE TYPE ANALYSIS, 2025–2034, (USD MILLION)
FIGURE 76 REST OF WESTERN EUROPE IT SOLUTION FOR DIALYSIS CURRENT AND FUTURE END USER ANALYSIS, 2025–2034, (USD MILLION)
FIGURE 77 EAST ASIA AND PACIFIC IT SOLUTION FOR DIALYSIS CURRENT AND FUTURE MARKET VOLUME SHARE REGIONAL ANALYSIS, 2025–2034, (USD MILLION)
FIGURE 78 CHINA IT SOLUTION FOR DIALYSIS CURRENT AND FUTURE TYPE ANALYSIS, 2025–2034, (USD MILLION)
FIGURE 79 CHINA IT SOLUTION FOR DIALYSIS CURRENT AND FUTURE END USER ANALYSIS, 2025–2034, (USD MILLION)
FIGURE 80 JAPAN IT SOLUTION FOR DIALYSIS CURRENT AND FUTURE TYPE ANALYSIS, 2025–2034, (USD MILLION)
FIGURE 81 JAPAN IT SOLUTION FOR DIALYSIS CURRENT AND FUTURE END USER ANALYSIS, 2025–2034, (USD MILLION)
FIGURE 82 AUSTRALIA IT SOLUTION FOR DIALYSIS CURRENT AND FUTURE TYPE ANALYSIS, 2025–2034, (USD MILLION)
FIGURE 83 AUSTRALIA IT SOLUTION FOR DIALYSIS CURRENT AND FUTURE END USER ANALYSIS, 2025–2034, (USD MILLION)
FIGURE 84 CAMBODIA IT SOLUTION FOR DIALYSIS CURRENT AND FUTURE TYPE ANALYSIS, 2025–2034, (USD MILLION)
FIGURE 85 CAMBODIA IT SOLUTION FOR DIALYSIS CURRENT AND FUTURE END USER ANALYSIS, 2025–2034, (USD MILLION)
FIGURE 86 FIJI IT SOLUTION FOR DIALYSIS CURRENT AND FUTURE TYPE ANALYSIS, 2025–2034, (USD MILLION)
FIGURE 87 FIJI IT SOLUTION FOR DIALYSIS CURRENT AND FUTURE END USER ANALYSIS, 2025–2034, (USD MILLION)
FIGURE 88 INDONESIA IT SOLUTION FOR DIALYSIS CURRENT AND FUTURE TYPE ANALYSIS, 2025–2034, (USD MILLION)
FIGURE 89 INDONESIA IT SOLUTION FOR DIALYSIS CURRENT AND FUTURE END USER ANALYSIS, 2025–2034, (USD MILLION)
FIGURE 90 SOUTH KOREA IT SOLUTION FOR DIALYSIS CURRENT AND FUTURE TYPE ANALYSIS, 2025–2034, (USD MILLION)
FIGURE 91 SOUTH KOREA IT SOLUTION FOR DIALYSIS CURRENT AND FUTURE END USER ANALYSIS, 2025–2034, (USD MILLION)
FIGURE 92 REST OF EAST ASIA AND PACIFIC IT SOLUTION FOR DIALYSIS CURRENT AND FUTURE TYPE ANALYSIS, 2025–2034, (USD MILLION)
FIGURE 93 REST OF EAST ASIA AND PACIFIC IT SOLUTION FOR DIALYSIS CURRENT AND FUTURE END USER ANALYSIS, 2025–2034, (USD MILLION)
FIGURE 94 SEA AND SOUTH ASIA IT SOLUTION FOR DIALYSIS CURRENT AND FUTURE MARKET VOLUME SHARE REGIONAL ANALYSIS, 2025–2034, (USD MILLION)
FIGURE 95 BANGLADESH IT SOLUTION FOR DIALYSIS CURRENT AND FUTURE TYPE ANALYSIS, 2025–2034, (USD MILLION)
FIGURE 96 BANGLADESH IT SOLUTION FOR DIALYSIS CURRENT AND FUTURE END USER ANALYSIS, 2025–2034, (USD MILLION)
FIGURE 97 NEW ZEALAND IT SOLUTION FOR DIALYSIS CURRENT AND FUTURE TYPE ANALYSIS, 2025–2034, (USD MILLION)
FIGURE 98 NEW ZEALAND IT SOLUTION FOR DIALYSIS CURRENT AND FUTURE END USER ANALYSIS, 2025–2034, (USD MILLION)
FIGURE 99 INDIA IT SOLUTION FOR DIALYSIS CURRENT AND FUTURE TYPE ANALYSIS, 2025–2034, (USD MILLION)
FIGURE 100 INDIA IT SOLUTION FOR DIALYSIS CURRENT AND FUTURE END USER ANALYSIS, 2025–2034, (USD MILLION)
FIGURE 101 SINGAPORE IT SOLUTION FOR DIALYSIS CURRENT AND FUTURE TYPE ANALYSIS, 2025–2034, (USD MILLION)
FIGURE 102 SINGAPORE IT SOLUTION FOR DIALYSIS CURRENT AND FUTURE END USER ANALYSIS, 2025–2034, (USD MILLION)
FIGURE 103 THAILAND IT SOLUTION FOR DIALYSIS CURRENT AND FUTURE TYPE ANALYSIS, 2025–2034, (USD MILLION)
FIGURE 104 THAILAND IT SOLUTION FOR DIALYSIS CURRENT AND FUTURE END USER ANALYSIS, 2025–2034, (USD MILLION)
FIGURE 105 TAIWAN IT SOLUTION FOR DIALYSIS CURRENT AND FUTURE TYPE ANALYSIS, 2025–2034, (USD MILLION)
FIGURE 106 TAIWAN IT SOLUTION FOR DIALYSIS CURRENT AND FUTURE END USER ANALYSIS, 2025–2034, (USD MILLION)
FIGURE 107 MALAYSIA IT SOLUTION FOR DIALYSIS CURRENT AND FUTURE TYPE ANALYSIS, 2025–2034, (USD MILLION)
FIGURE 108 MALAYSIA IT SOLUTION FOR DIALYSIS CURRENT AND FUTURE END USER ANALYSIS, 2025–2034, (USD MILLION)
FIGURE 109 REST OF SEA AND SOUTH ASIA IT SOLUTION FOR DIALYSIS CURRENT AND FUTURE TYPE ANALYSIS, 2025–2034, (USD MILLION)
FIGURE 110 REST OF SEA AND SOUTH ASIA IT SOLUTION FOR DIALYSIS CURRENT AND FUTURE END USER ANALYSIS, 2025–2034, (USD MILLION)
FIGURE 111 MIDDLE EAST AND AFRICA IT SOLUTION FOR DIALYSIS CURRENT AND FUTURE MARKET VOLUME SHARE REGIONAL ANALYSIS, 2025–2034, (USD MILLION)
FIGURE 112 GCC COUNTRIES IT SOLUTION FOR DIALYSIS CURRENT AND FUTURE TYPE ANALYSIS, 2025–2034, (USD MILLION)
FIGURE 113 GCC COUNTRIES IT SOLUTION FOR DIALYSIS CURRENT AND FUTURE END USER ANALYSIS, 2025–2034, (USD MILLION)
FIGURE 114 SAUDI ARABIA IT SOLUTION FOR DIALYSIS CURRENT AND FUTURE TYPE ANALYSIS, 2025–2034, (USD MILLION)
FIGURE 115 SAUDI ARABIA IT SOLUTION FOR DIALYSIS CURRENT AND FUTURE END USER ANALYSIS, 2025–2034, (USD MILLION)
FIGURE 116 UAE IT SOLUTION FOR DIALYSIS CURRENT AND FUTURE TYPE ANALYSIS, 2025–2034, (USD MILLION)
FIGURE 117 UAE IT SOLUTION FOR DIALYSIS CURRENT AND FUTURE END USER ANALYSIS, 2025–2034, (USD MILLION)
FIGURE 118 BAHRAIN IT SOLUTION FOR DIALYSIS CURRENT AND FUTURE TYPE ANALYSIS, 2025–2034, (USD MILLION)
FIGURE 119 BAHRAIN IT SOLUTION FOR DIALYSIS CURRENT AND FUTURE END USER ANALYSIS, 2025–2034, (USD MILLION)
FIGURE 120 KUWAIT IT SOLUTION FOR DIALYSIS CURRENT AND FUTURE TYPE ANALYSIS, 2025–2034, (USD MILLION)
FIGURE 121 KUWAIT IT SOLUTION FOR DIALYSIS CURRENT AND FUTURE END USER ANALYSIS, 2025–2034, (USD MILLION)
FIGURE 122 OMAN IT SOLUTION FOR DIALYSIS CURRENT AND FUTURE TYPE ANALYSIS, 2025–2034, (USD MILLION)
FIGURE 123 OMAN IT SOLUTION FOR DIALYSIS CURRENT AND FUTURE END USER ANALYSIS, 2025–2034, (USD MILLION)
FIGURE 124 QATAR IT SOLUTION FOR DIALYSIS CURRENT AND FUTURE TYPE ANALYSIS, 2025–2034, (USD MILLION)
FIGURE 125 QATAR IT SOLUTION FOR DIALYSIS CURRENT AND FUTURE END USER ANALYSIS, 2025–2034, (USD MILLION)
FIGURE 126 EGYPT IT SOLUTION FOR DIALYSIS CURRENT AND FUTURE TYPE ANALYSIS, 2025–2034, (USD MILLION)
FIGURE 127 EGYPT IT SOLUTION FOR DIALYSIS CURRENT AND FUTURE END USER ANALYSIS, 2025–2034, (USD MILLION)
FIGURE 128 NIGERIA IT SOLUTION FOR DIALYSIS CURRENT AND FUTURE TYPE ANALYSIS, 2025–2034, (USD MILLION)
FIGURE 129 NIGERIA IT SOLUTION FOR DIALYSIS CURRENT AND FUTURE END USER ANALYSIS, 2025–2034, (USD MILLION)
FIGURE 130 SOUTH AFRICA IT SOLUTION FOR DIALYSIS CURRENT AND FUTURE TYPE ANALYSIS, 2025–2034, (USD MILLION)
FIGURE 131 SOUTH AFRICA IT SOLUTION FOR DIALYSIS CURRENT AND FUTURE END USER ANALYSIS, 2025–2034, (USD MILLION)
FIGURE 132 ISRAEL IT SOLUTION FOR DIALYSIS CURRENT AND FUTURE TYPE ANALYSIS, 2025–2034, (USD MILLION)
FIGURE 133 ISRAEL IT SOLUTION FOR DIALYSIS CURRENT AND FUTURE END USER ANALYSIS, 2025–2034, (USD MILLION)
FIGURE 134 REST OF MEA IT SOLUTION FOR DIALYSIS CURRENT AND FUTURE TYPE ANALYSIS, 2025–2034, (USD MILLION)
FIGURE 135 REST OF MEA IT SOLUTION FOR DIALYSIS CURRENT AND FUTURE END USER ANALYSIS, 2025–2034, (USD MILLION)
FIGURE 136 U. S. MARKET SHARE ANALYSIS BY TYPE (2024)
FIGURE 137 U. S. MARKET SHARE ANALYSIS BY END USER (2024)
FIGURE 138 CANADA MARKET SHARE ANALYSIS BY TYPE (2024)
FIGURE 139 CANADA MARKET SHARE ANALYSIS BY END USER (2024)
FIGURE 140 MEXICO MARKET SHARE ANALYSIS BY TYPE (2024)
FIGURE 141 MEXICO MARKET SHARE ANALYSIS BY END USER (2024)
FIGURE 142 CHINA MARKET SHARE ANALYSIS BY TYPE (2024)
FIGURE 143 CHINA MARKET SHARE ANALYSIS BY END USER (2024)
FIGURE 144 JAPAN MARKET SHARE ANALYSIS BY TYPE (2024)
FIGURE 145 JAPAN MARKET SHARE ANALYSIS BY END USER (2024)
FIGURE 146 INDIA MARKET SHARE ANALYSIS BY TYPE (2024)
FIGURE 147 INDIA MARKET SHARE ANALYSIS BY END USER (2024)
FIGURE 148 SOUTH KOREA MARKET SHARE ANALYSIS BY TYPE (2024)
FIGURE 149 SOUTH KOREA MARKET SHARE ANALYSIS BY END USER (2024)
FIGURE 150 SAUDI ARABIA MARKET SHARE ANALYSIS BY TYPE (2024)
FIGURE 151 SAUDI ARABIA MARKET SHARE ANALYSIS BY END USER (2024)
FIGURE 152 UAE MARKET SHARE ANALYSIS BY TYPE (2024)
FIGURE 153 UAE MARKET SHARE ANALYSIS BY END USER (2024)
FIGURE 154 EGYPT MARKET SHARE ANALYSIS BY TYPE (2024)
FIGURE 155 EGYPT MARKET SHARE ANALYSIS BY END USER (2024)
FIGURE 156 NIGERIA MARKET SHARE ANALYSIS BY TYPE (2024)
FIGURE 157 NIGERIA MARKET SHARE ANALYSIS BY END USER (2024)
FIGURE 158 SOUTH AFRICA MARKET SHARE ANALYSIS BY TYPE (2024)
FIGURE 159 SOUTH AFRICA MARKET SHARE ANALYSIS BY END USER (2024)
FIGURE 160 GERMANY MARKET SHARE ANALYSIS BY TYPE (2024)
FIGURE 161 GERMANY MARKET SHARE ANALYSIS BY END USER (2024)
FIGURE 162 FRANCE MARKET SHARE ANALYSIS BY TYPE (2024)
FIGURE 163 FRANCE MARKET SHARE ANALYSIS BY END USER (2024)
FIGURE 164 UK MARKET SHARE ANALYSIS BY TYPE (2024)
FIGURE 165 UK MARKET SHARE ANALYSIS BY END USER (2024)
FIGURE 166 SPAIN MARKET SHARE ANALYSIS BY TYPE (2024)
FIGURE 167 SPAIN MARKET SHARE ANALYSIS BY END USER (2024)
FIGURE 168 ITALY MARKET SHARE ANALYSIS BY TYPE (2024)
FIGURE 169 ITALY MARKET SHARE ANALYSIS BY END USER (2024)
FIGURE 170 BRAZIL MARKET SHARE ANALYSIS BY TYPE (2024)
FIGURE 171 BRAZIL MARKET SHARE ANALYSIS BY END USER (2024)
FIGURE 172 ARGENTINA MARKET SHARE ANALYSIS BY TYPE (2024)
FIGURE 173 ARGENTINA MARKET SHARE ANALYSIS BY END USER (2024)
FIGURE 174 COLUMBIA MARKET SHARE ANALYSIS BY TYPE (2024)
FIGURE 175 COLUMBIA MARKET SHARE ANALYSIS BY END USER (2024)
FIGURE 176 GLOBAL IT SOLUTION FOR DIALYSIS CURRENT AND FUTURE MARKET KEY COUNTRY LEVEL ANALYSIS, 2024–2034, (USD MILLION)
FIGURE 177 FINANCIAL OVERVIEW:
Key Player Analysis
Fresenius Medical Care: Fresenius Medical Care remains the market leader in dialysis IT solutions, with a global footprint spanning over 120 countries and direct control of more than 4,000 dialysis clinics. The company’s IT portfolio includes patient management platforms, electronic health record systems, and analytics tools designed specifically for nephrology care. Through its subsidiary Acumen Physician Solutions, Fresenius continues to advance its Acumen 2.0 platform, co-developed with Epic Systems, which supports both EHR and practice management functions for dialysis providers.
In 2025, Fresenius is focusing on cloud transition and AI-enabled diagnostics to reduce hospitalizations and streamline patient outcomes. The company allocates approximately 6% of its annual revenue, which exceeded USD 20 billion in 2024, to R&D—targeting predictive analytics and real-time monitoring capabilities. Its scale, integration with clinical operations, and end-to-end dialysis expertise position Fresenius as a high-barrier incumbent with unmatched data access and user base strength across North America and Europe.
CitiusTech: CitiusTech operates as a key challenger in the IT solution for dialysis space, known for its strong healthcare technology consulting and product development services. The company’s digital health platforms integrate data from dialysis machines, patient monitoring systems, and lab systems, enabling actionable insights and seamless interoperability. Its HealthEdge platform supports payer-provider data integration, while BI-Clinical has been adapted for use in specialty care environments, including dialysis.
Strategically, CitiusTech has expanded its footprint through partnerships with leading health systems and medical device manufacturers. In 2025, the company is prioritizing AI-powered population health tools and remote monitoring solutions tailored to chronic disease management. With clients in over 30 countries and consistent double-digit annual growth, CitiusTech’s strength lies in agile delivery, modular platforms, and customization capabilities that serve both enterprise providers and regional clinics.
B. Braun: B. Braun positions itself as a strong niche player, focusing on dialysis consumables and integrated therapy systems, while steadily building its IT infrastructure offerings. Through its Dialog+ platform, B. Braun provides digital interfaces that link dialysis machines with clinical software, allowing for centralized treatment planning, session documentation, and parameter tracking. While traditionally product-focused, B. Braun is expanding its IT capabilities to support growing demand for connected care in Europe and Asia.
In 2025, B. Braun is investing in middleware and interface development that enhances compatibility between its hardware and third-party EHR systems. Its emphasis on safety standards, usability, and regulatory compliance makes it a preferred partner in public healthcare settings. Though not a pure-play IT vendor, B. Braun’s equipment-software integration differentiates it in bundled offerings and positions it to capture value in hybrid treatment environments.
QuantumSys Technologies: QuantumSys Technologies is an emerging innovator in the dialysis IT landscape, targeting mid-sized providers with cloud-first platforms and AI-backed analytics. The company specializes in modular software for patient scheduling, treatment monitoring, and regulatory reporting. Its QuantumDx suite is designed for remote dialysis centers and home-based treatment environments, offering predictive risk scoring and integrated telehealth support.
In 2025, QuantumSys is gaining traction in Southeast Asia and the Middle East through strategic reseller agreements and public-private pilot programs. The company differentiates itself through pricing flexibility, rapid deployment timelines, and native cloud infrastructure. While still scaling its presence, QuantumSys is capturing attention as a disruptor with niche focus and strong alignment with the growing demand for decentralized, low-footprint IT solutions in underpenetrated markets.
Market Key Players
Gaia Software
Fresenius Medical Care
CureMD Healthcare
Renalyx
CitiusTech
Visonex
Constellation Kidney Group
B.Braun
Document Storage Systems
Sagekey Software
iSalus Healthcare
Aithent
M Dialysis
Renesan Software
QuantumSys Technologies
Driver:
Rising Dialysis Burden Accelerating Demand for Digital Care Platforms
As of 2025, the global dialysis population continues to grow due to rising rates of chronic kidney disease, diabetes, and hypertension. Over 3.9 million patients now undergo regular dialysis, driving sustained demand for robust IT systems that streamline treatment management and patient monitoring. Hospitals and dialysis centers are prioritizing digital platforms to handle complex clinical workflows and ensure continuity of care. Integration with EHRs, telehealth, and real-time data capture is becoming standard across leading providers. This shift is accelerating IT adoption, particularly in high-volume centers where manual processes no longer meet operational demands.
Growing Need for Interoperable Systems to Optimize Nephrology Workflows
In parallel, the need for interoperable platforms that can consolidate lab reports, treatment records, and patient histories is gaining urgency. Providers seek integrated IT frameworks that support clinical decision-making, reduce errors, and meet regulatory compliance. Strategic collaborations between technology vendors and healthcare operators—such as the Epic-Acumen partnership—underscore the market’s direction toward customized nephrology software, improving data flow and care delivery in dialysis networks.
Restraint:
High Upfront Investment Costs Limiting IT Adoption in Dialysis Centers
Despite growing demand, high upfront costs remain a major barrier to IT adoption in dialysis care, especially for small- and mid-sized clinics. Capital investment in hardware, software, training, and infrastructure can reach over USD 35,000 per full-time staff member. In resource-limited settings, this financial burden often delays deployment. Additionally, implementation disrupts existing workflows and can cause short-term revenue losses due to productivity drops during the transition period.
Escalating Data Security Risks Restricting Digital Transformation
Data security is another critical concern. With patient records increasingly digitized, healthcare providers face heightened risks of cyberattacks and data breaches. Maintaining compliance with global data protection laws adds further complexity and cost. These challenges limit IT solution penetration in underfunded regions and raise risk thresholds for investors and vendors alike.
Opportunity:
Emerging Markets Offering Strong Growth Potential for Dialysis IT Solutions
The market presents strong expansion potential in emerging economies, particularly in Asia Pacific, Latin America, and parts of the Middle East. These regions are experiencing a rapid rise in dialysis demand due to demographic shifts and growing healthcare access. By 2030, Asia Pacific alone is expected to account for over 40% of the global dialysis population. Providers entering these markets with region-specific, cost-effective IT solutions can gain early-mover advantages.
Interoperability Becoming a Strategic Differentiator for Technology Vendors
Another significant opportunity lies in interoperability. Healthcare systems increasingly demand IT solutions that integrate seamlessly with existing infrastructure, enabling real-time data exchange across departments and providers. Vendors that offer plug-and-play compatibility with major EHRs, laboratory systems, and treatment machines are likely to gain traction. This positions interoperability not just as a technical requirement, but a strategic differentiator in procurement decisions.
Trend:
Cloud-Based Deployments Reshaping Dialysis IT Infrastructure
Cloud-based deployment continues to reshape the dialysis IT landscape. In 2025, cloud platforms support more than 35% of new IT installations in dialysis centers worldwide. These systems offer lower maintenance costs, faster scalability, and remote access—features that align with the shift toward decentralized and home-based dialysis. Providers are increasingly transitioning from legacy on-premise solutions to cloud environments to enhance service flexibility and reduce IT overhead.
AI-Driven Predictive Analytics Transforming Clinical Decision Support
Simultaneously, artificial intelligence is transforming how patient data is used. AI algorithms now assist in identifying early warning signs of complications, predicting patient deterioration, and optimizing treatment schedules. Predictive analytics tools are being embedded into dialysis IT platforms to support clinical decisions and reduce emergency interventions. This trend is shaping a competitive edge for vendors who can offer AI-powered features backed by real-world clinical performance.
Recent Developments
Dec 2024 – Fresenius Medical Care: Fresenius launched its AI-powered clinical decision support module within Acumen 2.0, designed to reduce hospitalization risks by analyzing real-time patient data. The update is now deployed across 750 clinics in North America. This strengthens the company’s lead in AI-integrated dialysis IT platforms and enhances clinical outcomes tracking.
Feb 2025 – CitiusTech: CitiusTech signed a strategic partnership with a leading APAC healthcare system to deploy its BI-Clinical platform across 120 dialysis centers in India and Indonesia. The deal, valued at approximately USD 18 million, enables real-time reporting and data governance compliance across the network. This move expands CitiusTech’s footprint in high-growth, underpenetrated regions.
Apr 2025 – B. Braun: B. Braun introduced its new middleware suite, Dialog Connect, aimed at enhancing interoperability between its dialysis hardware and third-party EHR systems. The platform supports HL7 and FHIR standards and is expected to be rolled out in over 300 European clinics by year-end. This reinforces B. Braun’s position as a bundled solution provider and enhances system compatibility for public sector clients.
Jul 2025 – QuantumSys Technologies: QuantumSys announced its entry into the Latin American market through a government-backed pilot in Brazil involving 45 rural dialysis centers. The deployment of its QuantumDx cloud platform includes AI-based patient risk scoring and mobile access for care teams. This development marks a key milestone in the company’s global expansion strategy and highlights its alignment with remote care initiatives.
Sep 2025 – Baxter International: Baxter entered the dialysis IT space through the acquisition of a healthtech startup specializing in cloud-based care coordination tools. The deal, estimated at over USD 65 million, will integrate real-time treatment planning features into Baxter’s home dialysis solutions. This positions Baxter as a new competitor in IT-enabled dialysis services and strengthens its portfolio in decentralized care.