Global Knee Hyaluronic Acid Injections Market Size | CAGR of 5.6%
Global Knee Hyaluronic Acid Injections Market Size, Share, and In-Depth Analysis By Product Type (Single Injection, Three Injection, Five Injection), By End-Use (Hospitals, Orthopedic Clinics, Ambulatory Surgical Centers), By Application (Osteoarthritis, Cartilage Repair, Other Knee Joint Disorders), Industry Region & Key Players, Market Dynamics, Pricing Analysis, Competitive Strategies, Clinical Trends & Forecast 2025–2034
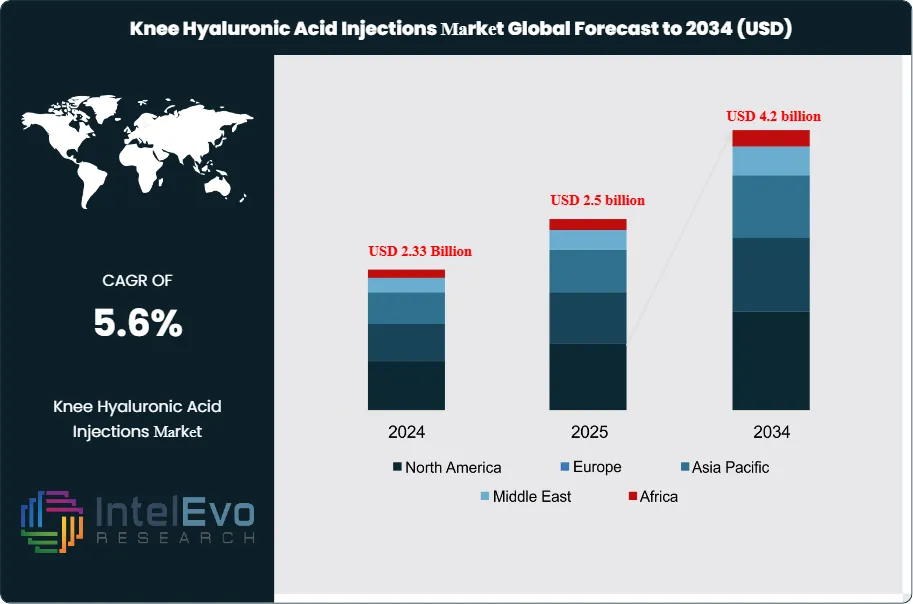
The Knee Hyaluronic Acid Injections Market is estimated to reach approximately USD 2.5 billion in 2025 and is projected to grow steadily to around USD 4.2 billion by 2034. Based on an estimated USD 2.6 billion market size in 2026, the market is expected to register a compound annual growth rate (CAGR) of about 5.6% during the forecast period from 2026 to 2034. This growth is primarily driven by the rising prevalence of knee osteoarthritis, an expanding aging population, and increasing preference for minimally invasive, non-surgical treatment options. In addition, growing awareness among patients and physicians, along with advancements in viscosupplementation formulations that offer longer-lasting pain relief, continue to support sustained market demand and visibility across global healthcare platforms.
This expansion reflects sustained demand for non-surgical interventions for osteoarthritis as health systems seek to delay or reduce the need for total knee replacement. In 2023, the market stood at about USD 2.2 billion, underscoring steady growth momentum into the current forecast period.
Demand rises as osteoarthritis prevalence climbs, particularly in aging populations and among individuals with obesity and joint trauma. More than 32 million adults in the United States live with osteoarthritis, and knee involvement represents a significant share of these cases. Patients and clinicians increasingly prefer viscosupplementation as an intermediate option between oral therapies and invasive surgery, supporting procedure volumes in hospital outpatient departments and orthopedic clinics. Growing awareness of quality-of-life impacts and earlier diagnosis further lift case identification and treatment rates.
On the supply side, global and regional manufacturers compete on formulation performance, injection schedules, and price. Leading companies together account for an estimated 45–50% of global revenue, while a long tail of regional players serves local markets through partnerships and licensing agreements. Vendors expand portfolios from single-injection to multi-injection regimens and explore combinations with corticosteroids to extend symptom relief. Capacity expansions in Asia and contract manufacturing in cost-competitive locations help suppliers manage margin pressure as payers tighten reimbursement.
Regulation shapes market access and development timelines. The U.S. Food and Drug Administration and comparable agencies in Europe and Asia enforce rigorous standards for safety, efficacy, and labeling, which elevate development costs but protect clinical outcomes. Healthcare spending, which represented roughly 17–18% of U.S. GDP in 2020, sustains payer budgets for osteoarthritis care, though reimbursement reviews and pricing negotiations introduce policy risk. Changes in clinical guidelines or safety signals could alter utilization patterns, particularly where payers favor alternative pain therapies.
Technology and digitalization begin to influence clinical decision-making and product life-cycle management. Providers adopt imaging-guided injection techniques to improve accuracy, while AI-enabled tools analyze electronic health records to identify candidates likely to respond to viscosupplementation. Automated fill-finish lines and digital quality systems enhance manufacturing efficiency and compliance. Regionally, North America holds around 38% of 2024 revenue, Europe contributes about 30%, and Asia-Pacific delivers the fastest growth, with a projected CAGR above 6.5% as China, India, and Southeast Asia expand access to osteoarthritis care. Emerging opportunities in Latin America and the Middle East and Africa focus on private hospitals, specialty orthopedic centers, and value-segment products.
Key Takeaways
Market Growth: The market grows from 2.2 billion USD, 2023 to estimated: USD 2.5 billion in 2025 and is projected to reach USD 4.2 billion, 2034, delivering a CAGR of 5.6%, 2026-2034.
Segment Dominance: The three-injection product segment leads the portfolio, capturing 41.0% of global revenue, 2024, while alternative regimens hold the remaining estimated: 59.0% share, 2024.
Segment Dominance: Hospitals account for 56.0% of procedure volume, 2024, while orthopedic clinics and ambulatory surgical centers together manage the remaining estimated: 44.0% of cases, 2024. Within indications, osteoarthritis holds 44.0% of market revenue, 2024 and remains the primary clinical focus.
Driver: Rising osteoarthritis prevalence, with an estimated: 35.0 million patients worldwide, 2024 and a strong preference for non-surgical pain relief drive steady market expansion at a 5.2% CAGR, 2024-2034.
Restraint: Stringent regulatory review cycles and reimbursement controls limit faster acceleration, with an estimated: 12.0% of claims, 2024 facing coverage restrictions or step-therapy requirements.
Opportunity: Asia-Pacific presents an attractive expansion runway, with revenue expected to rise from estimated: 0.5 billion USD, 2024 to estimated: 1.0 billion USD, 2034 at a projected CAGR of 6.8%, 2024-2034 as access and diagnosis rates improve.
Trend: Providers increasingly shift interventions from inpatient theaters to outpatient and day-care settings, where hospitals, clinics, and ambulatory centers already handle over 80.0% of procedures, 2024, reducing cost per case by an estimated: 10.0%, 2024.
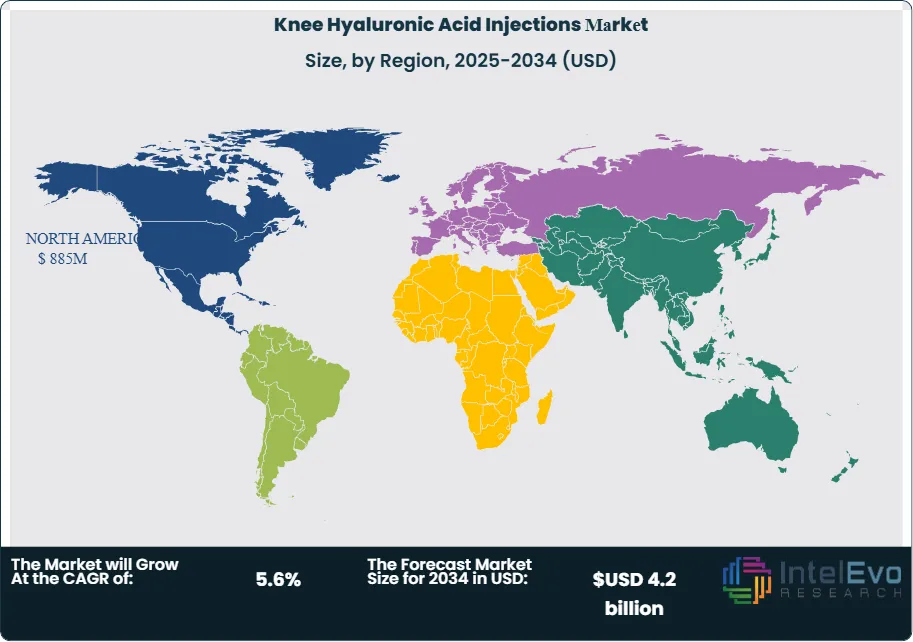
Regional Analysis: North America leads with a 37.8% revenue share, 2024 equating to 0.83 billion USD, 2024, followed by Europe at an estimated: 30.0% share, 2024, while Asia-Pacific grows fastest at an estimated CAGR of 6.8%, 2024-2034 and Latin America plus the Middle East and Africa together approach estimated: 0.6 billion USD, 2034.
By Product
The product mix in the knee hyaluronic acid injections market continues to shift in 2025 as healthcare providers seek treatment formats that reduce patient visits while maintaining clinical outcomes. Single-injection products show strong adoption as they shorten procedure time and appeal to patients who want fewer appointments. Many health systems report rising use of single-dose formats in 2024 and 2025 as outpatient volumes increase. The segment maintains momentum as suppliers improve viscosity profiles and extend durability.
Three-injection products remain the largest segment, accounting for more than 41 percent of global volume in the latest assessment year. Providers continue to rely on this regimen because it balances convenience with sustained symptom control. Clinical data published between 2022 and 2024 strengthened confidence in multi-dose protocols for moderate osteoarthritis, which has helped preserve their leadership position.
Five-injection regimens serve a narrower but clinically important patient group. Specialists often choose this approach for advanced degenerative cases that require longer therapeutic coverage. Although the segment remains smaller than the others, demand is stable. Clinical trials planned for 2025 focus on extending pain-relief intervals, which could influence future adoption. Overall, product innovation and growing osteoarthritis prevalence among adults over 60 continue to support a steady expansion trajectory for all treatment formats.
By Application
Osteoarthritis continues to account for the bulk of procedure demand in 2025, holding more than 44 percent of global market share. Rising diagnosis rates and earlier clinical intervention support ongoing use of viscosupplementation as a preferred non-surgical option. Providers report that patient preference for injectable therapies has increased as awareness of joint-preservation approaches improves.
The cartilage repair segment maintains a meaningful share as specialists integrate hyaluronic acid into broader regenerative treatment plans. Adoption has strengthened in orthopedic centers that combine injections with biologics, physical therapy, or minimally invasive surgery. Studies tracking cartilage health outcomes have expanded interest across Asia and Europe.
Other knee joint disorders, including ligament injury-related degeneration and inflammatory conditions, represent a smaller but steadily growing category. These applications highlight the flexibility of hyaluronic acid formulations in addressing pain and mobility concerns across a varied patient population. Continued research through 2025 is expected to widen clinical indications, gradually increasing the contribution of these secondary segments.
By End-Use
Hospitals remain the primary channel for knee hyaluronic acid injections in 2025, representing more than 56 percent of global utilization. Their dominance reflects broader access to imaging tools, specialist teams, and reimbursement frameworks that support high patient throughput. Systems in North America, Europe, and large Asian metros continue to prioritize outpatient musculoskeletal services, helping maintain high injection volumes.
Orthopedic clinics account for the second-largest share. They attract patients seeking specialized musculoskeletal care and faster scheduling. Clinics in the United States, Japan, Germany, and South Korea report stable year-over-year growth as early-stage osteoarthritis cases shift toward non-surgical management.
Ambulatory surgical centers show rising activity as health systems move routine procedures into cost-efficient outpatient environments. ASCs report steady growth in procedure counts, with adoption highest in the United States and Canada. The “others” category includes rehabilitation centers and multi-specialty outpatient networks, which continue to expand access as payers promote lower-cost care settings.
By Region
North America maintains the largest share in 2025, supported by advanced clinical infrastructure and a high documented prevalence of osteoarthritis. The United States alone reports more than 32 million adults with the condition. These figures, combined with broad insurance coverage, keep the region above 37 percent of global revenue.
Europe follows with strong participation driven by aging populations in Germany, France, Italy, and the United Kingdom. National health systems continue to expand treatment pathways for joint-degeneration conditions, which helps sustain stable demand. Adoption levels remain high in Western Europe as clinicians integrate viscosupplementation into broader pain-management programs.
Asia Pacific is the fastest-growing regional market. China, India, South Korea, and Japan report rising case volumes due to expanding older populations and improved diagnostic access. Health systems are increasing investment in orthopedic care, creating long-term opportunities for suppliers. Latin America and the Middle East & Africa show gradual progress as healthcare spending increases and awareness of non-surgical treatment options improves. Rising use of outpatient centers in Brazil, Mexico, Saudi Arabia, and the UAE supports moderate but steady market expansion.
Customization for segments, region/country-level will be provided. Moreover, additional customization can be done based on the requirements.
Pricing and Purchase Options
Avail customized purchase options to meet your exact research needs. We have three licenses to opt for: Single User License, Multi-User License (Up to 5 Users), Corporate Use License (Unlimited User and Printable PDF).
TABLE OF CONTENTS
1. EXECUTIVE SUMMARY
1.1. MARKET SNAPSHOT
1.2. KEY FINDINGS & INSIGHTS
1.3. ANALYST RECOMMENDATIONS
1.4. FUTURE OUTLOOK
2. RESEARCH METHODOLOGY
2.1. MARKET DEFINITION & SCOPE
2.2. RESEARCH OBJECTIVES: PRIMARY & SECONDARY DATA SOURCES
2.3. DATA COLLECTION SOURCES
2.3.1. COVERAGE OF 100+ PRIMARY RESEARCH/CONSULTATION CALLS WITH INDUSTRY STAKEHOLDERS
FIGURE 17 NORTH AMERICA KNEE HYALURONIC ACID INJECTIONS CURRENT AND FUTURE TYPE ANALYSIS, 2025–2034, (USD MILLION)
FIGURE 18 NORTH AMERICA KNEE HYALURONIC ACID INJECTIONS CURRENT AND FUTURE END USER ANALYSIS, 2025–2034, (USD MILLION)
FIGURE 19 MARKET SHARE BY COUNTRY
FIGURE 20 LATIN AMERICA KNEE HYALURONIC ACID INJECTIONS CURRENT AND FUTURE TYPE ANALYSIS, 2025–2034, (USD MILLION)
FIGURE 21 LATIN AMERICA KNEE HYALURONIC ACID INJECTIONS CURRENT AND FUTURE END USER ANALYSIS, 2025–2034, (USD MILLION)
FIGURE 22 MARKET SHARE BY COUNTRY
FIGURE 23 EASTERN EUROPE KNEE HYALURONIC ACID INJECTIONS CURRENT AND FUTURE TYPE ANALYSIS, 2025–2034, (USD MILLION)
FIGURE 24 EASTERN EUROPE KNEE HYALURONIC ACID INJECTIONS CURRENT AND FUTURE END USER ANALYSIS, 2025–2034, (USD MILLION)
FIGURE 25 MARKET SHARE BY COUNTRY
FIGURE 26 WESTERN EUROPE KNEE HYALURONIC ACID INJECTIONS CURRENT AND FUTURE TYPE ANALYSIS, 2025–2034, (USD MILLION)
FIGURE 27 WESTERN EUROPE KNEE HYALURONIC ACID INJECTIONS CURRENT AND FUTURE END USER ANALYSIS, 2025–2034, (USD MILLION)
FIGURE 28 MARKET SHARE BY COUNTRY
FIGURE 29 EAST ASIA AND PACIFIC KNEE HYALURONIC ACID INJECTIONS CURRENT AND FUTURE TYPE ANALYSIS, 2025–2034, (USD MILLION)
FIGURE 30 EAST ASIA AND PACIFIC KNEE HYALURONIC ACID INJECTIONS CURRENT AND FUTURE END USER ANALYSIS, 2025–2034, (USD MILLION)
FIGURE 31 MARKET SHARE BY COUNTRY
FIGURE 32 SEA AND SOUTH ASIA KNEE HYALURONIC ACID INJECTIONS CURRENT AND FUTURE TYPE ANALYSIS, 2025–2034, (USD MILLION)
FIGURE 33 SEA AND SOUTH ASIA KNEE HYALURONIC ACID INJECTIONS CURRENT AND FUTURE END USER ANALYSIS, 2025–2034, (USD MILLION)
FIGURE 34 MARKET SHARE BY COUNTRY
FIGURE 35 MIDDLE EAST AND AFRICA KNEE HYALURONIC ACID INJECTIONS CURRENT AND FUTURE TYPE ANALYSIS, 2025–2034, (USD MILLION)
FIGURE 36 MIDDLE EAST AND AFRICA KNEE HYALURONIC ACID INJECTIONS CURRENT AND FUTURE END USER ANALYSIS, 2025–2034, (USD MILLION)
FIGURE 37 NORTH AMERICA KNEE HYALURONIC ACID INJECTIONS CURRENT AND FUTURE MARKET VOLUME SHARE REGIONAL ANALYSIS, 2025–2034, (USD MILLION)
FIGURE 38 U.S. KNEE HYALURONIC ACID INJECTIONS CURRENT AND FUTURE TYPE ANALYSIS, 2025–2034, (USD MILLION)
FIGURE 39 U.S. KNEE HYALURONIC ACID INJECTIONS CURRENT AND FUTURE END USER ANALYSIS, 2025–2034, (USD MILLION)
FIGURE 40 CANADA KNEE HYALURONIC ACID INJECTIONS CURRENT AND FUTURE TYPE ANALYSIS, 2025–2034, (USD MILLION)
FIGURE 41 CANADA KNEE HYALURONIC ACID INJECTIONS CURRENT AND FUTURE END USER ANALYSIS, 2025–2034, (USD MILLION)
FIGURE 42 LATIN AMERICA KNEE HYALURONIC ACID INJECTIONS CURRENT AND FUTURE MARKET VOLUME SHARE REGIONAL ANALYSIS, 2025–2034, (USD MILLION)
FIGURE 43 MEXICO KNEE HYALURONIC ACID INJECTIONS CURRENT AND FUTURE TYPE ANALYSIS, 2025–2034, (USD MILLION)
FIGURE 44 MEXICO KNEE HYALURONIC ACID INJECTIONS CURRENT AND FUTURE END USER ANALYSIS, 2025–2034, (USD MILLION)
FIGURE 45 BRAZIL KNEE HYALURONIC ACID INJECTIONS CURRENT AND FUTURE TYPE ANALYSIS, 2025–2034, (USD MILLION)
FIGURE 46 BRAZIL KNEE HYALURONIC ACID INJECTIONS CURRENT AND FUTURE END USER ANALYSIS, 2025–2034, (USD MILLION)
FIGURE 47 ARGENTINA KNEE HYALURONIC ACID INJECTIONS CURRENT AND FUTURE TYPE ANALYSIS, 2025–2034, (USD MILLION)
FIGURE 48 ARGENTINA KNEE HYALURONIC ACID INJECTIONS CURRENT AND FUTURE END USER ANALYSIS, 2025–2034, (USD MILLION)
FIGURE 49 COLUMBIA KNEE HYALURONIC ACID INJECTIONS CURRENT AND FUTURE TYPE ANALYSIS, 2025–2034, (USD MILLION)
FIGURE 50 COLUMBIA KNEE HYALURONIC ACID INJECTIONS CURRENT AND FUTURE END USER ANALYSIS, 2025–2034, (USD MILLION)
FIGURE 51 REST OF LATIN AMERICA KNEE HYALURONIC ACID INJECTIONS CURRENT AND FUTURE TYPE ANALYSIS, 2025–2034, (USD MILLION)
FIGURE 52 REST OF LATIN AMERICA KNEE HYALURONIC ACID INJECTIONS CURRENT AND FUTURE END USER ANALYSIS, 2025–2034, (USD MILLION)
FIGURE 53 EASTERN EUROPE KNEE HYALURONIC ACID INJECTIONS CURRENT AND FUTURE MARKET VOLUME SHARE REGIONAL ANALYSIS, 2025–2034, (USD MILLION)
FIGURE 54 POLAND KNEE HYALURONIC ACID INJECTIONS CURRENT AND FUTURE TYPE ANALYSIS, 2025–2034, (USD MILLION)
FIGURE 55 POLAND KNEE HYALURONIC ACID INJECTIONS CURRENT AND FUTURE END USER ANALYSIS, 2025–2034, (USD MILLION)
FIGURE 56 RUSSIA KNEE HYALURONIC ACID INJECTIONS CURRENT AND FUTURE TYPE ANALYSIS, 2025–2034, (USD MILLION)
FIGURE 57 RUSSIA KNEE HYALURONIC ACID INJECTIONS CURRENT AND FUTURE END USER ANALYSIS, 2025–2034, (USD MILLION)
FIGURE 58 CZECH REPUBLIC KNEE HYALURONIC ACID INJECTIONS CURRENT AND FUTURE TYPE ANALYSIS, 2025–2034, (USD MILLION)
FIGURE 59 CZECH REPUBLIC KNEE HYALURONIC ACID INJECTIONS CURRENT AND FUTURE END USER ANALYSIS, 2025–2034, (USD MILLION)
FIGURE 60 ROMANIA KNEE HYALURONIC ACID INJECTIONS CURRENT AND FUTURE TYPE ANALYSIS, 2025–2034, (USD MILLION)
FIGURE 61 ROMANIA KNEE HYALURONIC ACID INJECTIONS CURRENT AND FUTURE END USER ANALYSIS, 2025–2034, (USD MILLION)
FIGURE 62 REST OF EASTERN EUROPE KNEE HYALURONIC ACID INJECTIONS CURRENT AND FUTURE TYPE ANALYSIS, 2025–2034, (USD MILLION)
FIGURE 63 REST OF EASTERN EUROPE KNEE HYALURONIC ACID INJECTIONS CURRENT AND FUTURE END USER ANALYSIS, 2025–2034, (USD MILLION)
FIGURE 64 WESTERN EUROPE KNEE HYALURONIC ACID INJECTIONS CURRENT AND FUTURE MARKET VOLUME SHARE REGIONAL ANALYSIS, 2025–2034, (USD MILLION)
FIGURE 65 GERMANY KNEE HYALURONIC ACID INJECTIONS CURRENT AND FUTURE TYPE ANALYSIS, 2025–2034, (USD MILLION)
FIGURE 66 GERMANY KNEE HYALURONIC ACID INJECTIONS CURRENT AND FUTURE END USER ANALYSIS, 2025–2034, (USD MILLION)
FIGURE 67 FRANCE KNEE HYALURONIC ACID INJECTIONS CURRENT AND FUTURE TYPE ANALYSIS, 2025–2034, (USD MILLION)
FIGURE 68 FRANCE KNEE HYALURONIC ACID INJECTIONS CURRENT AND FUTURE END USER ANALYSIS, 2025–2034, (USD MILLION)
FIGURE 69 UK KNEE HYALURONIC ACID INJECTIONS CURRENT AND FUTURE TYPE ANALYSIS, 2025–2034, (USD MILLION)
FIGURE 70 UK KNEE HYALURONIC ACID INJECTIONS CURRENT AND FUTURE END USER ANALYSIS, 2025–2034, (USD MILLION)
FIGURE 71 SPAIN KNEE HYALURONIC ACID INJECTIONS CURRENT AND FUTURE TYPE ANALYSIS, 2025–2034, (USD MILLION)
FIGURE 72 SPAIN KNEE HYALURONIC ACID INJECTIONS CURRENT AND FUTURE END USER ANALYSIS, 2025–2034, (USD MILLION)
FIGURE 73 ITALY KNEE HYALURONIC ACID INJECTIONS CURRENT AND FUTURE TYPE ANALYSIS, 2025–2034, (USD MILLION)
FIGURE 74 ITALY KNEE HYALURONIC ACID INJECTIONS CURRENT AND FUTURE END USER ANALYSIS, 2025–2034, (USD MILLION)
FIGURE 75 REST OF WESTERN EUROPE KNEE HYALURONIC ACID INJECTIONS CURRENT AND FUTURE TYPE ANALYSIS, 2025–2034, (USD MILLION)
FIGURE 76 REST OF WESTERN EUROPE KNEE HYALURONIC ACID INJECTIONS CURRENT AND FUTURE END USER ANALYSIS, 2025–2034, (USD MILLION)
FIGURE 77 EAST ASIA AND PACIFIC KNEE HYALURONIC ACID INJECTIONS CURRENT AND FUTURE MARKET VOLUME SHARE REGIONAL ANALYSIS, 2025–2034, (USD MILLION)
FIGURE 78 CHINA KNEE HYALURONIC ACID INJECTIONS CURRENT AND FUTURE TYPE ANALYSIS, 2025–2034, (USD MILLION)
FIGURE 79 CHINA KNEE HYALURONIC ACID INJECTIONS CURRENT AND FUTURE END USER ANALYSIS, 2025–2034, (USD MILLION)
FIGURE 80 JAPAN KNEE HYALURONIC ACID INJECTIONS CURRENT AND FUTURE TYPE ANALYSIS, 2025–2034, (USD MILLION)
FIGURE 81 JAPAN KNEE HYALURONIC ACID INJECTIONS CURRENT AND FUTURE END USER ANALYSIS, 2025–2034, (USD MILLION)
FIGURE 82 AUSTRALIA KNEE HYALURONIC ACID INJECTIONS CURRENT AND FUTURE TYPE ANALYSIS, 2025–2034, (USD MILLION)
FIGURE 83 AUSTRALIA KNEE HYALURONIC ACID INJECTIONS CURRENT AND FUTURE END USER ANALYSIS, 2025–2034, (USD MILLION)
FIGURE 84 CAMBODIA KNEE HYALURONIC ACID INJECTIONS CURRENT AND FUTURE TYPE ANALYSIS, 2025–2034, (USD MILLION)
FIGURE 85 CAMBODIA KNEE HYALURONIC ACID INJECTIONS CURRENT AND FUTURE END USER ANALYSIS, 2025–2034, (USD MILLION)
FIGURE 86 FIJI KNEE HYALURONIC ACID INJECTIONS CURRENT AND FUTURE TYPE ANALYSIS, 2025–2034, (USD MILLION)
FIGURE 87 FIJI KNEE HYALURONIC ACID INJECTIONS CURRENT AND FUTURE END USER ANALYSIS, 2025–2034, (USD MILLION)
FIGURE 88 INDONESIA KNEE HYALURONIC ACID INJECTIONS CURRENT AND FUTURE TYPE ANALYSIS, 2025–2034, (USD MILLION)
FIGURE 89 INDONESIA KNEE HYALURONIC ACID INJECTIONS CURRENT AND FUTURE END USER ANALYSIS, 2025–2034, (USD MILLION)
FIGURE 90 SOUTH KOREA KNEE HYALURONIC ACID INJECTIONS CURRENT AND FUTURE TYPE ANALYSIS, 2025–2034, (USD MILLION)
FIGURE 91 SOUTH KOREA KNEE HYALURONIC ACID INJECTIONS CURRENT AND FUTURE END USER ANALYSIS, 2025–2034, (USD MILLION)
FIGURE 92 REST OF EAST ASIA AND PACIFIC KNEE HYALURONIC ACID INJECTIONS CURRENT AND FUTURE TYPE ANALYSIS, 2025–2034, (USD MILLION)
FIGURE 93 REST OF EAST ASIA AND PACIFIC KNEE HYALURONIC ACID INJECTIONS CURRENT AND FUTURE END USER ANALYSIS, 2025–2034, (USD MILLION)
FIGURE 94 SEA AND SOUTH ASIA KNEE HYALURONIC ACID INJECTIONS CURRENT AND FUTURE MARKET VOLUME SHARE REGIONAL ANALYSIS, 2025–2034, (USD MILLION)
FIGURE 95 BANGLADESH KNEE HYALURONIC ACID INJECTIONS CURRENT AND FUTURE TYPE ANALYSIS, 2025–2034, (USD MILLION)
FIGURE 96 BANGLADESH KNEE HYALURONIC ACID INJECTIONS CURRENT AND FUTURE END USER ANALYSIS, 2025–2034, (USD MILLION)
FIGURE 97 NEW ZEALAND KNEE HYALURONIC ACID INJECTIONS CURRENT AND FUTURE TYPE ANALYSIS, 2025–2034, (USD MILLION)
FIGURE 98 NEW ZEALAND KNEE HYALURONIC ACID INJECTIONS CURRENT AND FUTURE END USER ANALYSIS, 2025–2034, (USD MILLION)
FIGURE 99 INDIA KNEE HYALURONIC ACID INJECTIONS CURRENT AND FUTURE TYPE ANALYSIS, 2025–2034, (USD MILLION)
FIGURE 100 INDIA KNEE HYALURONIC ACID INJECTIONS CURRENT AND FUTURE END USER ANALYSIS, 2025–2034, (USD MILLION)
FIGURE 101 SINGAPORE KNEE HYALURONIC ACID INJECTIONS CURRENT AND FUTURE TYPE ANALYSIS, 2025–2034, (USD MILLION)
FIGURE 102 SINGAPORE KNEE HYALURONIC ACID INJECTIONS CURRENT AND FUTURE END USER ANALYSIS, 2025–2034, (USD MILLION)
FIGURE 103 THAILAND KNEE HYALURONIC ACID INJECTIONS CURRENT AND FUTURE TYPE ANALYSIS, 2025–2034, (USD MILLION)
FIGURE 104 THAILAND KNEE HYALURONIC ACID INJECTIONS CURRENT AND FUTURE END USER ANALYSIS, 2025–2034, (USD MILLION)
FIGURE 105 TAIWAN KNEE HYALURONIC ACID INJECTIONS CURRENT AND FUTURE TYPE ANALYSIS, 2025–2034, (USD MILLION)
FIGURE 106 TAIWAN KNEE HYALURONIC ACID INJECTIONS CURRENT AND FUTURE END USER ANALYSIS, 2025–2034, (USD MILLION)
FIGURE 107 MALAYSIA KNEE HYALURONIC ACID INJECTIONS CURRENT AND FUTURE TYPE ANALYSIS, 2025–2034, (USD MILLION)
FIGURE 108 MALAYSIA KNEE HYALURONIC ACID INJECTIONS CURRENT AND FUTURE END USER ANALYSIS, 2025–2034, (USD MILLION)
FIGURE 109 REST OF SEA AND SOUTH ASIA KNEE HYALURONIC ACID INJECTIONS CURRENT AND FUTURE TYPE ANALYSIS, 2025–2034, (USD MILLION)
FIGURE 110 REST OF SEA AND SOUTH ASIA KNEE HYALURONIC ACID INJECTIONS CURRENT AND FUTURE END USER ANALYSIS, 2025–2034, (USD MILLION)
FIGURE 111 MIDDLE EAST AND AFRICA KNEE HYALURONIC ACID INJECTIONS CURRENT AND FUTURE MARKET VOLUME SHARE REGIONAL ANALYSIS, 2025–2034, (USD MILLION)
FIGURE 112 GCC COUNTRIES KNEE HYALURONIC ACID INJECTIONS CURRENT AND FUTURE TYPE ANALYSIS, 2025–2034, (USD MILLION)
FIGURE 113 GCC COUNTRIES KNEE HYALURONIC ACID INJECTIONS CURRENT AND FUTURE END USER ANALYSIS, 2025–2034, (USD MILLION)
FIGURE 114 SAUDI ARABIA KNEE HYALURONIC ACID INJECTIONS CURRENT AND FUTURE TYPE ANALYSIS, 2025–2034, (USD MILLION)
FIGURE 115 SAUDI ARABIA KNEE HYALURONIC ACID INJECTIONS CURRENT AND FUTURE END USER ANALYSIS, 2025–2034, (USD MILLION)
FIGURE 116 UAE KNEE HYALURONIC ACID INJECTIONS CURRENT AND FUTURE TYPE ANALYSIS, 2025–2034, (USD MILLION)
FIGURE 117 UAE KNEE HYALURONIC ACID INJECTIONS CURRENT AND FUTURE END USER ANALYSIS, 2025–2034, (USD MILLION)
FIGURE 118 BAHRAIN KNEE HYALURONIC ACID INJECTIONS CURRENT AND FUTURE TYPE ANALYSIS, 2025–2034, (USD MILLION)
FIGURE 119 BAHRAIN KNEE HYALURONIC ACID INJECTIONS CURRENT AND FUTURE END USER ANALYSIS, 2025–2034, (USD MILLION)
FIGURE 120 KUWAIT KNEE HYALURONIC ACID INJECTIONS CURRENT AND FUTURE TYPE ANALYSIS, 2025–2034, (USD MILLION)
FIGURE 121 KUWAIT KNEE HYALURONIC ACID INJECTIONS CURRENT AND FUTURE END USER ANALYSIS, 2025–2034, (USD MILLION)
FIGURE 122 OMAN KNEE HYALURONIC ACID INJECTIONS CURRENT AND FUTURE TYPE ANALYSIS, 2025–2034, (USD MILLION)
FIGURE 123 OMAN KNEE HYALURONIC ACID INJECTIONS CURRENT AND FUTURE END USER ANALYSIS, 2025–2034, (USD MILLION)
FIGURE 124 QATAR KNEE HYALURONIC ACID INJECTIONS CURRENT AND FUTURE TYPE ANALYSIS, 2025–2034, (USD MILLION)
FIGURE 125 QATAR KNEE HYALURONIC ACID INJECTIONS CURRENT AND FUTURE END USER ANALYSIS, 2025–2034, (USD MILLION)
FIGURE 126 EGYPT KNEE HYALURONIC ACID INJECTIONS CURRENT AND FUTURE TYPE ANALYSIS, 2025–2034, (USD MILLION)
FIGURE 127 EGYPT KNEE HYALURONIC ACID INJECTIONS CURRENT AND FUTURE END USER ANALYSIS, 2025–2034, (USD MILLION)
FIGURE 128 NIGERIA KNEE HYALURONIC ACID INJECTIONS CURRENT AND FUTURE TYPE ANALYSIS, 2025–2034, (USD MILLION)
FIGURE 129 NIGERIA KNEE HYALURONIC ACID INJECTIONS CURRENT AND FUTURE END USER ANALYSIS, 2025–2034, (USD MILLION)
FIGURE 130 SOUTH AFRICA KNEE HYALURONIC ACID INJECTIONS CURRENT AND FUTURE TYPE ANALYSIS, 2025–2034, (USD MILLION)
FIGURE 131 SOUTH AFRICA KNEE HYALURONIC ACID INJECTIONS CURRENT AND FUTURE END USER ANALYSIS, 2025–2034, (USD MILLION)
FIGURE 132 ISRAEL KNEE HYALURONIC ACID INJECTIONS CURRENT AND FUTURE TYPE ANALYSIS, 2025–2034, (USD MILLION)
FIGURE 133 ISRAEL KNEE HYALURONIC ACID INJECTIONS CURRENT AND FUTURE END USER ANALYSIS, 2025–2034, (USD MILLION)
FIGURE 134 REST OF MEA KNEE HYALURONIC ACID INJECTIONS CURRENT AND FUTURE TYPE ANALYSIS, 2025–2034, (USD MILLION)
FIGURE 135 REST OF MEA KNEE HYALURONIC ACID INJECTIONS CURRENT AND FUTURE END USER ANALYSIS, 2025–2034, (USD MILLION)
FIGURE 136 U. S. MARKET SHARE ANALYSIS BY TYPE (2024)
FIGURE 137 U. S. MARKET SHARE ANALYSIS BY END USER (2024)
FIGURE 138 CANADA MARKET SHARE ANALYSIS BY TYPE (2024)
FIGURE 139 CANADA MARKET SHARE ANALYSIS BY END USER (2024)
FIGURE 140 MEXICO MARKET SHARE ANALYSIS BY TYPE (2024)
FIGURE 141 MEXICO MARKET SHARE ANALYSIS BY END USER (2024)
FIGURE 142 CHINA MARKET SHARE ANALYSIS BY TYPE (2024)
FIGURE 143 CHINA MARKET SHARE ANALYSIS BY END USER (2024)
FIGURE 144 JAPAN MARKET SHARE ANALYSIS BY TYPE (2024)
FIGURE 145 JAPAN MARKET SHARE ANALYSIS BY END USER (2024)
FIGURE 146 INDIA MARKET SHARE ANALYSIS BY TYPE (2024)
FIGURE 147 INDIA MARKET SHARE ANALYSIS BY END USER (2024)
FIGURE 148 SOUTH KOREA MARKET SHARE ANALYSIS BY TYPE (2024)
FIGURE 149 SOUTH KOREA MARKET SHARE ANALYSIS BY END USER (2024)
FIGURE 150 SAUDI ARABIA MARKET SHARE ANALYSIS BY TYPE (2024)
FIGURE 151 SAUDI ARABIA MARKET SHARE ANALYSIS BY END USER (2024)
FIGURE 152 UAE MARKET SHARE ANALYSIS BY TYPE (2024)
FIGURE 153 UAE MARKET SHARE ANALYSIS BY END USER (2024)
FIGURE 154 EGYPT MARKET SHARE ANALYSIS BY TYPE (2024)
FIGURE 155 EGYPT MARKET SHARE ANALYSIS BY END USER (2024)
FIGURE 156 NIGERIA MARKET SHARE ANALYSIS BY TYPE (2024)
FIGURE 157 NIGERIA MARKET SHARE ANALYSIS BY END USER (2024)
FIGURE 158 SOUTH AFRICA MARKET SHARE ANALYSIS BY TYPE (2024)
FIGURE 159 SOUTH AFRICA MARKET SHARE ANALYSIS BY END USER (2024)
FIGURE 160 GERMANY MARKET SHARE ANALYSIS BY TYPE (2024)
FIGURE 161 GERMANY MARKET SHARE ANALYSIS BY END USER (2024)
FIGURE 162 FRANCE MARKET SHARE ANALYSIS BY TYPE (2024)
FIGURE 163 FRANCE MARKET SHARE ANALYSIS BY END USER (2024)
FIGURE 164 UK MARKET SHARE ANALYSIS BY TYPE (2024)
FIGURE 165 UK MARKET SHARE ANALYSIS BY END USER (2024)
FIGURE 166 SPAIN MARKET SHARE ANALYSIS BY TYPE (2024)
FIGURE 167 SPAIN MARKET SHARE ANALYSIS BY END USER (2024)
FIGURE 168 ITALY MARKET SHARE ANALYSIS BY TYPE (2024)
FIGURE 169 ITALY MARKET SHARE ANALYSIS BY END USER (2024)
FIGURE 170 BRAZIL MARKET SHARE ANALYSIS BY TYPE (2024)
FIGURE 171 BRAZIL MARKET SHARE ANALYSIS BY END USER (2024)
FIGURE 172 ARGENTINA MARKET SHARE ANALYSIS BY TYPE (2024)
FIGURE 173 ARGENTINA MARKET SHARE ANALYSIS BY END USER (2024)
FIGURE 174 COLUMBIA MARKET SHARE ANALYSIS BY TYPE (2024)
FIGURE 175 COLUMBIA MARKET SHARE ANALYSIS BY END USER (2024)
FIGURE 176 GLOBAL KNEE HYALURONIC ACID INJECTIONS CURRENT AND FUTURE MARKET KEY COUNTRY LEVEL ANALYSIS, 2024–2034, (USD MILLION)
FIGURE 177 FINANCIAL OVERVIEW:
Key Player Analysis
Sanofi: Sanofi holds a strong leadership position in the knee hyaluronic acid injections market through its established viscosupplement portfolio and broad global distribution network. The company maintains a consistent presence across North America, Europe, and Asia, supported by established relationships with orthopedic clinics and hospital systems. In 2025, Sanofi strengthens its position by expanding real-world evidence programs that track long-term patient outcomes and inform product refinements. You see the firm investing in manufacturing automation to improve batch consistency and reduce production costs, which is critical as pricing pressure increases. Sanofi also advances partnerships with regional distributors to grow access in emerging markets, especially in Southeast Asia and Latin America. Its ability to scale production and maintain high regulatory compliance remains a key differentiator as the market becomes more competitive.
Anika Therapeutics Inc. (DePuy Synthes Inc.): Anika Therapeutics, supported by its alignment with DePuy Synthes, operates as a niche specialist with strong expertise in hyaluronic acid science and regenerative orthopedics. The company continues to grow its footprint through single-injection and multi-injection formulations used widely in orthopedic practices. In 2025, Anika focuses on expanding clinical programs that combine hyaluronic acid with regenerative approaches, reflecting rising demand for non-surgical joint preservation. The company reports steady revenue gains in the high single-digit range as outpatient orthopedic centers increase procedure volumes. Strategic collaborations with digital health platforms help the company collect patient-reported outcome data, giving you a clearer view of performance across diverse populations. Its specialization, strong clinical portfolio, and targeted R&D investments position Anika as a preferred supplier among orthopedic specialists.
Seikagaku Corporation: Seikagaku Corporation positions itself as a science-driven competitor with a long history in glycoscience research. The company benefits from a focused portfolio of viscosupplement products that hold strong adoption rates in Japan and continue to expand across the United States and Europe. By 2025, Seikagaku increases its investment in R&D aimed at refining molecular structures to achieve longer-lasting therapeutic effects, a key priority as patients seek fewer injections per year. The company also strengthens licensing partnerships to accelerate international distribution and reduce time to market in high-growth regions. Seikagaku differentiates itself with consistent clinical evidence, strong patent activity, and a disciplined expansion strategy that supports stable mid-single-digit annual growth. Its emphasis on product quality and scientific depth keeps it competitive as global demand for non-surgical osteoarthritis treatments rises.
Aging Population and Rising Osteoarthritis Prevalence
By 2025, the rising rates of osteoarthritis, driven by an aging population, continue to boost the demand for knee hyaluronic acid injections. Global health projections indicate that the number of people aged 60 and older is growing quickly, making this group the most at risk for knee joint problems. More than 65 percent of adults over 65 show noticeable symptoms of osteoarthritis, which increases the pool of patients eligible for viscosupplementation therapies.
Sustained Demand for Non-Surgical Pain Management
This demographic change leads to a market with increasing patient volumes and ongoing treatment needs. Many older patients look for alternatives to surgery because of higher risks involved. Hyaluronic acid injections remain a popular choice for pain relief and improving mobility. This situation provides long-term revenue stability for manufacturers and encourages further investment in better formulations that offer longer-lasting benefits.
Restraint:
High Cost of Treatment Procedures
High treatment costs pose a major obstacle to wider use in 2025, especially in developed markets. In the United States, a single knee hyaluronic acid injection usually costs between USD 500 and USD 1,500. Treatment cycles involving multiple injections can significantly raise total costs. These prices limit access for many patients, particularly those who need ongoing therapy.
Limited Reimbursement and Access Challenges
Many insurance companies still classify viscosupplementation as an elective therapy, leading to partial or no coverage. This increases out-of-pocket costs and discourages use, especially in lower-income and developing areas where healthcare coverage is lacking. Consequently, financial pressures hinder procedure volumes and push manufacturers to show more clinical and economic value to insurance providers and healthcare systems.
Opportunity:
Technological Advancements in Injection Techniques
Ongoing improvements in injection techniques and materials offer significant growth opportunities starting in 2025. Healthcare providers are increasingly interested in methods that extend pain relief duration or reduce the number of injections needed. Enhanced ultrasound-guided techniques are gaining popularity as initial evaluations show better placement accuracy and improved patient outcomes.
Innovation in Formulations and Cost Optimization
New synthetic and stabilized hyaluronic acid formulations with longer durability are emerging as important differentiators. These innovations could lower overall treatment costs by up to 20 percent, while also improving patient adherence and satisfaction. Such advancements allow manufacturers to target new patient groups, create better clinical value propositions, and strengthen their competitive edge in a crowded market.
A clear shift toward non-surgical management of knee osteoarthritis continues to influence clinical practices in 2025. More than 85 percent of newly diagnosed patients now start treatment with conservative therapies, following updated clinical guidelines that focus on minimally invasive treatments. This approach emphasizes managing pain and preserving mobility before considering surgery.
Integration of Viscosupplementation in Early Care Pathways
Hyaluronic acid injections fit well with this trend since they have a lower risk of complications and allow for faster recovery compared to surgery. As a result, hospitals, orthopedic clinics, and outpatient centers are seeing steady procedure volumes. This shift also encourages suppliers to broaden training and education for physicians, helping to incorporate viscosupplementation more effectively into the early stages of osteoarthritis treatment.
Recent Developments
Jan 2025 - Anika Therapeutics: Anika filed the second PMA module with the FDA for Hyalofast, its hyaluronic-acid-based cartilage repair scaffold that is already sold in more than 35 countries outside the United States. The staged filing keeps the company on track for a potential U.S. launch around 2026 and strengthens its long-term position in joint preservation adjacent to knee hyaluronic acid pain treatments.
Feb 2025 - Seikagaku Corporation: Seikagaku initiated Phase III clinical studies of Gel-One for both knee and hip joints, expanding late-stage evidence for its single-injection viscosupplement platform. This move supports label expansion, underpins future pricing and reimbursement discussions, and helps protect Gel-One’s share in the rapidly growing single-injection segment.
Apr 2025 - Seikagaku Corporation and Ono Pharmaceutical: Seikagaku and Ono signed a basic agreement covering co-development and marketing collaboration for Gel-One in Japan, aligning Seikagaku’s hyaluronic acid portfolio with Ono’s commercial infrastructure. The alliance broadens national coverage in one of the largest osteoarthritis markets in Asia and can lift the combined partners’ viscosupplement share over the next planning cycle.
Jun 2025 - Fidia Farmaceutici: Fidia initiated clinical development of an intra-articular injection that combines hyaluronic acid with collagen for joint regeneration, with early-stage trials beginning in Europe. The program targets a collagen and hyaluronic acid intra-articular market projected to grow from about 3.01 billion USD in 2024 to roughly 5.77 billion USD by 2035 at around 6.1 percent CAGR, giving you exposure to a higher-growth subsegment of viscosupplementation.
Jul 2025 - Anika Therapeutics: Anika reported topline results from the U.S. pivotal FastTRACK Phase III study for Hyalofast and confirmed plans to submit the third and final PMA module in the second half of 2025. The data package supports a 2026 commercial launch timeline and deepens Anika’s cartilage repair franchise anchored in hyaluronic acid technology.
Nov 2025 - Anika Therapeutics: In its third-quarter 2025 results, Anika reported a 22 percent year-on-year increase in Commercial Channel revenue, driven by strong Integrity implant and Hyalofast performance and double-digit growth in international osteoarthritis pain management. This momentum confirms that hyaluronic acid-based pain and cartilage products remain a key earnings driver and signals to you that the company can reinvest cash flow into further viscosupplement and joint-preservation R&D.