
- Home
- Industries
 Aerospace And Defence
 Agriculture
 Automotive And Transportation
 Banking And Finance
 Business
 Chemicals And Materials
 Consumer And Retail
 Electronics And Semiconductors
 Food And Beverages
 Machinery & Equipments
 Manufacturing And Construction
 Medical Devices
 Others
 Pharmaceuticals And Healthcare
 Power And Energy
 Sports
 Technology
- Services
- News Room
- About us
- Contact Us
-
KRAS Inhibitor Market Size USD 286.9M & 8.4% CAGR
Global KRAS Inhibitor Market Size, Share & Oncology Pipeline Analysis By Molecule Type (KRAS G12C, Next-Gen Inhibitors), By Indication (NSCLC, Colorectal, Pancreatic Cancer), By Therapy Line, By End User, Clinical Trial Landscape, Key Players & Forecast 2025–2034

Report Overview
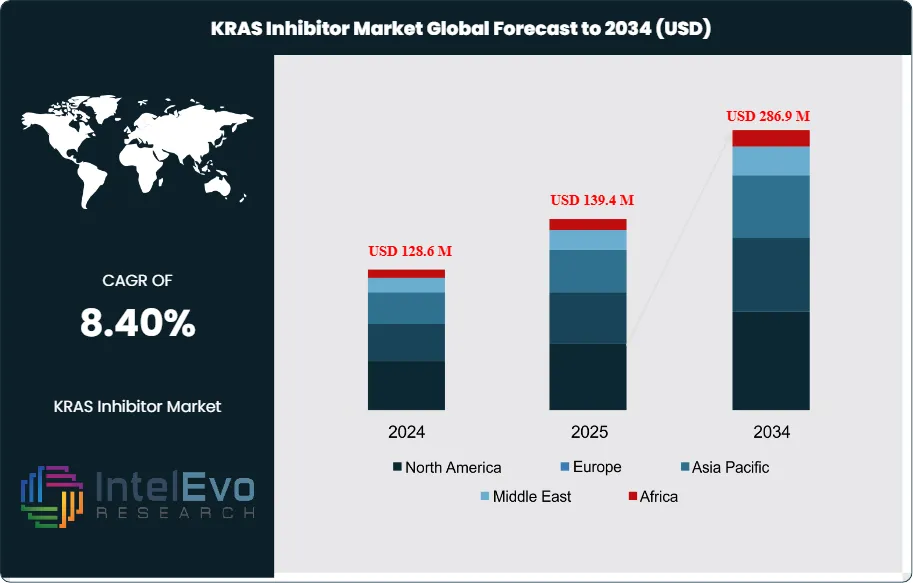
The KRAS Inhibitor Market is estimated at USD 128.6 million in 2024 and is projected to reach approximately USD 286.9 million by 2034, registering a CAGR of about 8.4% during 2025–2034. Market growth is being driven by expanding clinical validation of KRAS-targeted therapies, rising prevalence of KRAS-mutant cancers—particularly non-small cell lung cancer and colorectal cancer—and improving biomarker-driven patient selection. In addition, next-generation KRAS inhibitors targeting multiple mutations, combination regimens with immunotherapies, and broader geographic approvals are accelerating uptake, positioning the market for sustained momentum over the next decade.
Get More Information about this report -
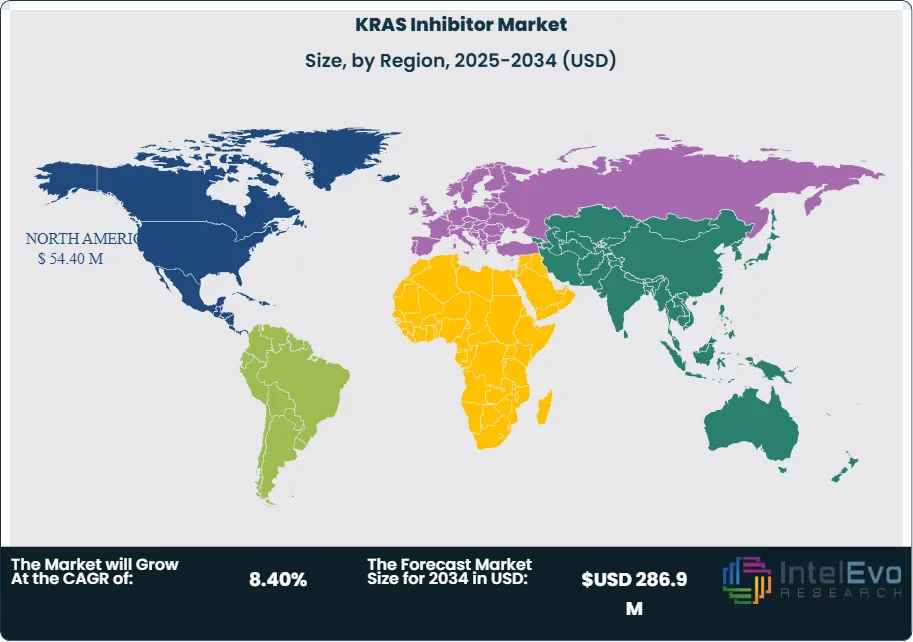
Request Free Sample ReportAs of 2025, momentum reflects steady adoption of targeted therapies in oncology and deeper use of biomarker-led treatment selection. KRAS mutations remain among the most prevalent oncogenic drivers. They occur in about 25–30% of non-small cell lung cancer adenocarcinomas, around 40% of colorectal cancers, and over 90% of pancreatic ductal adenocarcinomas. Approvals for KRAS G12C inhibitors have validated the class and expanded use in second-line settings. Next waves focus on G12D and pan-KRAS approaches to widen the addressable population and address acquired resistance. North America led with 42.3% share and USD 45.7 million in value, supported by high testing penetration, specialist centers, and favorable trial infrastructure.
Growth stems from precision oncology workflows that match drug to mutation, the rise of next-generation sequencing in diagnostic pathways, and active pipelines exploring combinations with EGFR, SHP2, MEK, and checkpoint inhibitors. You see continued investment in Phase I/II programs and registrational studies that target durability and resistance management. Supply-side activity includes partnerships between biotechs and large pharmas to accelerate development, manufacturing scale-up, and global trial execution. Pricing and reimbursement shape uptake. Health technology assessments emphasize survival benefit and quality-adjusted outcomes, pushing sponsors to deliver clear real-world evidence and post-marketing commitments.
Clinical challenges persist. Resistance emerges through on-target and bypass mechanisms, limiting monotherapy durability in certain settings. Toxicity management and patient selection remain critical. Narrow mutation subtypes constrain eligible cohorts, which can slow commercial ramp outside leading centers. Regulatory scrutiny focuses on confirmatory evidence after accelerated pathways and on robust companion diagnostics performance. On the technology front, medicinal chemistry advances are yielding non-covalent and allele-selective inhibitors. Platform screening, structure-based design, and AI-assisted discovery shorten cycle times. Liquid biopsy supports response monitoring and earlier detection of resistance, improving trial efficiency and informing treatment switches.
Regionally, North America remains the anchor market with advanced access and trial density. Europe follows with strong academic consortia and expanding reimbursement for biomarker-driven regimens. Asia Pacific is the key watchlist for 2025–2028 as oncology incidence, clinical trial capacity, and local biotechs grow across China, Japan, and South Korea. Investors should track late-stage readouts in G12D and combination regimens, companion diagnostic adoption rates, and real-world outcomes that can unlock broader labels and sustained market growth.
, By Indication (NSCLC, Colorectal, Pancreatic Cancer), By Therapy Line, By End User, Clinical Trial Landscape, Key Players & Forecast 2025–2034")
Key Takeaways
- Market Growth: The market was USD 128.6 million in 2024 and is projected to reach USD 286.9 million by 2034 at a 8.4% CAGR, driven by targeted therapy adoption, biomarker-led treatment selection, and expanding labels beyond second-line use. You should expect steady volume growth as next-generation inhibitors address resistance and broaden mutation coverage.
- Cancer Type: Lung cancer led with 42.3% share in 2023 due to higher testing penetration and earlier availability of KRAS G12C therapies in NSCLC. Colorectal and pancreatic cancers remain meaningful but capacity-constrained segments pending wider access, combination data, and G12D progress.
- End User: Cancer research institutes held 39.8% share, reflecting concentration of complex biomarker testing, clinical trial enrollment, and early access programs. Hospitals follow as companion diagnostics scale and treatment pathways standardize in regional centers of excellence.
- Driver: Precision oncology workflows and next-generation sequencing adoption are expanding the addressable pool, with KRAS mutations prevalent across NSCLC, colorectal, and pancreatic tumors. Recent approvals and combination studies with EGFR, SHP2, MEK, and checkpoint inhibitors support durable control and real-world uptake.
- Restraint: Resistance mechanisms and narrow mutation eligibility constrain monotherapy durability and limit patient pools in early commercial phases; G12C constitutes a low‑teens percent of NSCLC, which caps immediate volumes. Cost-effectiveness thresholds and companion diagnostic readiness add friction to broad reimbursement.
- Opportunity: G12D and pan‑KRAS programs, plus brain-penetrant and allosteric designs, can expand reach into pancreatic and colorectal cancers and earlier lines; combination regimens offer upside in durability and total addressable market. Asia Pacific presents the fastest growth trajectory, with potential mid‑single to high‑single digit CAGR as testing and trial capacity scale.
- Trend: Combinations are becoming the default in Phase II/III pipelines, targeting on‑target and bypass resistance and enabling longer progression-free intervals. Liquid biopsy for MRD and resistance monitoring is entering practice, supporting timely switches and evidence generation for label expansions.
- Regional Analysis: North America led with 42.3% share on strong diagnostic infrastructure, trial density, and payer pathways; Europe follows with expanding HTA-backed access across major markets. Asia Pacific is the watchlist for 2025–2028 on rising incidence, local biotech activity, and accelerating biomarker testing in China, Japan, and South Korea.
Cancer Type Analysis
Lung cancer remained the largest segment with 42.3% share in 2023 and continues to anchor demand in 2025 as non-small cell lung cancer (NSCLC) integrates targeted therapy into second-line and later settings. KRAS mutations occur in roughly 25–30% of NSCLC adenocarcinomas, sustaining a sizable addressable pool as testing penetration rises and clinical pathways standardize around mutation-led decisions. Approvals of G12C inhibitors have validated the class and supported uptake where companion diagnostics are routine.
Colorectal and pancreatic cancers form the next growth wave as programs advance beyond G12C. KRAS mutations affect about 40% of colorectal cancers and more than 90% of pancreatic ductal adenocarcinomas, but eligibility remains subtype-dependent. Pipeline focus on G12D, pan‑KRAS, and brain-penetrant designs, plus combinations with EGFR, SHP2, MEK, and checkpoint inhibitors, aims to extend durability, address resistance, and move earlier in lines of therapy. Wider adoption of ctDNA and minimal residual disease monitoring supports faster response assessment and treatment switches.
End-user Analysis
Cancer research institutes held 39.8% share in 2023 and remain central in 2025 due to trial density, early access programs, and advanced molecular profiling capabilities. These centers drive evidence generation through Phase I–III studies, real-world data registries, and biomarker refinement, which in turn de-risk payer decisions and guide label expansions. You see deeper collaboration between academic consortia and sponsors to accelerate enrollment in allele-specific cohorts.
Hospitals are scaling adoption as companion diagnostics become embedded in oncology workflows and molecular tumor boards guide case review. Regional centers of excellence expand NGS and liquid biopsy throughput, while clinic laboratories grow test volumes tied to reflex testing protocols. Budget impact, reimbursement timelines, and diagnostic turnaround remain practical constraints. Procurement favors integrated solutions that link testing, reporting, and therapy access to streamline time-to-treat and reduce variance across care sites.
Regional Analysis
North America led with 42.3% share, supported by high testing penetration, specialist networks, and payer pathways that reward biomarker-aligned care. U.S. approvals for KRAS inhibitors established precedent for targeted use in NSCLC and are shaping colorectal use through ongoing label updates and post-marketing studies. Canada’s provincial pathways and large academic centers continue to expand access through tumor-agnostic testing initiatives and trial participation.
Europe follows with broad but heterogeneous access as health technology assessments calibrate reimbursement to survival and quality-adjusted outcomes. Major markets are widening companion diagnostic coverage and funding for combination regimens as resistance biology becomes clearer. Asia Pacific is positioned for the fastest growth through 2028 on rising incidence, expanding NGS infrastructure, and active trial hubs in China, Japan, and South Korea. Latin America and the Middle East & Africa are emerging with targeted access via reference centers, with growth tied to national precision medicine programs, public-private partnerships, and improved reimbursement for validated biomarkers.
Get More Information about this report -
Request Free Sample ReportMarket Key Segments
By Cancer Type
- Lung Cancer
- Colorectal Cancer
- Pancreatic Cancer
- Others
By End-user
- Hospitals
- Clinic Laboratories
- Cancer Research Institutes
- Others
Regions
- North America
- Latin America
- East Asia And Pacific
- Sea And South Asia
- Eastern Europe
- Western Europe
- Middle East & Africa
| Report Attribute | Details |
| Market size (2024) | USD 128.6 M |
| Forecast Revenue (2034) | USD 286.9 M |
| CAGR (2024-2034) | 8.40% |
| Historical data | 2020-2023 |
| Base Year For Estimation | 2024 |
| Forecast Period | 2025-2034 |
| Report coverage | Revenue Forecast, Competitive Landscape, Market Dynamics, Growth Factors, Trends and Recent Developments |
| Segments covered | By Cancer Type (Lung Cancer, Colorectal Cancer, Pancreatic Cancer, Others), By End-user (Hospitals, Clinic Laboratories, Cancer Research Institutes, Others) |
| Research Methodology |
|
| Regional scope |
|
| Competitive Landscape | Jemincare, Amgen, Innovent Biologics, Inc., BridgeBio Pharma, Erasca, Incyte, Novartis, Mirati Therapeutics |
| Customization Scope | Customization for segments, region/country-level will be provided. Moreover, additional customization can be done based on the requirements. |
| Pricing and Purchase Options | Avail customized purchase options to meet your exact research needs. We have three licenses to opt for: Single User License, Multi-User License (Up to 5 Users), Corporate Use License (Unlimited User and Printable PDF). |
, By Indication (NSCLC, Colorectal, Pancreatic Cancer), By Therapy Line, By End User, Clinical Trial Landscape, Key Players & Forecast 2025–2034")
, By Indication (NSCLC, Colorectal, Pancreatic Cancer), By Therapy Line, By End User, Clinical Trial Landscape, Key Players & Forecast 2025–2034")
, By Indication (NSCLC, Colorectal, Pancreatic Cancer), By Therapy Line, By End User, Clinical Trial Landscape, Key Players & Forecast 2025–2034")

Select Licence Type
Connect with our sales team
Why IntelEvoResearch
100%
Customer
Satisfaction
24x7+
Availability - we are always
there when you need us
200+
Fortune 50 Companies trust
IntelEvoResearch
80%
of our reports are exclusive
and first in the industry
100%
more data
and analysis
1000+
reports published
till date
