Large Language Model Market Size USD 128.6B & 23.1% CAGR
Global Large Language Model (LLM) Market Size, Share & Competitive Intelligence By Model Type, By Deployment (Cloud, On-Premise), By Application (Chatbots, Coding Assistants, Search, Content Generation), By End User, Investment Trends, Key Players & Global Forecast 2025–2034
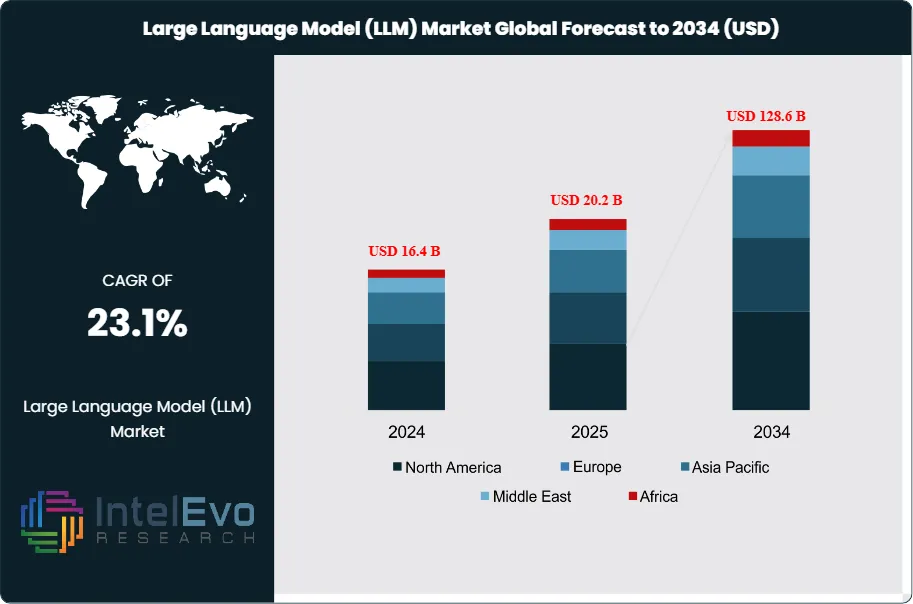
The Large Language Model (LLM) Market is estimated at USD 16.4 billion in 2024 and is projected to reach approximately USD 128.6 billion by 2034, registering a robust CAGR of about 23.1% during 2025–2034. This sustained expansion reflects the rapid shift from experimental use cases to enterprise-scale deployments across customer service, software development, data analytics, healthcare, and financial services. Growing adoption of domain-specific and multilingual models, alongside advances in retrieval-augmented generation and cost-efficient small language models, is accelerating monetization. In parallel, rising demand for AI copilots, automation of knowledge work, and integration of LLMs into core business workflows is positioning the market as a foundational pillar of the global AI economy over the next decade.
This rapid expansion reflects the accelerating adoption of generative AI across industries, driven by advances in natural language processing and the growing need for efficient data handling, automation, and digital interaction. Over the past three years, LLMs have moved from experimental deployments to mainstream enterprise adoption, with 67% of organizations now integrating generative AI tools into their operations. The market’s trajectory suggests that adoption will continue to deepen as models become more reliable, cost-efficient, and adaptable to industry-specific use cases.
Demand-side growth is being fueled by enterprises seeking to automate customer service, streamline content creation, and improve decision-making. In financial services, for example, 60% of Bank of America’s clients already use LLM-based solutions for investment and retirement planning. Supply-side advances are equally significant. Models such as GPT-4, capable of processing up to 1 million tokens, are enabling complex applications ranging from software development to multilingual translation. At the same time, smaller models like Microsoft’s PHI-2, with 2.7 billion parameters, are outperforming larger peers in coding tasks, highlighting efficiency gains that reduce infrastructure costs and broaden accessibility.
The speed of deployment is another critical factor. Nearly half of surveyed organizations report being able to implement generative AI tools within one to four months, underscoring the scalability of LLM adoption. This rapid integration creates opportunities for competitive advantage in customer engagement, product development, and operational efficiency. However, the market faces challenges. Only 23% of companies are currently deploying or planning to deploy commercial LLMs, reflecting concerns around privacy, data security, and ethical use. Regulatory scrutiny is expected to intensify, particularly in finance and healthcare, where compliance and risk management are paramount.
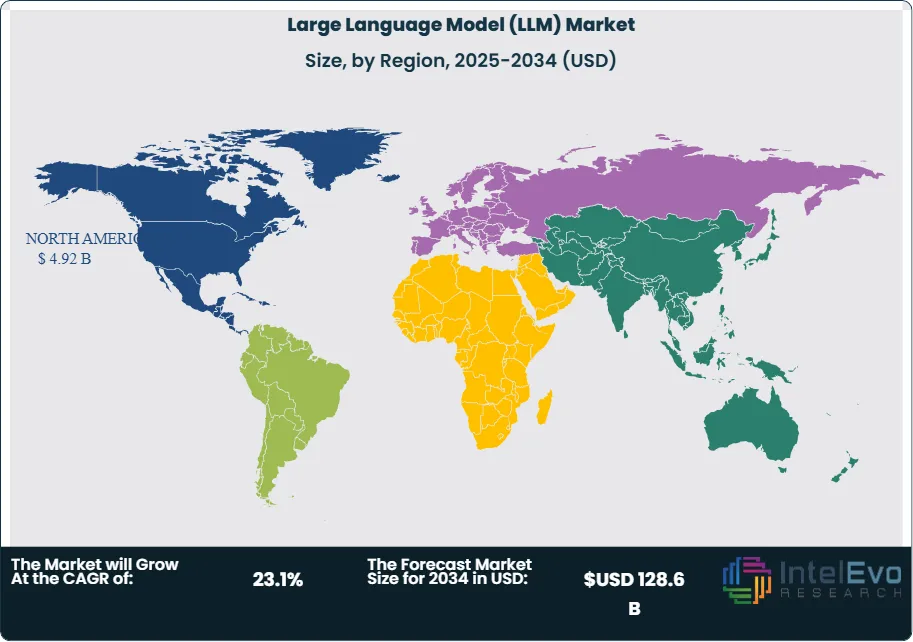
Regionally, North America leads adoption, supported by strong investment from technology firms and financial institutions. Europe is advancing under strict regulatory frameworks, while Asia-Pacific is emerging as a high-growth region, driven by demand in e-commerce, education, and government services. For investors, the most attractive opportunities lie in markets where regulatory clarity aligns with strong enterprise demand, particularly in customer service automation, healthcare analytics, and financial advisory solutions.
Key Takeaways
Market Growth: The Large Language Model (LLM) market was valued at USD 16.4 billion in 2024 and is projected to reach USD 128.6 billion by 2034, registering a CAGR of 23.1%. Growth is driven by rising enterprise adoption of generative AI, automation of digital workflows, and demand for advanced natural language processing capabilities.
Deployment: On-premises deployment accounted for 57.7% of revenue in 2023, reflecting enterprise concerns over data privacy and regulatory compliance. Cloud-based deployment is expected to gain share as organizations seek faster scalability and lower infrastructure costs.
Application: Chatbots and virtual assistants represented 27.1% of the market in 2023, supported by strong adoption in customer service and enterprise communication. Their role in reducing operational costs and improving response times positions this segment for sustained growth.
Industry Vertical: Retail and e-commerce led with 27.5% share in 2023, as companies increasingly deploy LLMs for personalized recommendations, automated product descriptions, and customer engagement. Financial services and healthcare are emerging as high-growth verticals due to demand for secure, AI-driven advisory and diagnostic tools.
Driver: Enterprise adoption of generative AI is accelerating, with 67% of organizations already using LLM-powered tools for content creation. By 2025, 750 million applications are expected to integrate LLMs, and 50% of digital work could be automated through these models.
Restraint: Commercial deployment remains limited, with only 23% of companies moving beyond pilot projects. Concerns around data security, ethical use, and regulatory oversight are slowing large-scale adoption.
Opportunity: Smaller, optimized models such as Microsoft’s PHI-2 demonstrate efficiency gains over larger peers, creating opportunities for cost-effective adoption across mid-sized enterprises. Asia-Pacific markets, particularly in e-commerce and education, are expected to post double-digit CAGR through 2033.
Trend: Market concentration remains high, with the top five LLM developers capturing 88.2% of global revenue in 2023. Consolidation and strategic partnerships are shaping competitive dynamics, while advancements in token processing and parameter efficiency are expanding use cases.
Regional Analysis: North America led with 32.7% share in 2023, supported by advanced R&D infrastructure and early enterprise adoption. Europe is expanding under strict regulatory frameworks, while Asia-Pacific is emerging as the fastest-growing region, driven by large-scale digital transformation initiatives.
Type Analysis
High-performance concrete continues to dominate the advanced concrete market in 2025, supported by its superior strength, durability, and ability to withstand extreme environmental conditions. Demand is particularly strong in large-scale infrastructure projects such as bridges, highways, and high-rise buildings, where structural integrity and long service life are critical. The segment is projected to expand at a CAGR of over 7% through 2030, driven by government investments in resilient infrastructure and urban expansion across Asia and the Middle East.
Self-consolidating concrete is gaining traction due to its efficiency in reducing labor costs and improving construction speed. Its ability to flow easily into complex formworks without mechanical vibration makes it attractive for high-density reinforcement projects. Adoption is rising in both residential and commercial construction, with the segment expected to capture a growing share of the market as developers prioritize faster project completion and reduced maintenance costs.
Other specialty concretes, including lightweight and fiber-reinforced variants, are also expanding their footprint. These materials are increasingly used in industrial facilities and specialized applications such as precast elements, where weight reduction and enhanced crack resistance are essential. Collectively, these types are expected to account for a significant portion of incremental demand by 2030, particularly in emerging economies investing in modern construction technologies.
Application Analysis
Pavers represent one of the largest application segments, supported by rapid urbanization and the expansion of smart city projects. Municipalities and private developers are increasingly adopting high-performance and self-consolidating concrete for sidewalks, driveways, and public spaces. The segment is forecast to grow steadily, with Asia Pacific and Latin America driving demand through large-scale urban infrastructure programs.
Retaining walls are another critical application, particularly in regions with expanding transportation networks and hillside urban development. The use of advanced concrete in retaining walls ensures structural stability, reduces maintenance, and extends service life. With rising investments in road and rail infrastructure, this segment is expected to record consistent growth through 2030.
Other applications, including precast elements, drainage systems, and industrial flooring, are also expanding. These uses benefit from the versatility of advanced concrete types, which provide both structural strength and design flexibility. As industrialization accelerates in Asia and Africa, demand for these applications is projected to rise at above-average growth rates.
End-Use Analysis
The residential building sector remains a key driver of demand, supported by rapid urban population growth and government-backed affordable housing initiatives. Developers are increasingly adopting self-consolidating concrete to reduce construction time and improve quality, particularly in high-density housing projects.
Commercial buildings, including office complexes, shopping centers, and hospitality projects, represent another major end-use segment. The need for durable, aesthetically adaptable materials is fueling demand for high-performance concrete in this category. With global commercial real estate investment expected to rebound strongly post-2024, this segment is forecast to expand at a CAGR of nearly 6% through 2030.
Industrial buildings, including warehouses, factories, and logistics hubs, are also contributing to market growth. The rise of e-commerce and global supply chain expansion has accelerated demand for durable flooring and structural materials. Fiber-reinforced and lightweight concretes are increasingly used in these facilities to enhance load-bearing capacity and reduce long-term maintenance costs.
Regional Analysis
North America continues to lead the global market, accounting for more than 30% of revenue in 2025. The region benefits from advanced construction practices, strong investment in infrastructure renewal, and the presence of leading material suppliers. Federal funding for transportation and energy infrastructure is expected to sustain demand through the decade.
Europe remains a mature but stable market, supported by stringent environmental regulations and a strong focus on sustainable construction. The adoption of low-carbon and recycled concrete solutions is accelerating, particularly in Western Europe, where governments are prioritizing green building standards.
Asia Pacific is the fastest-growing region, projected to expand at a CAGR above 8% through 2030. Rapid urbanization, large-scale infrastructure projects in China and India, and rising investment in smart cities are driving demand. Latin America and the Middle East & Africa are also emerging as attractive markets, supported by government-backed infrastructure programs and industrial expansion. These regions are expected to capture a growing share of global demand as construction activity accelerates.
By Deployment, Cloud, On-Premises, By Application, Customer Service, Content Generation, Sentiment Analysis, Code Generation, Chatbots and Virtual Assistant, Language Translation, By Industry Vertical, Healthcare, BFSI, Retail and E-Commerce, Media and Entertainment, Others
Research Methodology
Primary Research- 100 Interviews of Stakeholders
Secondary Research
Desk Research
Regional scope
North America (United States, Canada, Mexico)
Latin America (Brazil, Argentina, Columbia)
East Asia And Pacific (China, Japan, South Korea, Australia, Cambodia, Fiji, Indonesia)
Sea And South Asia (India, Singapore, Thailand, Taiwan, Malaysia)
Eastern Europe (Poland, Russia, Czech Republic, Romania)
Western Europe (Germany, U.K., France, Spain, Itlay)
Middle East & Africa (GCC Countries, Egypt, Nigeria, South Africa, Israel)
Competitive Landscape
Microsoft Corporation, Baidu, Inc., NVIDIA, Amazon Web Services (AWS), Huawei Technologies Co., Ltd., Meta Platforms, Inc., IBM Corporation, OpenAI LP, Google LLC, Tencent Holdings Limited, Alibaba Group Holding Limited, Other Key Players
Customization Scope
Customization for segments, region/country-level will be provided. Moreover, additional customization can be done based on the requirements.
Pricing and Purchase Options
Avail customized purchase options to meet your exact research needs. We have three licenses to opt for: Single User License, Multi-User License (Up to 5 Users), Corporate Use License (Unlimited User and Printable PDF).
TABLE OF CONTENTS
1. EXECUTIVE SUMMARY
1.1. MARKET SNAPSHOT
1.2. KEY FINDINGS & INSIGHTS
1.3. ANALYST RECOMMENDATIONS
1.4. FUTURE OUTLOOK
2. RESEARCH METHODOLOGY
2.1. MARKET DEFINITION & SCOPE
2.2. RESEARCH OBJECTIVES: PRIMARY & SECONDARY DATA SOURCES
2.3. DATA COLLECTION SOURCES
2.3.1. COVERAGE OF 100+ PRIMARY RESEARCH/CONSULTATION CALLS WITH INDUSTRY STAKEHOLDERS
FIGURE 17 NORTH AMERICA LARGE LANGUAGE MODEL (LLM) CURRENT AND FUTURE TYPE ANALYSIS, 2025–2034, (USD MILLION)
FIGURE 18 NORTH AMERICA LARGE LANGUAGE MODEL (LLM) CURRENT AND FUTURE END USER ANALYSIS, 2025–2034, (USD MILLION)
FIGURE 19 MARKET SHARE BY COUNTRY
FIGURE 20 LATIN AMERICA LARGE LANGUAGE MODEL (LLM) CURRENT AND FUTURE TYPE ANALYSIS, 2025–2034, (USD MILLION)
FIGURE 21 LATIN AMERICA LARGE LANGUAGE MODEL (LLM) CURRENT AND FUTURE END USER ANALYSIS, 2025–2034, (USD MILLION)
FIGURE 22 MARKET SHARE BY COUNTRY
FIGURE 23 EASTERN EUROPE LARGE LANGUAGE MODEL (LLM) CURRENT AND FUTURE TYPE ANALYSIS, 2025–2034, (USD MILLION)
FIGURE 24 EASTERN EUROPE LARGE LANGUAGE MODEL (LLM) CURRENT AND FUTURE END USER ANALYSIS, 2025–2034, (USD MILLION)
FIGURE 25 MARKET SHARE BY COUNTRY
FIGURE 26 WESTERN EUROPE LARGE LANGUAGE MODEL (LLM) CURRENT AND FUTURE TYPE ANALYSIS, 2025–2034, (USD MILLION)
FIGURE 27 WESTERN EUROPE LARGE LANGUAGE MODEL (LLM) CURRENT AND FUTURE END USER ANALYSIS, 2025–2034, (USD MILLION)
FIGURE 28 MARKET SHARE BY COUNTRY
FIGURE 29 EAST ASIA AND PACIFIC LARGE LANGUAGE MODEL (LLM) CURRENT AND FUTURE TYPE ANALYSIS, 2025–2034, (USD MILLION)
FIGURE 30 EAST ASIA AND PACIFIC LARGE LANGUAGE MODEL (LLM) CURRENT AND FUTURE END USER ANALYSIS, 2025–2034, (USD MILLION)
FIGURE 31 MARKET SHARE BY COUNTRY
FIGURE 32 SEA AND SOUTH ASIA LARGE LANGUAGE MODEL (LLM) CURRENT AND FUTURE TYPE ANALYSIS, 2025–2034, (USD MILLION)
FIGURE 33 SEA AND SOUTH ASIA LARGE LANGUAGE MODEL (LLM) CURRENT AND FUTURE END USER ANALYSIS, 2025–2034, (USD MILLION)
FIGURE 34 MARKET SHARE BY COUNTRY
FIGURE 35 MIDDLE EAST AND AFRICA LARGE LANGUAGE MODEL (LLM) CURRENT AND FUTURE TYPE ANALYSIS, 2025–2034, (USD MILLION)
FIGURE 36 MIDDLE EAST AND AFRICA LARGE LANGUAGE MODEL (LLM) CURRENT AND FUTURE END USER ANALYSIS, 2025–2034, (USD MILLION)
FIGURE 37 NORTH AMERICA LARGE LANGUAGE MODEL (LLM) CURRENT AND FUTURE MARKET VOLUME SHARE REGIONAL ANALYSIS, 2025–2034, (USD MILLION)
FIGURE 38 U.S. LARGE LANGUAGE MODEL (LLM) CURRENT AND FUTURE TYPE ANALYSIS, 2025–2034, (USD MILLION)
FIGURE 39 U.S. LARGE LANGUAGE MODEL (LLM) CURRENT AND FUTURE END USER ANALYSIS, 2025–2034, (USD MILLION)
FIGURE 40 CANADA LARGE LANGUAGE MODEL (LLM) CURRENT AND FUTURE TYPE ANALYSIS, 2025–2034, (USD MILLION)
FIGURE 41 CANADA LARGE LANGUAGE MODEL (LLM) CURRENT AND FUTURE END USER ANALYSIS, 2025–2034, (USD MILLION)
FIGURE 42 LATIN AMERICA LARGE LANGUAGE MODEL (LLM) CURRENT AND FUTURE MARKET VOLUME SHARE REGIONAL ANALYSIS, 2025–2034, (USD MILLION)
FIGURE 43 MEXICO LARGE LANGUAGE MODEL (LLM) CURRENT AND FUTURE TYPE ANALYSIS, 2025–2034, (USD MILLION)
FIGURE 44 MEXICO LARGE LANGUAGE MODEL (LLM) CURRENT AND FUTURE END USER ANALYSIS, 2025–2034, (USD MILLION)
FIGURE 45 BRAZIL LARGE LANGUAGE MODEL (LLM) CURRENT AND FUTURE TYPE ANALYSIS, 2025–2034, (USD MILLION)
FIGURE 46 BRAZIL LARGE LANGUAGE MODEL (LLM) CURRENT AND FUTURE END USER ANALYSIS, 2025–2034, (USD MILLION)
FIGURE 47 ARGENTINA LARGE LANGUAGE MODEL (LLM) CURRENT AND FUTURE TYPE ANALYSIS, 2025–2034, (USD MILLION)
FIGURE 48 ARGENTINA LARGE LANGUAGE MODEL (LLM) CURRENT AND FUTURE END USER ANALYSIS, 2025–2034, (USD MILLION)
FIGURE 49 COLUMBIA LARGE LANGUAGE MODEL (LLM) CURRENT AND FUTURE TYPE ANALYSIS, 2025–2034, (USD MILLION)
FIGURE 50 COLUMBIA LARGE LANGUAGE MODEL (LLM) CURRENT AND FUTURE END USER ANALYSIS, 2025–2034, (USD MILLION)
FIGURE 51 REST OF LATIN AMERICA LARGE LANGUAGE MODEL (LLM) CURRENT AND FUTURE TYPE ANALYSIS, 2025–2034, (USD MILLION)
FIGURE 52 REST OF LATIN AMERICA LARGE LANGUAGE MODEL (LLM) CURRENT AND FUTURE END USER ANALYSIS, 2025–2034, (USD MILLION)
FIGURE 53 EASTERN EUROPE LARGE LANGUAGE MODEL (LLM) CURRENT AND FUTURE MARKET VOLUME SHARE REGIONAL ANALYSIS, 2025–2034, (USD MILLION)
FIGURE 54 POLAND LARGE LANGUAGE MODEL (LLM) CURRENT AND FUTURE TYPE ANALYSIS, 2025–2034, (USD MILLION)
FIGURE 55 POLAND LARGE LANGUAGE MODEL (LLM) CURRENT AND FUTURE END USER ANALYSIS, 2025–2034, (USD MILLION)
FIGURE 56 RUSSIA LARGE LANGUAGE MODEL (LLM) CURRENT AND FUTURE TYPE ANALYSIS, 2025–2034, (USD MILLION)
FIGURE 57 RUSSIA LARGE LANGUAGE MODEL (LLM) CURRENT AND FUTURE END USER ANALYSIS, 2025–2034, (USD MILLION)
FIGURE 58 CZECH REPUBLIC LARGE LANGUAGE MODEL (LLM) CURRENT AND FUTURE TYPE ANALYSIS, 2025–2034, (USD MILLION)
FIGURE 59 CZECH REPUBLIC LARGE LANGUAGE MODEL (LLM) CURRENT AND FUTURE END USER ANALYSIS, 2025–2034, (USD MILLION)
FIGURE 60 ROMANIA LARGE LANGUAGE MODEL (LLM) CURRENT AND FUTURE TYPE ANALYSIS, 2025–2034, (USD MILLION)
FIGURE 61 ROMANIA LARGE LANGUAGE MODEL (LLM) CURRENT AND FUTURE END USER ANALYSIS, 2025–2034, (USD MILLION)
FIGURE 62 REST OF EASTERN EUROPE LARGE LANGUAGE MODEL (LLM) CURRENT AND FUTURE TYPE ANALYSIS, 2025–2034, (USD MILLION)
FIGURE 63 REST OF EASTERN EUROPE LARGE LANGUAGE MODEL (LLM) CURRENT AND FUTURE END USER ANALYSIS, 2025–2034, (USD MILLION)
FIGURE 64 WESTERN EUROPE LARGE LANGUAGE MODEL (LLM) CURRENT AND FUTURE MARKET VOLUME SHARE REGIONAL ANALYSIS, 2025–2034, (USD MILLION)
FIGURE 65 GERMANY LARGE LANGUAGE MODEL (LLM) CURRENT AND FUTURE TYPE ANALYSIS, 2025–2034, (USD MILLION)
FIGURE 66 GERMANY LARGE LANGUAGE MODEL (LLM) CURRENT AND FUTURE END USER ANALYSIS, 2025–2034, (USD MILLION)
FIGURE 67 FRANCE LARGE LANGUAGE MODEL (LLM) CURRENT AND FUTURE TYPE ANALYSIS, 2025–2034, (USD MILLION)
FIGURE 68 FRANCE LARGE LANGUAGE MODEL (LLM) CURRENT AND FUTURE END USER ANALYSIS, 2025–2034, (USD MILLION)
FIGURE 69 UK LARGE LANGUAGE MODEL (LLM) CURRENT AND FUTURE TYPE ANALYSIS, 2025–2034, (USD MILLION)
FIGURE 70 UK LARGE LANGUAGE MODEL (LLM) CURRENT AND FUTURE END USER ANALYSIS, 2025–2034, (USD MILLION)
FIGURE 71 SPAIN LARGE LANGUAGE MODEL (LLM) CURRENT AND FUTURE TYPE ANALYSIS, 2025–2034, (USD MILLION)
FIGURE 72 SPAIN LARGE LANGUAGE MODEL (LLM) CURRENT AND FUTURE END USER ANALYSIS, 2025–2034, (USD MILLION)
FIGURE 73 ITALY LARGE LANGUAGE MODEL (LLM) CURRENT AND FUTURE TYPE ANALYSIS, 2025–2034, (USD MILLION)
FIGURE 74 ITALY LARGE LANGUAGE MODEL (LLM) CURRENT AND FUTURE END USER ANALYSIS, 2025–2034, (USD MILLION)
FIGURE 75 REST OF WESTERN EUROPE LARGE LANGUAGE MODEL (LLM) CURRENT AND FUTURE TYPE ANALYSIS, 2025–2034, (USD MILLION)
FIGURE 76 REST OF WESTERN EUROPE LARGE LANGUAGE MODEL (LLM) CURRENT AND FUTURE END USER ANALYSIS, 2025–2034, (USD MILLION)
FIGURE 77 EAST ASIA AND PACIFIC LARGE LANGUAGE MODEL (LLM) CURRENT AND FUTURE MARKET VOLUME SHARE REGIONAL ANALYSIS, 2025–2034, (USD MILLION)
FIGURE 78 CHINA LARGE LANGUAGE MODEL (LLM) CURRENT AND FUTURE TYPE ANALYSIS, 2025–2034, (USD MILLION)
FIGURE 79 CHINA LARGE LANGUAGE MODEL (LLM) CURRENT AND FUTURE END USER ANALYSIS, 2025–2034, (USD MILLION)
FIGURE 80 JAPAN LARGE LANGUAGE MODEL (LLM) CURRENT AND FUTURE TYPE ANALYSIS, 2025–2034, (USD MILLION)
FIGURE 81 JAPAN LARGE LANGUAGE MODEL (LLM) CURRENT AND FUTURE END USER ANALYSIS, 2025–2034, (USD MILLION)
FIGURE 82 AUSTRALIA LARGE LANGUAGE MODEL (LLM) CURRENT AND FUTURE TYPE ANALYSIS, 2025–2034, (USD MILLION)
FIGURE 83 AUSTRALIA LARGE LANGUAGE MODEL (LLM) CURRENT AND FUTURE END USER ANALYSIS, 2025–2034, (USD MILLION)
FIGURE 84 CAMBODIA LARGE LANGUAGE MODEL (LLM) CURRENT AND FUTURE TYPE ANALYSIS, 2025–2034, (USD MILLION)
FIGURE 85 CAMBODIA LARGE LANGUAGE MODEL (LLM) CURRENT AND FUTURE END USER ANALYSIS, 2025–2034, (USD MILLION)
FIGURE 86 FIJI LARGE LANGUAGE MODEL (LLM) CURRENT AND FUTURE TYPE ANALYSIS, 2025–2034, (USD MILLION)
FIGURE 87 FIJI LARGE LANGUAGE MODEL (LLM) CURRENT AND FUTURE END USER ANALYSIS, 2025–2034, (USD MILLION)
FIGURE 88 INDONESIA LARGE LANGUAGE MODEL (LLM) CURRENT AND FUTURE TYPE ANALYSIS, 2025–2034, (USD MILLION)
FIGURE 89 INDONESIA LARGE LANGUAGE MODEL (LLM) CURRENT AND FUTURE END USER ANALYSIS, 2025–2034, (USD MILLION)
FIGURE 90 SOUTH KOREA LARGE LANGUAGE MODEL (LLM) CURRENT AND FUTURE TYPE ANALYSIS, 2025–2034, (USD MILLION)
FIGURE 91 SOUTH KOREA LARGE LANGUAGE MODEL (LLM) CURRENT AND FUTURE END USER ANALYSIS, 2025–2034, (USD MILLION)
FIGURE 92 REST OF EAST ASIA AND PACIFIC LARGE LANGUAGE MODEL (LLM) CURRENT AND FUTURE TYPE ANALYSIS, 2025–2034, (USD MILLION)
FIGURE 93 REST OF EAST ASIA AND PACIFIC LARGE LANGUAGE MODEL (LLM) CURRENT AND FUTURE END USER ANALYSIS, 2025–2034, (USD MILLION)
FIGURE 94 SEA AND SOUTH ASIA LARGE LANGUAGE MODEL (LLM) CURRENT AND FUTURE MARKET VOLUME SHARE REGIONAL ANALYSIS, 2025–2034, (USD MILLION)
FIGURE 95 BANGLADESH LARGE LANGUAGE MODEL (LLM) CURRENT AND FUTURE TYPE ANALYSIS, 2025–2034, (USD MILLION)
FIGURE 96 BANGLADESH LARGE LANGUAGE MODEL (LLM) CURRENT AND FUTURE END USER ANALYSIS, 2025–2034, (USD MILLION)
FIGURE 97 NEW ZEALAND LARGE LANGUAGE MODEL (LLM) CURRENT AND FUTURE TYPE ANALYSIS, 2025–2034, (USD MILLION)
FIGURE 98 NEW ZEALAND LARGE LANGUAGE MODEL (LLM) CURRENT AND FUTURE END USER ANALYSIS, 2025–2034, (USD MILLION)
FIGURE 99 INDIA LARGE LANGUAGE MODEL (LLM) CURRENT AND FUTURE TYPE ANALYSIS, 2025–2034, (USD MILLION)
FIGURE 100 INDIA LARGE LANGUAGE MODEL (LLM) CURRENT AND FUTURE END USER ANALYSIS, 2025–2034, (USD MILLION)
FIGURE 101 SINGAPORE LARGE LANGUAGE MODEL (LLM) CURRENT AND FUTURE TYPE ANALYSIS, 2025–2034, (USD MILLION)
FIGURE 102 SINGAPORE LARGE LANGUAGE MODEL (LLM) CURRENT AND FUTURE END USER ANALYSIS, 2025–2034, (USD MILLION)
FIGURE 103 THAILAND LARGE LANGUAGE MODEL (LLM) CURRENT AND FUTURE TYPE ANALYSIS, 2025–2034, (USD MILLION)
FIGURE 104 THAILAND LARGE LANGUAGE MODEL (LLM) CURRENT AND FUTURE END USER ANALYSIS, 2025–2034, (USD MILLION)
FIGURE 105 TAIWAN LARGE LANGUAGE MODEL (LLM) CURRENT AND FUTURE TYPE ANALYSIS, 2025–2034, (USD MILLION)
FIGURE 106 TAIWAN LARGE LANGUAGE MODEL (LLM) CURRENT AND FUTURE END USER ANALYSIS, 2025–2034, (USD MILLION)
FIGURE 107 MALAYSIA LARGE LANGUAGE MODEL (LLM) CURRENT AND FUTURE TYPE ANALYSIS, 2025–2034, (USD MILLION)
FIGURE 108 MALAYSIA LARGE LANGUAGE MODEL (LLM) CURRENT AND FUTURE END USER ANALYSIS, 2025–2034, (USD MILLION)
FIGURE 109 REST OF SEA AND SOUTH ASIA LARGE LANGUAGE MODEL (LLM) CURRENT AND FUTURE TYPE ANALYSIS, 2025–2034, (USD MILLION)
FIGURE 110 REST OF SEA AND SOUTH ASIA LARGE LANGUAGE MODEL (LLM) CURRENT AND FUTURE END USER ANALYSIS, 2025–2034, (USD MILLION)
FIGURE 111 MIDDLE EAST AND AFRICA LARGE LANGUAGE MODEL (LLM) CURRENT AND FUTURE MARKET VOLUME SHARE REGIONAL ANALYSIS, 2025–2034, (USD MILLION)
FIGURE 112 GCC COUNTRIES LARGE LANGUAGE MODEL (LLM) CURRENT AND FUTURE TYPE ANALYSIS, 2025–2034, (USD MILLION)
FIGURE 113 GCC COUNTRIES LARGE LANGUAGE MODEL (LLM) CURRENT AND FUTURE END USER ANALYSIS, 2025–2034, (USD MILLION)
FIGURE 114 SAUDI ARABIA LARGE LANGUAGE MODEL (LLM) CURRENT AND FUTURE TYPE ANALYSIS, 2025–2034, (USD MILLION)
FIGURE 115 SAUDI ARABIA LARGE LANGUAGE MODEL (LLM) CURRENT AND FUTURE END USER ANALYSIS, 2025–2034, (USD MILLION)
FIGURE 116 UAE LARGE LANGUAGE MODEL (LLM) CURRENT AND FUTURE TYPE ANALYSIS, 2025–2034, (USD MILLION)
FIGURE 117 UAE LARGE LANGUAGE MODEL (LLM) CURRENT AND FUTURE END USER ANALYSIS, 2025–2034, (USD MILLION)
FIGURE 118 BAHRAIN LARGE LANGUAGE MODEL (LLM) CURRENT AND FUTURE TYPE ANALYSIS, 2025–2034, (USD MILLION)
FIGURE 119 BAHRAIN LARGE LANGUAGE MODEL (LLM) CURRENT AND FUTURE END USER ANALYSIS, 2025–2034, (USD MILLION)
FIGURE 120 KUWAIT LARGE LANGUAGE MODEL (LLM) CURRENT AND FUTURE TYPE ANALYSIS, 2025–2034, (USD MILLION)
FIGURE 121 KUWAIT LARGE LANGUAGE MODEL (LLM) CURRENT AND FUTURE END USER ANALYSIS, 2025–2034, (USD MILLION)
FIGURE 122 OMAN LARGE LANGUAGE MODEL (LLM) CURRENT AND FUTURE TYPE ANALYSIS, 2025–2034, (USD MILLION)
FIGURE 123 OMAN LARGE LANGUAGE MODEL (LLM) CURRENT AND FUTURE END USER ANALYSIS, 2025–2034, (USD MILLION)
FIGURE 124 QATAR LARGE LANGUAGE MODEL (LLM) CURRENT AND FUTURE TYPE ANALYSIS, 2025–2034, (USD MILLION)
FIGURE 125 QATAR LARGE LANGUAGE MODEL (LLM) CURRENT AND FUTURE END USER ANALYSIS, 2025–2034, (USD MILLION)
FIGURE 126 EGYPT LARGE LANGUAGE MODEL (LLM) CURRENT AND FUTURE TYPE ANALYSIS, 2025–2034, (USD MILLION)
FIGURE 127 EGYPT LARGE LANGUAGE MODEL (LLM) CURRENT AND FUTURE END USER ANALYSIS, 2025–2034, (USD MILLION)
FIGURE 128 NIGERIA LARGE LANGUAGE MODEL (LLM) CURRENT AND FUTURE TYPE ANALYSIS, 2025–2034, (USD MILLION)
FIGURE 129 NIGERIA LARGE LANGUAGE MODEL (LLM) CURRENT AND FUTURE END USER ANALYSIS, 2025–2034, (USD MILLION)
FIGURE 130 SOUTH AFRICA LARGE LANGUAGE MODEL (LLM) CURRENT AND FUTURE TYPE ANALYSIS, 2025–2034, (USD MILLION)
FIGURE 131 SOUTH AFRICA LARGE LANGUAGE MODEL (LLM) CURRENT AND FUTURE END USER ANALYSIS, 2025–2034, (USD MILLION)
FIGURE 132 ISRAEL LARGE LANGUAGE MODEL (LLM) CURRENT AND FUTURE TYPE ANALYSIS, 2025–2034, (USD MILLION)
FIGURE 133 ISRAEL LARGE LANGUAGE MODEL (LLM) CURRENT AND FUTURE END USER ANALYSIS, 2025–2034, (USD MILLION)
FIGURE 134 REST OF MEA LARGE LANGUAGE MODEL (LLM) CURRENT AND FUTURE TYPE ANALYSIS, 2025–2034, (USD MILLION)
FIGURE 135 REST OF MEA LARGE LANGUAGE MODEL (LLM) CURRENT AND FUTURE END USER ANALYSIS, 2025–2034, (USD MILLION)
FIGURE 136 U. S. MARKET SHARE ANALYSIS BY TYPE (2024)
FIGURE 137 U. S. MARKET SHARE ANALYSIS BY END USER (2024)
FIGURE 138 CANADA MARKET SHARE ANALYSIS BY TYPE (2024)
FIGURE 139 CANADA MARKET SHARE ANALYSIS BY END USER (2024)
FIGURE 140 MEXICO MARKET SHARE ANALYSIS BY TYPE (2024)
FIGURE 141 MEXICO MARKET SHARE ANALYSIS BY END USER (2024)
FIGURE 142 CHINA MARKET SHARE ANALYSIS BY TYPE (2024)
FIGURE 143 CHINA MARKET SHARE ANALYSIS BY END USER (2024)
FIGURE 144 JAPAN MARKET SHARE ANALYSIS BY TYPE (2024)
FIGURE 145 JAPAN MARKET SHARE ANALYSIS BY END USER (2024)
FIGURE 146 INDIA MARKET SHARE ANALYSIS BY TYPE (2024)
FIGURE 147 INDIA MARKET SHARE ANALYSIS BY END USER (2024)
FIGURE 148 SOUTH KOREA MARKET SHARE ANALYSIS BY TYPE (2024)
FIGURE 149 SOUTH KOREA MARKET SHARE ANALYSIS BY END USER (2024)
FIGURE 150 SAUDI ARABIA MARKET SHARE ANALYSIS BY TYPE (2024)
FIGURE 151 SAUDI ARABIA MARKET SHARE ANALYSIS BY END USER (2024)
FIGURE 152 UAE MARKET SHARE ANALYSIS BY TYPE (2024)
FIGURE 153 UAE MARKET SHARE ANALYSIS BY END USER (2024)
FIGURE 154 EGYPT MARKET SHARE ANALYSIS BY TYPE (2024)
FIGURE 155 EGYPT MARKET SHARE ANALYSIS BY END USER (2024)
FIGURE 156 NIGERIA MARKET SHARE ANALYSIS BY TYPE (2024)
FIGURE 157 NIGERIA MARKET SHARE ANALYSIS BY END USER (2024)
FIGURE 158 SOUTH AFRICA MARKET SHARE ANALYSIS BY TYPE (2024)
FIGURE 159 SOUTH AFRICA MARKET SHARE ANALYSIS BY END USER (2024)
FIGURE 160 GERMANY MARKET SHARE ANALYSIS BY TYPE (2024)
FIGURE 161 GERMANY MARKET SHARE ANALYSIS BY END USER (2024)
FIGURE 162 FRANCE MARKET SHARE ANALYSIS BY TYPE (2024)
FIGURE 163 FRANCE MARKET SHARE ANALYSIS BY END USER (2024)
FIGURE 164 UK MARKET SHARE ANALYSIS BY TYPE (2024)
FIGURE 165 UK MARKET SHARE ANALYSIS BY END USER (2024)
FIGURE 166 SPAIN MARKET SHARE ANALYSIS BY TYPE (2024)
FIGURE 167 SPAIN MARKET SHARE ANALYSIS BY END USER (2024)
FIGURE 168 ITALY MARKET SHARE ANALYSIS BY TYPE (2024)
FIGURE 169 ITALY MARKET SHARE ANALYSIS BY END USER (2024)
FIGURE 170 BRAZIL MARKET SHARE ANALYSIS BY TYPE (2024)
FIGURE 171 BRAZIL MARKET SHARE ANALYSIS BY END USER (2024)
FIGURE 172 ARGENTINA MARKET SHARE ANALYSIS BY TYPE (2024)
FIGURE 173 ARGENTINA MARKET SHARE ANALYSIS BY END USER (2024)
FIGURE 174 COLUMBIA MARKET SHARE ANALYSIS BY TYPE (2024)
FIGURE 175 COLUMBIA MARKET SHARE ANALYSIS BY END USER (2024)
FIGURE 176 GLOBAL LARGE LANGUAGE MODEL (LLM) CURRENT AND FUTURE MARKET KEY COUNTRY LEVEL ANALYSIS, 2024–2034, (USD MILLION)
FIGURE 177 FINANCIAL OVERVIEW:
Key Player Analysis
Alibaba Group Holding Limited: Alibaba positions as a challenger in enterprise LLMs within Asia. The company anchors its AI stack on Tongyi models integrated across Alibaba Cloud, DingTalk, and e-commerce operations. In 2025, Alibaba Cloud focuses on LLM platform services, inference cost reduction, and enterprise-grade governance. The firm expands partnerships with local governments and SMEs for domain-specific models in retail, logistics, and financial services. Differentiators include deep integration with commerce data, strong presence in Southeast Asia, and competitive pricing for inference workloads. You should watch Alibaba’s push into vertical LLMs for merchandizing, supply chain planning, and multilingual customer support, supported by growing cloud uptake in Asia and improved margin discipline.
Baidu, Inc.: Baidu is a leader in China’s LLM ecosystem with the ERNIE family and the Qianfan AI Cloud platform. The company scales enterprise deployments through model fine-tuning tools, data governance, and lower-cost inference. In 2025, Baidu links ERNIE to autonomous driving and search advertising data, improving domain accuracy and monetization. Strategic initiatives include expanding Qianfan’s managed services, deeper partnerships with state-owned enterprises, and cost-focused model variants for regulated industries. Differentiators are strong Chinese-language performance, integrated AI Cloud delivery, and a data-rich portfolio across maps, mobility, and search. Baidu’s pricing and latency improvements position it to gain enterprise share as you seek predictable TCO and rapid deployment.
Google LLC: Google is a global leader with the Gemini model suite, Vertex AI, and strong multimodal capabilities. In 2025, Google prioritizes enterprise readiness through governance, responsible AI tooling, and private model endpoints. Strategic moves include expanding Vertex AI’s agentic workflows, adding model evaluation pipelines, and bringing enterprise connectors across Google Workspace and industry data platforms. Differentiation comes from superior search grounding, multilingual robustness, and tight integration with cloud-native MLOps. Google’s scale in developer tools and enterprise security helps you drive adoption across customer service, content generation, and analytics. The company’s focus on cost-efficient serving and retrieval augmentation supports regulated deployments and complex knowledge tasks.
Huawei Technologies Co., Ltd.: Huawei is a niche-to-challenger player in China and select international markets, emphasizing on-premise and edge AI deployments. The company advances the Pangu and class-specific models tailored for telecom, manufacturing, and government use. In 2025, Huawei invests in hardware-software co-design, including AI accelerators, distributed training, and low-latency inference on proprietary infrastructure. Strategic initiatives center on sovereign AI, private cloud, and industry blueprints for compliance-heavy sectors. Differentiators include strong performance in Chinese-language tasks, robust on-premise delivery, and deep integration with telecom networks and industrial IoT. For you, Huawei’s R&D focus on cost control and energy efficiency makes it a contender in infrastructure-bound environments that require strict data residency and offline capabilities.
Market Key Players
Microsoft Corporation
Baidu, Inc.
NVIDIA
Amazon Web Services (AWS)
Huawei Technologies Co., Ltd.
Meta Platforms, Inc.
IBM Corporation
OpenAI LP
Google LLC
Tencent Holdings Limited
Alibaba Group Holding Limited
Other Key Players
Driver:
Enterprise-Scale LLM Adoption Drives Productivity and Cost Efficiency
As of 2025, enterprises are moving from pilots to scaled LLM deployments in customer operations, commerce, and developer workflows. Adoption is now mainstream, with 67% of organizations using generative AI products powered by LLMs and nearly 50% reporting deployment cycles of 1–4 months. Long-context models that handle up to 1 million tokens enable full-document review, policy checks, and knowledge management. Smaller high-precision models, such as a 2.7‑billion‑parameter class, now outperform larger peers on targeted coding tasks, cutting inference costs per job. For you, the result is faster throughput, lower handling time per ticket, and measurable productivity lift in content, code, and service. These effects support top-line growth via better conversion and retention, while protecting gross margin through automation of repetitive tasks.
Restraint:
High Total Cost of Ownership and Governance Requirements Constrain Scale
Total cost of ownership remains the gating factor. Training and inference on frontier models drive volatile token spend, GPU scarcity premiums, and budget overruns. Only 23% of companies deploy or plan to deploy commercial models at scale, reflecting privacy, data residency, and IP risk. Regulated buyers require audit trails, explainability, and role-based access, which add 8–12% to program costs in Year 1. Talent constraints persist in prompt engineering, evaluation, and ML ops, slowing time-to-value and raising integration risk. For your portfolio, this means tighter guardrails, staged rollouts, and cost controls such as prompt libraries, caching, and evaluation harnesses before expanding seats.
Opportunity:
Domain-Specific and Multilingual LLMs Unlock High-ROI Use Cases
Underserved languages and domain-specific instruction tuning present near-term upside. Non‑English markets can add [USD 1.2–1.8 billion] in incremental 2026–2028 revenue with focused pretraining and high-quality local corpora. Sector depth offers outsized returns. Healthcare coding, clinical summarization, and prior‑auth automation can deliver 15–25% cycle-time reductions; legal drafting and review can cut memo and clause-standardization time by 20–30%. Customer operations remain the budget magnet as deflection rates improve 8–15% with retrieval‑augmented responses. A pragmatic target: a global LLM market near USD 7.6–8.6 billion in 2025 with 30–36% CAGR through 2032–2034, driven by productized assistants for agents, analysts, and developers. If you focus on measurable outcomes and data pipelines, you can capture share while reducing inference spend per task.
Trend:
Multimodality, Edge Inference, and Built-In Governance Shape 2025 Roadmaps
Three shifts define 2025. Multimodal LLMs link text with images, audio, and structured data, enabling claims triage, product search, and marketing asset QA in one workflow; early adopters report 10–20% throughput gains. On‑device and edge inference grows for latency and privacy, with compact models handling redaction, intent, and summarization locally; this cuts round‑trip latency below 150 ms for real-time use. Finally, safety and governance become product features. Evaluation benchmarks, content filters, and policy engines ship by default, shortening enterprise approvals and unlocking contracts in finance and healthcare. For your roadmap, combine long‑context APIs, retrieval layers, and small specialized models to hit service-level targets while keeping unit costs predictable.
Recent Developments
Dec 2024 – OpenAI: Announced GPT-4.1 Enterprise with private endpoints, audit logging, and upgraded retrieval features for regulated industries. Early pilots reported a 25–40% reduction in support resolution times and a 15% cut in content operations costs. Strengthens OpenAI’s enterprise positioning with compliance-ready tooling and measurable ROI.
Feb 2025 – Microsoft: Launched Azure OpenAI Service in EU sovereign cloud with dedicated compute and data residency guarantees. The rollout covers 14 EU markets and targets public sector and financial services; initial contracts are valued at over USD 250 million. Expands Microsoft’s addressable market in compliance-heavy regions and improves win rates against local cloud providers.
Apr 2025 – Google: Released Gemini 2.0 Enterprise on Vertex AI with agentic workflows, integrated evaluation pipelines, and connectors across Workspace and BigQuery. Customers reported up to 30% lower inference costs and 20% faster deployment cycles in pilot programs. Reinforces Google’s lead in multimodal enterprise use cases and accelerates adoption in analytics and customer service.
Jul 2025 – Anthropic: Introduced Claude 3.5 with enterprise controls for data retention, red-teaming, and domain fine-tuning on AWS and Google Cloud. Announced partnerships with three global banks and two telecom operators; year-to-date ARR is estimated at USD 600–700 million. Improves Anthropic’s credibility in regulated sectors and deepens cloud-aligned distribution.
Sep 2025 – Amazon: Expanded Bedrock with managed retrieval augmentation and agent frameworks, plus broader access to Mistral and Cohere models. Reported over 30,000 Bedrock customers, with usage up ~80% year-to-date; unveiled Amazon Q for enterprise knowledge work across 20 countries. Strengthens Amazon’s platform play and drives cross-sell across AWS data and application services.