Global Lifestyle Sneaker Market Size, Share & Industry Analysis By Product Type (Low-Top, Mid-Top, High-Top), By Category (Men, Women, Kids), By Distribution Channel (Online Retail, Specialty Stores, Brand Outlets), By Price Range (Mass, Premium, Limited Edition), By End Use (Casual Wear, Streetwear, Athleisure), Region & Key Players – Market Dynamics, Consumer Trends, Competitive Landscape, Brand Strategies & Forecast 2025–2034
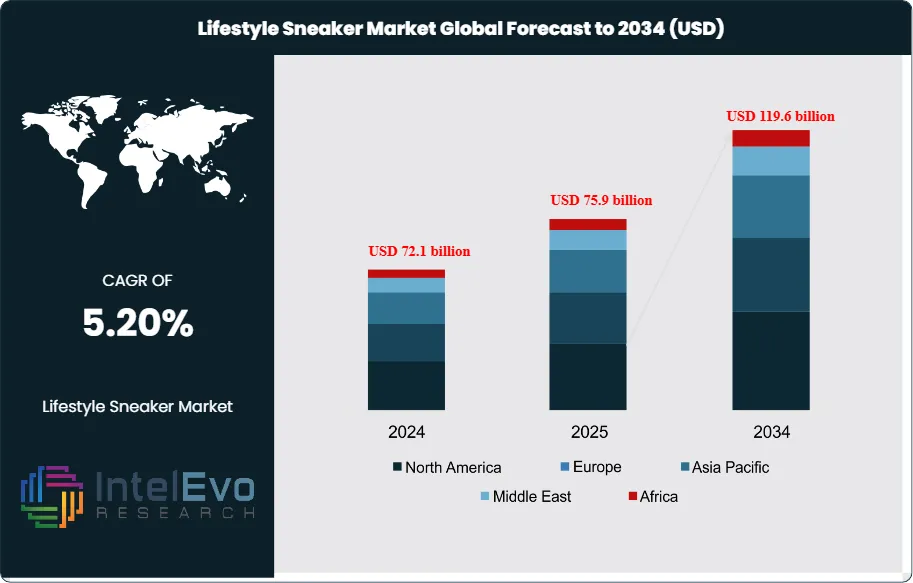
The Lifestyle Sneaker Market is estimated at USD 72.1 billion in 2024 and is on track to reach roughly USD 119.6 billion by 2034, implying a compound annual growth rate of 5.2% over 2025–2034. This growth is driven by the convergence of fashion, sportswear, and street culture, with sneakers increasingly positioned as everyday lifestyle essentials rather than purely athletic footwear. Rising influence of social media, celebrity collaborations, and limited-edition drops is accelerating demand, while younger consumers continue to prioritize comfort, brand identity, and customization. Expansion of direct-to-consumer channels and premiumization trends are further strengthening long-term market momentum across both developed and emerging economies.
Lifestyle sneakers sit at the intersection of fashion and casual footwear. They deliver comfort, style, and versatility for daily use rather than performance sport. Demand intensifies as dress codes relax and athleisure and streetwear move into workplaces. Younger consumers lead this shift and curate large collections; in the United States, individuals now own about 19 pairs of shoes on average, with lifestyle models taking a rising share of spend.
Macroeconomic conditions support this category. Rising disposable income enables greater spending on branded footwear. In the United States, disposable personal income grew about 3% in 2024, helping households sustain purchase frequency despite inflationary pressure. An influential sneakerhead community amplifies demand. About 8% of buyers identify with this group, yet 33% of them shop monthly, while roughly 66% of mass-market consumers purchase sneakers twice a year or less. Targeted drops, collaborations, and limited releases allow brands to capture price premiums and deepen loyalty in this segment.
Supply-side dynamics remain intense. Global majors compete with agile niche labels, relying on outsourced production clusters across Asia for scale and cost efficiency. Digital channels reshape route-to-market. In 2020, online sales accounted for about 27% of U.S. shoe revenue, and this share continues to climb as e-commerce platforms and sneaker trading apps expand. Brands deploy AI-based recommendation engines, demand-forecasting tools, and automated fulfillment to reduce stockouts, shorten design cycles, and tailor assortments across direct-to-consumer and wholesale channels.
Regulatory and risk factors grow more prominent. Stricter environmental standards push brands toward recycled materials, traceable supply chains, and transparent labor practices, raising compliance costs but also enabling premium positioning. Trade policy shifts and currency volatility can affect input pricing and margins, while intellectual property enforcement remains critical against counterfeits. Regionally, North America and Europe show signs of saturation with high per-capita ownership, whereas Asia Pacific, Latin America, and the Middle East present faster growth, underpinned by urbanization, rising incomes, and an expanding middle class. These structural drivers, combined with digital and design innovation, position lifestyle sneakers as a resilient yet highly competitive investment theme through 2034.
Key Takeaways
Market Growth: The lifestyle sneaker market stands at USD 72.1 billion in 2024 and will reach USD 119.6 billion by 2034, implying a CAGR of 5.2% over 2025-2034.
Product Type: Low-top sneakers lead the product mix with a 62.1% share, 2023 as consumers favor casual, versatile designs for daily wear.
Price Range: The under 50 USD, 2023 price band captures 32.5% share, 2023 and anchors volume growth in cost-sensitive consumer segments.
Driver: Men account for 56.3% share of end-user spending, 2023 and drive repeat purchases as lifestyle sneakers replace other casual footwear in male wardrobes.
Restraint: Heavy reliance on offline channels, which hold 69.2% of sales, 2023, constrains digital reach and increases exposure to fluctuations in store traffic.
Opportunity: Online and omnichannel models gain room to scale as the remaining estimated: 30.8% share, 2023 of sales migrates to digital platforms that can broaden assortments and enhance data-driven merchandising.
Trend: Emerging segments, including women and younger consumers, represent estimated: 43.7% share, 2023 of demand and will reinforce style-led collections that track a 5.2% category CAGR over 2024-2034.
Regional Analysis: North America leads with 34.2% market share, 2023, while Asia-Pacific could reach estimated: 30.0% share, 2030 as urbanization and income growth accelerate lifestyle sneaker adoption.
By Product Type
The lifestyle sneaker market in 2025 continues to see low-top models positioned as the primary choice for most consumers. They hold more than 60 percent of global volume and appeal to buyers who want shoes suited for daily movement, travel, or casual work settings. You see steady demand for this category because it offers comfort, neutral styling, and wide availability across premium, midrange, and entry-level brands. As athleisure remains part of everyday wardrobes, low-top sneakers fit multiple use cases without adding weight or bulk.
Mid-top sneakers maintain a smaller share but attract shoppers who want extra ankle coverage without committing to full high-top designs. Casual athletes and urban commuters often choose this segment. Brands use this space to test new materials and hybrid designs that sit between sport and lifestyle footwear. Growth remains moderate, but interest has risen in markets where consumers seek practical alternatives to full athletic shoes.
High-top sneakers continue to serve a niche audience. They appeal to collectors, retro-fashion buyers, and consumers who follow drop cycles closely. The price points tend to be higher due to materials, collaborative releases, and limited production runs. Although overall adoption is lower than other types, high-tops contribute to brand visibility and help companies strengthen relationships with sneaker communities worldwide.
By Application
Pavers represent a major application for lifestyle sneakers as buyers prioritize shoes that support long hours of walking in urban environments. You see the strongest demand in cities with high pedestrian traffic where residents depend on comfortable footwear for daily mobility. Brands focus on cushioning technologies and flexible materials to strengthen this usage segment. Market traction improves as consumers shift from traditional leather shoes to lightweight casual models.
Retaining wall environments such as rugged outdoor areas or work-adjacent spaces call for footwear with stronger support. Mid-top and selected high-top models gain attention in this segment due to their stability. Although smaller in volume, this application attracts consistent interest from professional users, hobbyists, and buyers in emerging markets where multipurpose footwear remains important.
Other applications, including light recreation, travel, and school use, continue to grow as global buyers look for versatile shoes that fit multiple parts of their daily routines. This segment benefits from year-round replacement cycles and rising adoption among younger consumers who prefer casual footwear over formal shoes.
By End-Use
Men remain the largest end-user group in 2025 and account for more than half of global purchases. Many prefer lifestyle sneakers that work across work, social, and weekend settings. You see strong interest in sport-inspired silhouettes, limited releases, and collaborations that target collectors and frequent buyers. Repeat purchasing is common, which keeps the men’s segment at the front of market expansion.
Women represent a growing base as athleisure and comfortable fashion continue to gain attention worldwide. Brands are widening color palettes, sizing options, and fit designs to match this shift. Adoption rises sharply in Asia and Europe, where fashion-conscious buyers replace traditional flats with casual sneakers for daily wear. This segment presents meaningful upside through 2030.
The children’s category is smaller but stable. Parents value durability and practicality, leading to consistent year-to-year sales. Growth improves in markets where school dress codes shift toward casual footwear. You also see higher replacement frequency due to rapid size changes, which helps maintain steady demand.
By Region
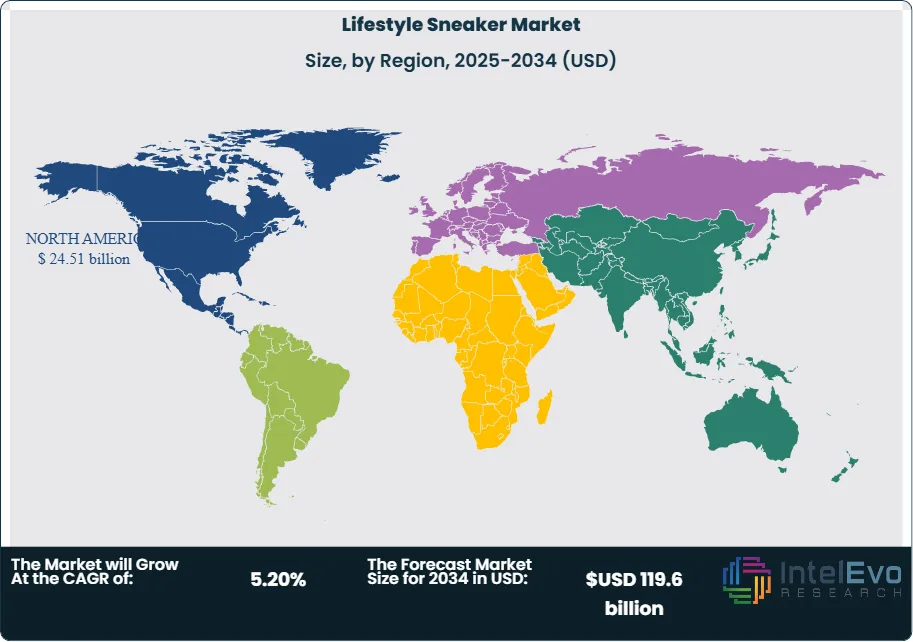
North America holds the largest share at more than 34 percent in 2025. The United States anchors this position due to strong sneaker culture, high disposable income, and active participation in limited-edition releases. Retail networks across specialty stores, brand outlets, and digital platforms give consumers wide access to new collections. You also see higher adoption of premium materials and exclusive drops, which strengthens revenue per pair.
Europe follows with strong penetration in markets such as Germany, the United Kingdom, and France. Buyers emphasize comfort and durability and have increased interest in environmentally conscious materials. Demand for lifestyle sneakers aligns with broader preferences for casual workwear, which supports sustained regional expansion.
Asia Pacific represents the fastest-growing market. Rising incomes, expanding urban populations, and increasing exposure to global fashion trends make this region a key growth engine. China, India, and Southeast Asia show high adoption among younger consumers who follow influencer-led styles. Latin America and the Middle East & Africa maintain smaller shares but continue to improve as retail distribution expands and online purchasing accelerates.
By Product Type, Low-Top Sneakers, Mid-Top Sneakers, High-Top Sneakers, By End-User, Men, Women, Children, By Price Range, $0-$50, $50-$100, $100-$200, $200-$300, $300 and above, By Distribution Channel, Online Stores, Department Stores, Specialty Stores, Brand Outlets, Discount Stores
Research Methodology
Primary Research- 100 Interviews of Stakeholders
Secondary Research
Desk Research
Regional scope
North America (United States, Canada, Mexico)
Latin America (Brazil, Argentina, Columbia)
East Asia And Pacific (China, Japan, South Korea, Australia, Cambodia, Fiji, Indonesia)
Sea And South Asia (India, Singapore, Thailand, Taiwan, Malaysia)
Eastern Europe (Poland, Russia, Czech Republic, Romania)
Western Europe (Germany, U.K., France, Spain, Itlay)
Middle East & Africa (GCC Countries, Egypt, Nigeria, South Africa, Israel)
Competitive Landscape
Nike, Inc., Adidas AG, Puma SE, New Balance Athletics, Inc., Under Armour, Inc., ASICS Corporation, Skechers USA, Inc., Reebok International Ltd. (a subsidiary of Authentic Brands Group), Fila Holdings Corp., Converse Inc. (a subsidiary of Nike, Inc.), Vans (VF Corporation), Jordan Brand (Nike, Inc.), Saucony (Wolverine World Wide, Inc.), Brooks Sports, Inc. (lifestyle segment crossover), Diadora S.p.A., K-Swiss (a division of E-Land Group), On Running AG, Hoka One One (Deckers Outdoor Corporation), Crocs, Inc. (lifestyle crossover relevance), Balenciaga (Kering Group), Gucci (Kering Group) , Louis Vuitton (LVMH),
Customization Scope
Customization for segments, region/country-level will be provided. Moreover, additional customization can be done based on the requirements.
Pricing and Purchase Options
Avail customized purchase options to meet your exact research needs. We have three licenses to opt for: Single User License, Multi-User License (Up to 5 Users), Corporate Use License (Unlimited User and Printable PDF).
TABLE OF CONTENTS
1. EXECUTIVE SUMMARY
1.1. MARKET SNAPSHOT
1.2. KEY FINDINGS & INSIGHTS
1.3. ANALYST RECOMMENDATIONS
1.4. FUTURE OUTLOOK
2. RESEARCH METHODOLOGY
2.1. MARKET DEFINITION & SCOPE
2.2. RESEARCH OBJECTIVES: PRIMARY & SECONDARY DATA SOURCES
2.3. DATA COLLECTION SOURCES
2.3.1. COVERAGE OF 100+ PRIMARY RESEARCH/CONSULTATION CALLS WITH INDUSTRY STAKEHOLDERS
FIGURE 17 NORTH AMERICA LIFESTYLE SNEAKER CURRENT AND FUTURE TYPE ANALYSIS, 2025–2034, (USD MILLION)
FIGURE 18 NORTH AMERICA LIFESTYLE SNEAKER CURRENT AND FUTURE END USER ANALYSIS, 2025–2034, (USD MILLION)
FIGURE 19 MARKET SHARE BY COUNTRY
FIGURE 20 LATIN AMERICA LIFESTYLE SNEAKER CURRENT AND FUTURE TYPE ANALYSIS, 2025–2034, (USD MILLION)
FIGURE 21 LATIN AMERICA LIFESTYLE SNEAKER CURRENT AND FUTURE END USER ANALYSIS, 2025–2034, (USD MILLION)
FIGURE 22 MARKET SHARE BY COUNTRY
FIGURE 23 EASTERN EUROPE LIFESTYLE SNEAKER CURRENT AND FUTURE TYPE ANALYSIS, 2025–2034, (USD MILLION)
FIGURE 24 EASTERN EUROPE LIFESTYLE SNEAKER CURRENT AND FUTURE END USER ANALYSIS, 2025–2034, (USD MILLION)
FIGURE 25 MARKET SHARE BY COUNTRY
FIGURE 26 WESTERN EUROPE LIFESTYLE SNEAKER CURRENT AND FUTURE TYPE ANALYSIS, 2025–2034, (USD MILLION)
FIGURE 27 WESTERN EUROPE LIFESTYLE SNEAKER CURRENT AND FUTURE END USER ANALYSIS, 2025–2034, (USD MILLION)
FIGURE 28 MARKET SHARE BY COUNTRY
FIGURE 29 EAST ASIA AND PACIFIC LIFESTYLE SNEAKER CURRENT AND FUTURE TYPE ANALYSIS, 2025–2034, (USD MILLION)
FIGURE 30 EAST ASIA AND PACIFIC LIFESTYLE SNEAKER CURRENT AND FUTURE END USER ANALYSIS, 2025–2034, (USD MILLION)
FIGURE 31 MARKET SHARE BY COUNTRY
FIGURE 32 SEA AND SOUTH ASIA LIFESTYLE SNEAKER CURRENT AND FUTURE TYPE ANALYSIS, 2025–2034, (USD MILLION)
FIGURE 33 SEA AND SOUTH ASIA LIFESTYLE SNEAKER CURRENT AND FUTURE END USER ANALYSIS, 2025–2034, (USD MILLION)
FIGURE 34 MARKET SHARE BY COUNTRY
FIGURE 35 MIDDLE EAST AND AFRICA LIFESTYLE SNEAKER CURRENT AND FUTURE TYPE ANALYSIS, 2025–2034, (USD MILLION)
FIGURE 36 MIDDLE EAST AND AFRICA LIFESTYLE SNEAKER CURRENT AND FUTURE END USER ANALYSIS, 2025–2034, (USD MILLION)
FIGURE 37 NORTH AMERICA LIFESTYLE SNEAKER CURRENT AND FUTURE MARKET VOLUME SHARE REGIONAL ANALYSIS, 2025–2034, (USD MILLION)
FIGURE 38 U.S. LIFESTYLE SNEAKER CURRENT AND FUTURE TYPE ANALYSIS, 2025–2034, (USD MILLION)
FIGURE 39 U.S. LIFESTYLE SNEAKER CURRENT AND FUTURE END USER ANALYSIS, 2025–2034, (USD MILLION)
FIGURE 40 CANADA LIFESTYLE SNEAKER CURRENT AND FUTURE TYPE ANALYSIS, 2025–2034, (USD MILLION)
FIGURE 41 CANADA LIFESTYLE SNEAKER CURRENT AND FUTURE END USER ANALYSIS, 2025–2034, (USD MILLION)
FIGURE 42 LATIN AMERICA LIFESTYLE SNEAKER CURRENT AND FUTURE MARKET VOLUME SHARE REGIONAL ANALYSIS, 2025–2034, (USD MILLION)
FIGURE 43 MEXICO LIFESTYLE SNEAKER CURRENT AND FUTURE TYPE ANALYSIS, 2025–2034, (USD MILLION)
FIGURE 44 MEXICO LIFESTYLE SNEAKER CURRENT AND FUTURE END USER ANALYSIS, 2025–2034, (USD MILLION)
FIGURE 45 BRAZIL LIFESTYLE SNEAKER CURRENT AND FUTURE TYPE ANALYSIS, 2025–2034, (USD MILLION)
FIGURE 46 BRAZIL LIFESTYLE SNEAKER CURRENT AND FUTURE END USER ANALYSIS, 2025–2034, (USD MILLION)
FIGURE 47 ARGENTINA LIFESTYLE SNEAKER CURRENT AND FUTURE TYPE ANALYSIS, 2025–2034, (USD MILLION)
FIGURE 48 ARGENTINA LIFESTYLE SNEAKER CURRENT AND FUTURE END USER ANALYSIS, 2025–2034, (USD MILLION)
FIGURE 49 COLUMBIA LIFESTYLE SNEAKER CURRENT AND FUTURE TYPE ANALYSIS, 2025–2034, (USD MILLION)
FIGURE 50 COLUMBIA LIFESTYLE SNEAKER CURRENT AND FUTURE END USER ANALYSIS, 2025–2034, (USD MILLION)
FIGURE 51 REST OF LATIN AMERICA LIFESTYLE SNEAKER CURRENT AND FUTURE TYPE ANALYSIS, 2025–2034, (USD MILLION)
FIGURE 52 REST OF LATIN AMERICA LIFESTYLE SNEAKER CURRENT AND FUTURE END USER ANALYSIS, 2025–2034, (USD MILLION)
FIGURE 53 EASTERN EUROPE LIFESTYLE SNEAKER CURRENT AND FUTURE MARKET VOLUME SHARE REGIONAL ANALYSIS, 2025–2034, (USD MILLION)
FIGURE 54 POLAND LIFESTYLE SNEAKER CURRENT AND FUTURE TYPE ANALYSIS, 2025–2034, (USD MILLION)
FIGURE 55 POLAND LIFESTYLE SNEAKER CURRENT AND FUTURE END USER ANALYSIS, 2025–2034, (USD MILLION)
FIGURE 56 RUSSIA LIFESTYLE SNEAKER CURRENT AND FUTURE TYPE ANALYSIS, 2025–2034, (USD MILLION)
FIGURE 57 RUSSIA LIFESTYLE SNEAKER CURRENT AND FUTURE END USER ANALYSIS, 2025–2034, (USD MILLION)
FIGURE 58 CZECH REPUBLIC LIFESTYLE SNEAKER CURRENT AND FUTURE TYPE ANALYSIS, 2025–2034, (USD MILLION)
FIGURE 59 CZECH REPUBLIC LIFESTYLE SNEAKER CURRENT AND FUTURE END USER ANALYSIS, 2025–2034, (USD MILLION)
FIGURE 60 ROMANIA LIFESTYLE SNEAKER CURRENT AND FUTURE TYPE ANALYSIS, 2025–2034, (USD MILLION)
FIGURE 61 ROMANIA LIFESTYLE SNEAKER CURRENT AND FUTURE END USER ANALYSIS, 2025–2034, (USD MILLION)
FIGURE 62 REST OF EASTERN EUROPE LIFESTYLE SNEAKER CURRENT AND FUTURE TYPE ANALYSIS, 2025–2034, (USD MILLION)
FIGURE 63 REST OF EASTERN EUROPE LIFESTYLE SNEAKER CURRENT AND FUTURE END USER ANALYSIS, 2025–2034, (USD MILLION)
FIGURE 64 WESTERN EUROPE LIFESTYLE SNEAKER CURRENT AND FUTURE MARKET VOLUME SHARE REGIONAL ANALYSIS, 2025–2034, (USD MILLION)
FIGURE 65 GERMANY LIFESTYLE SNEAKER CURRENT AND FUTURE TYPE ANALYSIS, 2025–2034, (USD MILLION)
FIGURE 66 GERMANY LIFESTYLE SNEAKER CURRENT AND FUTURE END USER ANALYSIS, 2025–2034, (USD MILLION)
FIGURE 67 FRANCE LIFESTYLE SNEAKER CURRENT AND FUTURE TYPE ANALYSIS, 2025–2034, (USD MILLION)
FIGURE 68 FRANCE LIFESTYLE SNEAKER CURRENT AND FUTURE END USER ANALYSIS, 2025–2034, (USD MILLION)
FIGURE 69 UK LIFESTYLE SNEAKER CURRENT AND FUTURE TYPE ANALYSIS, 2025–2034, (USD MILLION)
FIGURE 70 UK LIFESTYLE SNEAKER CURRENT AND FUTURE END USER ANALYSIS, 2025–2034, (USD MILLION)
FIGURE 71 SPAIN LIFESTYLE SNEAKER CURRENT AND FUTURE TYPE ANALYSIS, 2025–2034, (USD MILLION)
FIGURE 72 SPAIN LIFESTYLE SNEAKER CURRENT AND FUTURE END USER ANALYSIS, 2025–2034, (USD MILLION)
FIGURE 73 ITALY LIFESTYLE SNEAKER CURRENT AND FUTURE TYPE ANALYSIS, 2025–2034, (USD MILLION)
FIGURE 74 ITALY LIFESTYLE SNEAKER CURRENT AND FUTURE END USER ANALYSIS, 2025–2034, (USD MILLION)
FIGURE 75 REST OF WESTERN EUROPE LIFESTYLE SNEAKER CURRENT AND FUTURE TYPE ANALYSIS, 2025–2034, (USD MILLION)
FIGURE 76 REST OF WESTERN EUROPE LIFESTYLE SNEAKER CURRENT AND FUTURE END USER ANALYSIS, 2025–2034, (USD MILLION)
FIGURE 77 EAST ASIA AND PACIFIC LIFESTYLE SNEAKER CURRENT AND FUTURE MARKET VOLUME SHARE REGIONAL ANALYSIS, 2025–2034, (USD MILLION)
FIGURE 78 CHINA LIFESTYLE SNEAKER CURRENT AND FUTURE TYPE ANALYSIS, 2025–2034, (USD MILLION)
FIGURE 79 CHINA LIFESTYLE SNEAKER CURRENT AND FUTURE END USER ANALYSIS, 2025–2034, (USD MILLION)
FIGURE 80 JAPAN LIFESTYLE SNEAKER CURRENT AND FUTURE TYPE ANALYSIS, 2025–2034, (USD MILLION)
FIGURE 81 JAPAN LIFESTYLE SNEAKER CURRENT AND FUTURE END USER ANALYSIS, 2025–2034, (USD MILLION)
FIGURE 82 AUSTRALIA LIFESTYLE SNEAKER CURRENT AND FUTURE TYPE ANALYSIS, 2025–2034, (USD MILLION)
FIGURE 83 AUSTRALIA LIFESTYLE SNEAKER CURRENT AND FUTURE END USER ANALYSIS, 2025–2034, (USD MILLION)
FIGURE 84 CAMBODIA LIFESTYLE SNEAKER CURRENT AND FUTURE TYPE ANALYSIS, 2025–2034, (USD MILLION)
FIGURE 85 CAMBODIA LIFESTYLE SNEAKER CURRENT AND FUTURE END USER ANALYSIS, 2025–2034, (USD MILLION)
FIGURE 86 FIJI LIFESTYLE SNEAKER CURRENT AND FUTURE TYPE ANALYSIS, 2025–2034, (USD MILLION)
FIGURE 87 FIJI LIFESTYLE SNEAKER CURRENT AND FUTURE END USER ANALYSIS, 2025–2034, (USD MILLION)
FIGURE 88 INDONESIA LIFESTYLE SNEAKER CURRENT AND FUTURE TYPE ANALYSIS, 2025–2034, (USD MILLION)
FIGURE 89 INDONESIA LIFESTYLE SNEAKER CURRENT AND FUTURE END USER ANALYSIS, 2025–2034, (USD MILLION)
FIGURE 90 SOUTH KOREA LIFESTYLE SNEAKER CURRENT AND FUTURE TYPE ANALYSIS, 2025–2034, (USD MILLION)
FIGURE 91 SOUTH KOREA LIFESTYLE SNEAKER CURRENT AND FUTURE END USER ANALYSIS, 2025–2034, (USD MILLION)
FIGURE 92 REST OF EAST ASIA AND PACIFIC LIFESTYLE SNEAKER CURRENT AND FUTURE TYPE ANALYSIS, 2025–2034, (USD MILLION)
FIGURE 93 REST OF EAST ASIA AND PACIFIC LIFESTYLE SNEAKER CURRENT AND FUTURE END USER ANALYSIS, 2025–2034, (USD MILLION)
FIGURE 94 SEA AND SOUTH ASIA LIFESTYLE SNEAKER CURRENT AND FUTURE MARKET VOLUME SHARE REGIONAL ANALYSIS, 2025–2034, (USD MILLION)
FIGURE 95 BANGLADESH LIFESTYLE SNEAKER CURRENT AND FUTURE TYPE ANALYSIS, 2025–2034, (USD MILLION)
FIGURE 96 BANGLADESH LIFESTYLE SNEAKER CURRENT AND FUTURE END USER ANALYSIS, 2025–2034, (USD MILLION)
FIGURE 97 NEW ZEALAND LIFESTYLE SNEAKER CURRENT AND FUTURE TYPE ANALYSIS, 2025–2034, (USD MILLION)
FIGURE 98 NEW ZEALAND LIFESTYLE SNEAKER CURRENT AND FUTURE END USER ANALYSIS, 2025–2034, (USD MILLION)
FIGURE 99 INDIA LIFESTYLE SNEAKER CURRENT AND FUTURE TYPE ANALYSIS, 2025–2034, (USD MILLION)
FIGURE 100 INDIA LIFESTYLE SNEAKER CURRENT AND FUTURE END USER ANALYSIS, 2025–2034, (USD MILLION)
FIGURE 101 SINGAPORE LIFESTYLE SNEAKER CURRENT AND FUTURE TYPE ANALYSIS, 2025–2034, (USD MILLION)
FIGURE 102 SINGAPORE LIFESTYLE SNEAKER CURRENT AND FUTURE END USER ANALYSIS, 2025–2034, (USD MILLION)
FIGURE 103 THAILAND LIFESTYLE SNEAKER CURRENT AND FUTURE TYPE ANALYSIS, 2025–2034, (USD MILLION)
FIGURE 104 THAILAND LIFESTYLE SNEAKER CURRENT AND FUTURE END USER ANALYSIS, 2025–2034, (USD MILLION)
FIGURE 105 TAIWAN LIFESTYLE SNEAKER CURRENT AND FUTURE TYPE ANALYSIS, 2025–2034, (USD MILLION)
FIGURE 106 TAIWAN LIFESTYLE SNEAKER CURRENT AND FUTURE END USER ANALYSIS, 2025–2034, (USD MILLION)
FIGURE 107 MALAYSIA LIFESTYLE SNEAKER CURRENT AND FUTURE TYPE ANALYSIS, 2025–2034, (USD MILLION)
FIGURE 108 MALAYSIA LIFESTYLE SNEAKER CURRENT AND FUTURE END USER ANALYSIS, 2025–2034, (USD MILLION)
FIGURE 109 REST OF SEA AND SOUTH ASIA LIFESTYLE SNEAKER CURRENT AND FUTURE TYPE ANALYSIS, 2025–2034, (USD MILLION)
FIGURE 110 REST OF SEA AND SOUTH ASIA LIFESTYLE SNEAKER CURRENT AND FUTURE END USER ANALYSIS, 2025–2034, (USD MILLION)
FIGURE 111 MIDDLE EAST AND AFRICA LIFESTYLE SNEAKER CURRENT AND FUTURE MARKET VOLUME SHARE REGIONAL ANALYSIS, 2025–2034, (USD MILLION)
FIGURE 112 GCC COUNTRIES LIFESTYLE SNEAKER CURRENT AND FUTURE TYPE ANALYSIS, 2025–2034, (USD MILLION)
FIGURE 113 GCC COUNTRIES LIFESTYLE SNEAKER CURRENT AND FUTURE END USER ANALYSIS, 2025–2034, (USD MILLION)
FIGURE 114 SAUDI ARABIA LIFESTYLE SNEAKER CURRENT AND FUTURE TYPE ANALYSIS, 2025–2034, (USD MILLION)
FIGURE 115 SAUDI ARABIA LIFESTYLE SNEAKER CURRENT AND FUTURE END USER ANALYSIS, 2025–2034, (USD MILLION)
FIGURE 116 UAE LIFESTYLE SNEAKER CURRENT AND FUTURE TYPE ANALYSIS, 2025–2034, (USD MILLION)
FIGURE 117 UAE LIFESTYLE SNEAKER CURRENT AND FUTURE END USER ANALYSIS, 2025–2034, (USD MILLION)
FIGURE 118 BAHRAIN LIFESTYLE SNEAKER CURRENT AND FUTURE TYPE ANALYSIS, 2025–2034, (USD MILLION)
FIGURE 119 BAHRAIN LIFESTYLE SNEAKER CURRENT AND FUTURE END USER ANALYSIS, 2025–2034, (USD MILLION)
FIGURE 120 KUWAIT LIFESTYLE SNEAKER CURRENT AND FUTURE TYPE ANALYSIS, 2025–2034, (USD MILLION)
FIGURE 121 KUWAIT LIFESTYLE SNEAKER CURRENT AND FUTURE END USER ANALYSIS, 2025–2034, (USD MILLION)
FIGURE 122 OMAN LIFESTYLE SNEAKER CURRENT AND FUTURE TYPE ANALYSIS, 2025–2034, (USD MILLION)
FIGURE 123 OMAN LIFESTYLE SNEAKER CURRENT AND FUTURE END USER ANALYSIS, 2025–2034, (USD MILLION)
FIGURE 124 QATAR LIFESTYLE SNEAKER CURRENT AND FUTURE TYPE ANALYSIS, 2025–2034, (USD MILLION)
FIGURE 125 QATAR LIFESTYLE SNEAKER CURRENT AND FUTURE END USER ANALYSIS, 2025–2034, (USD MILLION)
FIGURE 126 EGYPT LIFESTYLE SNEAKER CURRENT AND FUTURE TYPE ANALYSIS, 2025–2034, (USD MILLION)
FIGURE 127 EGYPT LIFESTYLE SNEAKER CURRENT AND FUTURE END USER ANALYSIS, 2025–2034, (USD MILLION)
FIGURE 128 NIGERIA LIFESTYLE SNEAKER CURRENT AND FUTURE TYPE ANALYSIS, 2025–2034, (USD MILLION)
FIGURE 129 NIGERIA LIFESTYLE SNEAKER CURRENT AND FUTURE END USER ANALYSIS, 2025–2034, (USD MILLION)
FIGURE 130 SOUTH AFRICA LIFESTYLE SNEAKER CURRENT AND FUTURE TYPE ANALYSIS, 2025–2034, (USD MILLION)
FIGURE 131 SOUTH AFRICA LIFESTYLE SNEAKER CURRENT AND FUTURE END USER ANALYSIS, 2025–2034, (USD MILLION)
FIGURE 132 ISRAEL LIFESTYLE SNEAKER CURRENT AND FUTURE TYPE ANALYSIS, 2025–2034, (USD MILLION)
FIGURE 133 ISRAEL LIFESTYLE SNEAKER CURRENT AND FUTURE END USER ANALYSIS, 2025–2034, (USD MILLION)
FIGURE 134 REST OF MEA LIFESTYLE SNEAKER CURRENT AND FUTURE TYPE ANALYSIS, 2025–2034, (USD MILLION)
FIGURE 135 REST OF MEA LIFESTYLE SNEAKER CURRENT AND FUTURE END USER ANALYSIS, 2025–2034, (USD MILLION)
FIGURE 136 U. S. MARKET SHARE ANALYSIS BY TYPE (2024)
FIGURE 137 U. S. MARKET SHARE ANALYSIS BY END USER (2024)
FIGURE 138 CANADA MARKET SHARE ANALYSIS BY TYPE (2024)
FIGURE 139 CANADA MARKET SHARE ANALYSIS BY END USER (2024)
FIGURE 140 MEXICO MARKET SHARE ANALYSIS BY TYPE (2024)
FIGURE 141 MEXICO MARKET SHARE ANALYSIS BY END USER (2024)
FIGURE 142 CHINA MARKET SHARE ANALYSIS BY TYPE (2024)
FIGURE 143 CHINA MARKET SHARE ANALYSIS BY END USER (2024)
FIGURE 144 JAPAN MARKET SHARE ANALYSIS BY TYPE (2024)
FIGURE 145 JAPAN MARKET SHARE ANALYSIS BY END USER (2024)
FIGURE 146 INDIA MARKET SHARE ANALYSIS BY TYPE (2024)
FIGURE 147 INDIA MARKET SHARE ANALYSIS BY END USER (2024)
FIGURE 148 SOUTH KOREA MARKET SHARE ANALYSIS BY TYPE (2024)
FIGURE 149 SOUTH KOREA MARKET SHARE ANALYSIS BY END USER (2024)
FIGURE 150 SAUDI ARABIA MARKET SHARE ANALYSIS BY TYPE (2024)
FIGURE 151 SAUDI ARABIA MARKET SHARE ANALYSIS BY END USER (2024)
FIGURE 152 UAE MARKET SHARE ANALYSIS BY TYPE (2024)
FIGURE 153 UAE MARKET SHARE ANALYSIS BY END USER (2024)
FIGURE 154 EGYPT MARKET SHARE ANALYSIS BY TYPE (2024)
FIGURE 155 EGYPT MARKET SHARE ANALYSIS BY END USER (2024)
FIGURE 156 NIGERIA MARKET SHARE ANALYSIS BY TYPE (2024)
FIGURE 157 NIGERIA MARKET SHARE ANALYSIS BY END USER (2024)
FIGURE 158 SOUTH AFRICA MARKET SHARE ANALYSIS BY TYPE (2024)
FIGURE 159 SOUTH AFRICA MARKET SHARE ANALYSIS BY END USER (2024)
FIGURE 160 GERMANY MARKET SHARE ANALYSIS BY TYPE (2024)
FIGURE 161 GERMANY MARKET SHARE ANALYSIS BY END USER (2024)
FIGURE 162 FRANCE MARKET SHARE ANALYSIS BY TYPE (2024)
FIGURE 163 FRANCE MARKET SHARE ANALYSIS BY END USER (2024)
FIGURE 164 UK MARKET SHARE ANALYSIS BY TYPE (2024)
FIGURE 165 UK MARKET SHARE ANALYSIS BY END USER (2024)
FIGURE 166 SPAIN MARKET SHARE ANALYSIS BY TYPE (2024)
FIGURE 167 SPAIN MARKET SHARE ANALYSIS BY END USER (2024)
FIGURE 168 ITALY MARKET SHARE ANALYSIS BY TYPE (2024)
FIGURE 169 ITALY MARKET SHARE ANALYSIS BY END USER (2024)
FIGURE 170 BRAZIL MARKET SHARE ANALYSIS BY TYPE (2024)
FIGURE 171 BRAZIL MARKET SHARE ANALYSIS BY END USER (2024)
FIGURE 172 ARGENTINA MARKET SHARE ANALYSIS BY TYPE (2024)
FIGURE 173 ARGENTINA MARKET SHARE ANALYSIS BY END USER (2024)
FIGURE 174 COLUMBIA MARKET SHARE ANALYSIS BY TYPE (2024)
FIGURE 175 COLUMBIA MARKET SHARE ANALYSIS BY END USER (2024)
FIGURE 176 GLOBAL LIFESTYLE SNEAKER CURRENT AND FUTURE MARKET KEY COUNTRY LEVEL ANALYSIS, 2024–2034, (USD MILLION)
FIGURE 177 FINANCIAL OVERVIEW:
Key Player Analysis
Nike, Inc. Nike operates as the clear market leader in the global lifestyle sneaker segment. The company maintains a strong pipeline of retro and lifestyle models, including the Air Force, Dunk, and Air Max families, which continue to hold large market share across North America and Europe. In 2025, Nike strengthens its position through digital product drops, data-driven design tools, and expansion of its SNKRS platform. The company reports that more than 40 percent of its direct-to-consumer revenue now comes from digital channels. Nike continues to invest in sustainable materials, with recycled or bio-based components used in more than 30 percent of its lifestyle lineup. You see the impact in faster sell-through rates and higher engagement across younger buyers.
The company also focuses on regional growth. Nike expands production partnerships in Southeast Asia to reduce lead times and protect margins. It uses athlete and influencer campaigns to target high-growth markets such as India and Vietnam. Its ability to combine strong brand loyalty with efficient global distribution keeps Nike at the front of the competitive landscape.
New Balance Athletics, Inc. New Balance positions itself as a strong challenger in the lifestyle sneaker market. The company benefits from rising interest in neutral and classic designs such as the 990 and 550 series. These models gained significant traction in 2023 and 2024 and continue to rise in 2025 due to strong demand across Asia and Europe. New Balance differentiates itself through its commitment to domestic manufacturing in the United States and the United Kingdom, where selected lifestyle lines carry higher margins and serve premium buyers.
The company expands its collaborations with designers, athletes, and fashion houses to increase the appeal of its lifestyle portfolio. New Balance also strengthens its digital storefronts and loyalty programs to improve direct engagement. With an estimated mid-single-digit global market share in lifestyle sneakers, the company uses consistent product quality and strong brand identity to grow in markets where buyers prefer understated designs over trend-driven releases.
Skechers USA, Inc. Skechers continues to act as a price-competitive player with strong traction in mass-market lifestyle sneakers. The company maintains a wide global footprint with more than 4,500 retail locations and a strong wholesale network. Its lifestyle category benefits from comfort-focused designs and affordable pricing, which attract middle-income consumers in Latin America, India, and Southeast Asia. Skechers reports strong compound growth in international markets, with overseas revenue now accounting for more than 60 percent of total sales.
In 2025, Skechers expands its product line with lightweight lifestyle sneakers supported by EVA midsoles and breathable engineered mesh. The company increases investments in automation within distribution centers to reduce fulfillment times for e-commerce orders. It also strengthens sustainability initiatives by adding recycled materials to selected models. These strategies help Skechers maintain a steady position as a high-volume competitor in the global lifestyle sneaker market.
Market Key Players
Nike, Inc.
Adidas AG
Puma SE
New Balance Athletics, Inc.
Under Armour, Inc.
ASICS Corporation
Skechers USA, Inc.
Reebok International Ltd. (a subsidiary of Authentic Brands Group)
By 2025, lifestyle sneakers hold a strong position in global fashion as athleisure becomes standard in daily wardrobes. Consumers want footwear that supports long hours of movement and fits both casual and work settings. This shift fuels steady demand across major regions, with the global market on track to grow at more than 5 percent CAGR through 2030. Social platforms accelerate this momentum. You see direct sales impact when athletes, musicians, and influencers promote new models or limited drops. Brands now rely on short video campaigns and creator partnerships that can reach millions within hours. This visibility drives rapid adoption and strengthens brand recall, especially among younger buyers who follow global style cues online.
Social Media Influence and Rapid Product Cycles
The influence of social media also compresses product cycles. Your team can launch designs faster and target specific demographics with precision. This environment favors companies that use real-time data to adjust inventory and plan drops that match seasonal demand. As engagement grows on TikTok, Instagram, and resale platforms, the market gains a continuous stream of new buyers and repeat purchasers.
Restraint:
Premium Pricing and Cost Pressures
High retail prices remain a key barrier in 2025. Premium sneakers often exceed 150 USD, limiting access for cost-sensitive buyers across Asia, Latin America, and parts of Europe. Elevated material costs for rubber, EVA foam, and leather continue to pressure margins. Brands must manage these expenses while protecting product quality and staying competitive. Counterfeit activity adds more risk. Fake sneakers circulate widely through informal online sellers and unauthorized marketplaces. Industry reports estimate that counterfeit footwear accounts for more than 20 percent of global seizures, affecting brand trust and legitimate revenue.
Counterfeits and Fast-Fashion Competition
The market also faces intense competition from fast-fashion retailers that offer similar styles at lower prices. You may see pressure on midrange brands as consumers switch to more affordable alternatives. These constraints require companies to manage pricing carefully and strengthen supply-chain controls to protect authenticity.
Opportunity:
Emerging Markets and Regional Expansion
Emerging markets create strong expansion potential through 2030. Rising incomes in India, Indonesia, Vietnam, and parts of Africa push more consumers toward branded lifestyle footwear. Industry forecasts show Asia Pacific contributing more than 40 percent of new global volume growth by 2028. Your team can target these markets with localized designs, midrange price points, and region-specific marketing. Personalization also represents a high-value opportunity. Buyers are willing to pay 10 to 25 percent more for customized colors, materials, or monograms. Brands that build modular production or online configurators can capture this premium segment.
Personalization, Sustainability, and E-commerce Scale
Sustainability broadens the field further. Consumers want products with recycled uppers, bio-based materials, and traceable manufacturing. This demand supports new product lines and long-term brand differentiation. E-commerce amplifies all of these opportunities by giving you direct access to global shoppers without heavy retail investment.
Trend:
Sustainable Materials and Limited-Edition Drops
Sustainable materials shape product development in 2025. Brands invest in plant-based leather, recycled rubber, and low-impact dyes that meet higher consumer expectations. Sales of eco-friendly sneaker lines grow at more than 8 percent annually. Limited drops also remain a defining trend. Exclusive collections create immediate demand spikes, and many pairs sell out within minutes on official websites and mobile apps. This model strengthens resale activity and reinforces brand desirability.
Tech-Enabled Sneakers and Retro Style Revival
Tech-enabled sneakers gain traction as well. Features such as step tracking, fit adjustment, and Bluetooth connectivity appeal to buyers who want more utility from casual footwear. Retro-inspired designs continue to cycle back as younger consumers adopt silhouettes from the 1980s and 1990s. These trends give your team clear direction for product planning and seasonal campaigns, supporting stronger engagement and repeat purchases.
Recent Developments
Dec2024 – Nike, Inc.: Nike introduced the Air Max Muse as a new women’s lifestyle silhouette, with a limited launch through selected retail partners starting 11 December 2024 and a broader digital release planned across 2025. This strengthens Nike’s position in the women’s lifestyle segment and supports higher-margin direct-to-consumer growth.
Jan2025 – Nike, Inc.: Nike confirmed the global rollout of the Air Max Muse and supporting colorways on SNKRS and nike.com in early 2025, targeting both lifestyle and casual performance use and expected to generate first-year sales of over USD 150 million. This staged release model reinforces Nike’s drop-based strategy and deepens digital engagement with frequent sneaker buyers.
Apr2025 – adidas AG: adidas relaunched its “Move For The Planet” program and committed up to EUR 1.5 million in 2025, pledging EUR 1 for every 10 minutes of activity logged between 12 and 25 May on its running app and Strava to fund climate-resilient sports infrastructure. This initiative strengthens adidas’ sustainability credentials and ties lifestyle sneaker demand to broader community and environmental objectives.
Jun2025 – Puma SE: Puma brought back the H-Street silhouette as a lifestyle sneaker, with a global launch on 28 June 2025 in multiple colorways, supported by a high-profile Seoul activation featuring Blackpink’s Rosé and regional creative partners. This relaunch expands Puma’s low-profile lifestyle portfolio and improves its appeal among younger consumers in Asia and other high-growth sneaker markets.
Jul 2025 – Balenciaga x Puma: Balenciaga and Puma advanced their collaboration with distressed Speedcat and Ultrasoft Speedcat models, priced around USD 685 to USD 725 as part of Balenciaga’s Winter 2025 collection, blending luxury fashion pricing with Puma’s motorsport heritage. This move pushes lifestyle sneakers further into the luxury segment and lifts average selling prices in the premium collaboration space.
Oct 2025 – Puma SE: Puma released the A$AP Rocky x Puma Speedcat collaboration at a USD 150 price point, sold primarily through the Puma app and limited partners, with early drops reported to sell out within hours. This strengthens Puma’s position in the high-demand collaboration market and supports higher full-price sell-through in its lifestyle sneaker range.