LLMs in Cybersecurity Market Size USD 252B & 53.6% CAGR
Global Large Language Models (LLMs) in Cybersecurity Market Size, Share & AI Security Analysis By Application (Threat Detection, SOC Automation, Incident Response, Fraud Prevention), By Deployment (Cloud, On-Premise), By End User (BFSI, Government, Enterprises), Risk Landscape, Key Vendors & Forecast 2025–2034
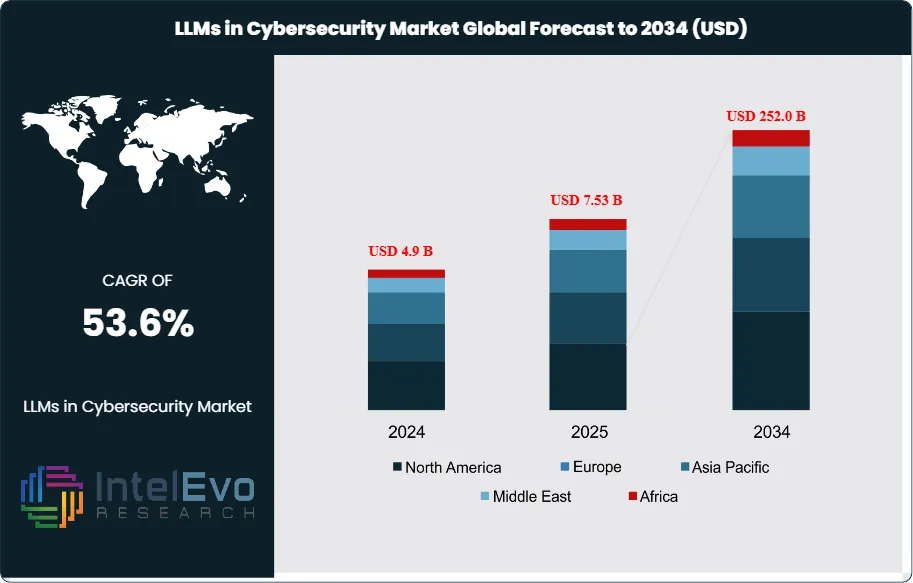
The LLMs in the Cybersecurity Market are expected to reach USD 4.9 billion in 2024. By 2034, this market could grow to around USD 252.0 billion, showing a strong compound annual growth rate of about 53.6% from 2025 to 2034. This rapid growth comes from moving AI from experiments to established uses in security operations. Companies are focusing on automated threat detection, phishing response, and incident handling as the frequency and complexity of attacks, along with regulatory demands, rise worldwide.
The adoption of these technologies picked up speed between 2023 and 2024. Security teams progressed from pilot projects to integrating LLMs into everyday tasks. Modern models can process huge amounts of data, link unusual activities across devices and networks, and offer fixes in minutes. This greatly cuts down the time it takes to detect and respond to incidents. Spending habits are changing due to the increasing vulnerabilities that come with cloud use, remote work, and the growth of IoT, making AI-assisted security a must-have rather than just an improvement.
North America was the market leader in 2024, holding about 40% of the market, thanks to its developed AI systems and a strong network of cybersecurity providers. The U.S. market alone surpassed USD 1.2 billion in 2024 and keeps growing quickly. Early enterprise adoption and pressure from regulations drive this growth. Laws such as the CCPA and the New York SHIELD Act in the U.S., along with GDPR and NIS2 in Europe, are tightening accountability for breaches and increasing the need for smart, automated security measures.
On the supply side, a few leading LLM developers dominate the market, earning most of the global revenue. The level of integration is growing as LLMs become key components in systems like SIEM, SOAR, EDR, email security, and identity platforms. By 2025, many applications are expected to include LLM features, which will significantly expand both the AI attack surface and defense capabilities. Productivity improvements are considerable, with more routine security analysis and response tasks being automated through AI agents.
Even with rapid growth, risks remain. Testing shows that LLMs that are not properly tuned can struggle with accuracy in regulated settings, highlighting the need for domain-specific adjustments, augmented retrieval systems, red-teaming, and human oversight. Issues like data privacy, prompt injection, model manipulation, and vendor dependence continue to be major concerns as usage increases. Looking forward, Asia Pacific is likely to gain market share as cloud services and national cybersecurity initiatives grow in countries such as Japan, South Korea, India, and Singapore. For investors and vendors, current opportunities include secure LLMOps toolchains, frameworks for model assessment, proprietary data integration, and specialized security solutions for fields like finance, healthcare, and critical infrastructure, along with ongoing consolidation among large tech companies and cybersecurity platforms.
Key Takeaways
Market Growth: The market reached USD 4.9 billion in 2024 and is projected to hit USD 252.0 billion by 2034 at a 53.6% CAGR, led by rapid LLM adoption in threat detection, phishing triage, and SOC automation. Rising attack complexity and AI-driven defensive investments are accelerating deployments across enterprises.
Offering: Solutions led with 72.8% share in 2024 as buyers prioritized integrated threat detection, prevention, vulnerability management, and security automation capabilities. Tool consolidation within SIEM, SOAR, EDR, and IAM stacks is anchoring solution spend.
Deployment: Cloud-based deployments captured 58.5% share in 2024 on flexibility, faster iteration, and API-native integrations. Large enterprises accounted for about 70% of adoption, consolidating spend in scalable, managed deployments.
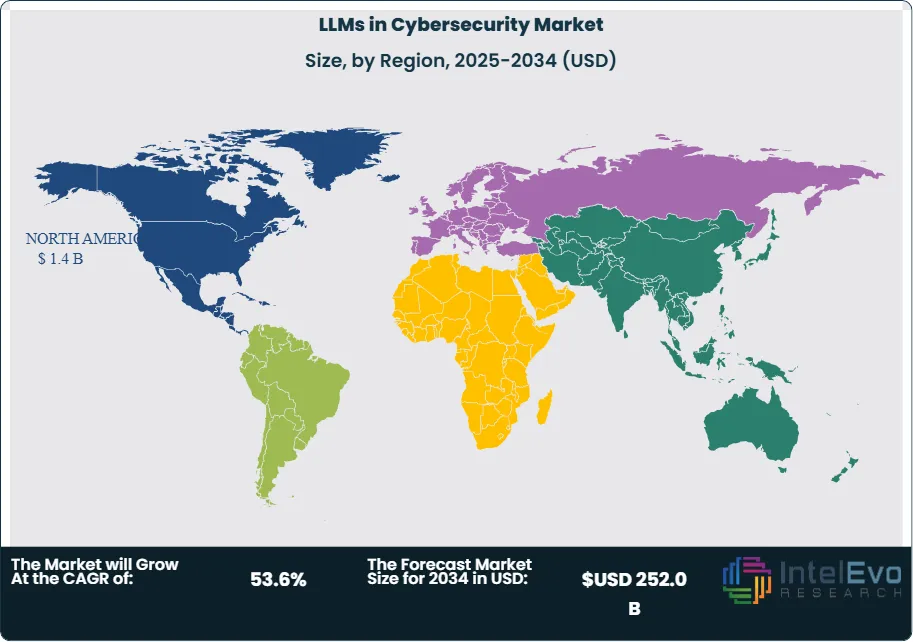
Driver: North America captured 40.7% share and USD 1.4 billion in 2024, reflecting early AI adoption and mature security stacks. Regulatory pressure, including CCPA and the New York SHIELD Act, is catalyzing advanced controls and LLM-enabled workflows
Restraint: Market concentration is high; the top five LLM developers generated about 88.22% of global LLM revenue in 2023, heightening dependency risk on a few suppliers.
Opportunity: BFSI led applications with 32.6% share, creating room for targeted offerings in fraud analytics, compliance, and secure communications. The U.S. market is expanding at a 49.4% CAGR from a USD 1.17 billion base in 2024, presenting strong near-term monetization.
Trend: Network security was the top use case at 35.4% share as teams apply LLMs for anomaly detection and real-time threat analysis. Organizations are deploying LLMs for phishing and social engineering detection and to automate routine incident response tasks.
Regional Analysis: North America led with 40.7% share and USD 1.4 billion in 2024; the U.S. alone reached USD 1.17 billion. Europe and Asia Pacific are catching up as investments ramp in AI-enhanced security from a lower base.
Offering Analysis
Solutions accounted for an estimated 72.8% share in 2024 as buyers prioritized end-to-end capabilities across threat detection and prevention, vulnerability management, security automation, data security, and identity and access management. Adoption tracked enterprise demand for tools that reduce time-to-detect and time-to-respond while scaling across high-volume telemetry and multilingual threat signals. Services expanded as organizations sought implementation, integration, training, and ongoing support to productionize LLM use cases inside security operations; managed services gained traction where in-house expertise and 24x7 coverage remain constrained. Suppliers that package outcomes around incident triage, phishing defense, and anomaly analysis continue to gain share as enterprises consolidate point tools into integrated offerings.
By Deployment Model
Cloud-based deployments led with roughly 58.5% share in 2024, driven by elastic compute, faster iteration cycles, and API-native integrations that accelerate model updates and enterprise rollouts. Buyers favored opex-based consumption to align spend with usage while enabling rapid scale-up during attack surges or proof-of-concept expansions. On-premises remained relevant for data sovereignty and low-latency use cases, but the center of gravity shifted to cloud platforms that bundle model hosting, guardrails, and observability for LLM workflows in security stacks. As teams standardize on cloud pipelines, update velocity and model governance improved, supporting the market’s projected 52.8% CAGR through 2034.
Organization Size Analysis
Large enterprises captured over 70% share in 2024 as regulated sectors funded advanced AI defenses to handle complex risks, audit trails, and stringent reporting requirements. These organizations deploy LLMs to parse massive event streams, surface anomalies, and assist analysts with prioritized response at scale. Budget concentration and compliance obligations in finance, healthcare, government, and critical infrastructure accelerated upgrades to enterprise-grade models, toolchains, and evaluation frameworks. Vendors that align to enterprise controls and SIEM/SOAR workflows continue to outperform in competitive wins and expansions.
Application Analysis
Network security led with about 35.4% share in 2024 as organizations applied LLMs to detect anomalies in real time, triage alerts, and interpret complex patterns across hybrid networks. The use of LLMs in phishing and social engineering detection supported measurable reductions in false positives and analyst workload. Adoption also advanced in endpoint, application, and cloud security, where LLMs improved root-cause narration, policy recommendations, and response playbooks at scale. As IoT growth widens the attack surface, cross-domain signal correlation remains a priority, reinforcing spend in LLM-enhanced monitoring and preemptive controls.
End-User Industry
BFSI held around 32.6% share in 2024, reflecting high exposure to fraud, payment risk, and targeted phishing that benefit from LLM-driven anomaly detection and investigative summarization. Compliance reporting and audit automation further support LLM use in regulated workflows. Healthcare, IT and telecom, government and defense, and retail advanced deployments focused on data privacy, access governance, and faster incident response in multi-cloud environments. Manufacturing and energy emphasized operational continuity and multilingual support for global plants and supply chains using LLM-enabled threat intelligence.
Regional Analysis
North America led with 40.7% share and approximately USD 1.4 billion revenue in 2024, underpinned by mature AI ecosystems, vendor density, and enterprise-scale security modernization; the U.S. reached about USD 1.17 billion and is expanding at roughly 49.4% CAGR. Consolidation between security platforms and hyperscale AI providers remains a regional growth catalyst. Europe and Asia Pacific are scaling from a lower base as cloud adoption, national cyber programs, and SOC modernization drive procurement cycles; the global market is projected to rise from USD 3.6 billion in 2024 to USD 249.8 billion by 2034 at a 52.8% CAGR, reinforcing a multi-region expansion path. Market concentration remains elevated, with the top five LLM developers accounting for about 88.22% of revenue in 2023, shaping access and pricing globally.
By Offering (Solutions, Services), By Deployment Model (Cloud-based, On-premises), By Organization Size (Large Enterprises, Small and Medium-sized Enterprises (SMEs)), By Application (Network Security, Endpoint Security, Application Security, Cloud Security, Others), By End-User Industry (Banking, Financial Services, and Insurance (BFSI), Healthcare, IT & Telecom, Government and Defense, Retail, Manufacturing, Others (Aerospace, & Energy and Utilities, etc.)),
Research Methodology
Primary Research- 100 Interviews of Stakeholders
Secondary Research
Desk Research
Regional scope
North America (United States, Canada, Mexico)
Latin America (Brazil, Argentina, Columbia)
East Asia And Pacific (China, Japan, South Korea, Australia, Cambodia, Fiji, Indonesia)
Sea And South Asia (India, Singapore, Thailand, Taiwan, Malaysia)
Eastern Europe (Poland, Russia, Czech Republic, Romania)
Western Europe (Germany, U.K., France, Spain, Itlay)
Middle East & Africa (GCC Countries, Egypt, Nigeria, South Africa, Israel)
Customization for segments, region/country-level will be provided. Moreover, additional customization can be done based on the requirements.
Pricing and Purchase Options
Avail customized purchase options to meet your exact research needs. We have three licenses to opt for: Single User License, Multi-User License (Up to 5 Users), Corporate Use License (Unlimited User and Printable PDF).
TABLE OF CONTENTS
1. EXECUTIVE SUMMARY
1.1. MARKET SNAPSHOT
1.2. KEY FINDINGS & INSIGHTS
1.3. ANALYST RECOMMENDATIONS
1.4. FUTURE OUTLOOK
2. RESEARCH METHODOLOGY
2.1. MARKET DEFINITION & SCOPE
2.2. RESEARCH OBJECTIVES: PRIMARY & SECONDARY DATA SOURCES
2.3. DATA COLLECTION SOURCES
2.3.1. COVERAGE OF 100+ PRIMARY RESEARCH/CONSULTATION CALLS WITH INDUSTRY STAKEHOLDERS
FIGURE 17 NORTH AMERICA LLMS IN CYBERSECURITY CURRENT AND FUTURE TYPE ANALYSIS, 2025–2034, (USD MILLION)
FIGURE 18 NORTH AMERICA LLMS IN CYBERSECURITY CURRENT AND FUTURE END USER ANALYSIS, 2025–2034, (USD MILLION)
FIGURE 19 MARKET SHARE BY COUNTRY
FIGURE 20 LATIN AMERICA LLMS IN CYBERSECURITY CURRENT AND FUTURE TYPE ANALYSIS, 2025–2034, (USD MILLION)
FIGURE 21 LATIN AMERICA LLMS IN CYBERSECURITY CURRENT AND FUTURE END USER ANALYSIS, 2025–2034, (USD MILLION)
FIGURE 22 MARKET SHARE BY COUNTRY
FIGURE 23 EASTERN EUROPE LLMS IN CYBERSECURITY CURRENT AND FUTURE TYPE ANALYSIS, 2025–2034, (USD MILLION)
FIGURE 24 EASTERN EUROPE LLMS IN CYBERSECURITY CURRENT AND FUTURE END USER ANALYSIS, 2025–2034, (USD MILLION)
FIGURE 25 MARKET SHARE BY COUNTRY
FIGURE 26 WESTERN EUROPE LLMS IN CYBERSECURITY CURRENT AND FUTURE TYPE ANALYSIS, 2025–2034, (USD MILLION)
FIGURE 27 WESTERN EUROPE LLMS IN CYBERSECURITY CURRENT AND FUTURE END USER ANALYSIS, 2025–2034, (USD MILLION)
FIGURE 28 MARKET SHARE BY COUNTRY
FIGURE 29 EAST ASIA AND PACIFIC LLMS IN CYBERSECURITY CURRENT AND FUTURE TYPE ANALYSIS, 2025–2034, (USD MILLION)
FIGURE 30 EAST ASIA AND PACIFIC LLMS IN CYBERSECURITY CURRENT AND FUTURE END USER ANALYSIS, 2025–2034, (USD MILLION)
FIGURE 31 MARKET SHARE BY COUNTRY
FIGURE 32 SEA AND SOUTH ASIA LLMS IN CYBERSECURITY CURRENT AND FUTURE TYPE ANALYSIS, 2025–2034, (USD MILLION)
FIGURE 33 SEA AND SOUTH ASIA LLMS IN CYBERSECURITY CURRENT AND FUTURE END USER ANALYSIS, 2025–2034, (USD MILLION)
FIGURE 34 MARKET SHARE BY COUNTRY
FIGURE 35 MIDDLE EAST AND AFRICA LLMS IN CYBERSECURITY CURRENT AND FUTURE TYPE ANALYSIS, 2025–2034, (USD MILLION)
FIGURE 36 MIDDLE EAST AND AFRICA LLMS IN CYBERSECURITY CURRENT AND FUTURE END USER ANALYSIS, 2025–2034, (USD MILLION)
FIGURE 37 NORTH AMERICA LLMS IN CYBERSECURITY CURRENT AND FUTURE MARKET VOLUME SHARE REGIONAL ANALYSIS, 2025–2034, (USD MILLION)
FIGURE 38 U.S. LLMS IN CYBERSECURITY CURRENT AND FUTURE TYPE ANALYSIS, 2025–2034, (USD MILLION)
FIGURE 39 U.S. LLMS IN CYBERSECURITY CURRENT AND FUTURE END USER ANALYSIS, 2025–2034, (USD MILLION)
FIGURE 40 CANADA LLMS IN CYBERSECURITY CURRENT AND FUTURE TYPE ANALYSIS, 2025–2034, (USD MILLION)
FIGURE 41 CANADA LLMS IN CYBERSECURITY CURRENT AND FUTURE END USER ANALYSIS, 2025–2034, (USD MILLION)
FIGURE 42 LATIN AMERICA LLMS IN CYBERSECURITY CURRENT AND FUTURE MARKET VOLUME SHARE REGIONAL ANALYSIS, 2025–2034, (USD MILLION)
FIGURE 43 MEXICO LLMS IN CYBERSECURITY CURRENT AND FUTURE TYPE ANALYSIS, 2025–2034, (USD MILLION)
FIGURE 44 MEXICO LLMS IN CYBERSECURITY CURRENT AND FUTURE END USER ANALYSIS, 2025–2034, (USD MILLION)
FIGURE 45 BRAZIL LLMS IN CYBERSECURITY CURRENT AND FUTURE TYPE ANALYSIS, 2025–2034, (USD MILLION)
FIGURE 46 BRAZIL LLMS IN CYBERSECURITY CURRENT AND FUTURE END USER ANALYSIS, 2025–2034, (USD MILLION)
FIGURE 47 ARGENTINA LLMS IN CYBERSECURITY CURRENT AND FUTURE TYPE ANALYSIS, 2025–2034, (USD MILLION)
FIGURE 48 ARGENTINA LLMS IN CYBERSECURITY CURRENT AND FUTURE END USER ANALYSIS, 2025–2034, (USD MILLION)
FIGURE 49 COLUMBIA LLMS IN CYBERSECURITY CURRENT AND FUTURE TYPE ANALYSIS, 2025–2034, (USD MILLION)
FIGURE 50 COLUMBIA LLMS IN CYBERSECURITY CURRENT AND FUTURE END USER ANALYSIS, 2025–2034, (USD MILLION)
FIGURE 51 REST OF LATIN AMERICA LLMS IN CYBERSECURITY CURRENT AND FUTURE TYPE ANALYSIS, 2025–2034, (USD MILLION)
FIGURE 52 REST OF LATIN AMERICA LLMS IN CYBERSECURITY CURRENT AND FUTURE END USER ANALYSIS, 2025–2034, (USD MILLION)
FIGURE 53 EASTERN EUROPE LLMS IN CYBERSECURITY CURRENT AND FUTURE MARKET VOLUME SHARE REGIONAL ANALYSIS, 2025–2034, (USD MILLION)
FIGURE 54 POLAND LLMS IN CYBERSECURITY CURRENT AND FUTURE TYPE ANALYSIS, 2025–2034, (USD MILLION)
FIGURE 55 POLAND LLMS IN CYBERSECURITY CURRENT AND FUTURE END USER ANALYSIS, 2025–2034, (USD MILLION)
FIGURE 56 RUSSIA LLMS IN CYBERSECURITY CURRENT AND FUTURE TYPE ANALYSIS, 2025–2034, (USD MILLION)
FIGURE 57 RUSSIA LLMS IN CYBERSECURITY CURRENT AND FUTURE END USER ANALYSIS, 2025–2034, (USD MILLION)
FIGURE 58 CZECH REPUBLIC LLMS IN CYBERSECURITY CURRENT AND FUTURE TYPE ANALYSIS, 2025–2034, (USD MILLION)
FIGURE 59 CZECH REPUBLIC LLMS IN CYBERSECURITY CURRENT AND FUTURE END USER ANALYSIS, 2025–2034, (USD MILLION)
FIGURE 60 ROMANIA LLMS IN CYBERSECURITY CURRENT AND FUTURE TYPE ANALYSIS, 2025–2034, (USD MILLION)
FIGURE 61 ROMANIA LLMS IN CYBERSECURITY CURRENT AND FUTURE END USER ANALYSIS, 2025–2034, (USD MILLION)
FIGURE 62 REST OF EASTERN EUROPE LLMS IN CYBERSECURITY CURRENT AND FUTURE TYPE ANALYSIS, 2025–2034, (USD MILLION)
FIGURE 63 REST OF EASTERN EUROPE LLMS IN CYBERSECURITY CURRENT AND FUTURE END USER ANALYSIS, 2025–2034, (USD MILLION)
FIGURE 64 WESTERN EUROPE LLMS IN CYBERSECURITY CURRENT AND FUTURE MARKET VOLUME SHARE REGIONAL ANALYSIS, 2025–2034, (USD MILLION)
FIGURE 65 GERMANY LLMS IN CYBERSECURITY CURRENT AND FUTURE TYPE ANALYSIS, 2025–2034, (USD MILLION)
FIGURE 66 GERMANY LLMS IN CYBERSECURITY CURRENT AND FUTURE END USER ANALYSIS, 2025–2034, (USD MILLION)
FIGURE 67 FRANCE LLMS IN CYBERSECURITY CURRENT AND FUTURE TYPE ANALYSIS, 2025–2034, (USD MILLION)
FIGURE 68 FRANCE LLMS IN CYBERSECURITY CURRENT AND FUTURE END USER ANALYSIS, 2025–2034, (USD MILLION)
FIGURE 69 UK LLMS IN CYBERSECURITY CURRENT AND FUTURE TYPE ANALYSIS, 2025–2034, (USD MILLION)
FIGURE 70 UK LLMS IN CYBERSECURITY CURRENT AND FUTURE END USER ANALYSIS, 2025–2034, (USD MILLION)
FIGURE 71 SPAIN LLMS IN CYBERSECURITY CURRENT AND FUTURE TYPE ANALYSIS, 2025–2034, (USD MILLION)
FIGURE 72 SPAIN LLMS IN CYBERSECURITY CURRENT AND FUTURE END USER ANALYSIS, 2025–2034, (USD MILLION)
FIGURE 73 ITALY LLMS IN CYBERSECURITY CURRENT AND FUTURE TYPE ANALYSIS, 2025–2034, (USD MILLION)
FIGURE 74 ITALY LLMS IN CYBERSECURITY CURRENT AND FUTURE END USER ANALYSIS, 2025–2034, (USD MILLION)
FIGURE 75 REST OF WESTERN EUROPE LLMS IN CYBERSECURITY CURRENT AND FUTURE TYPE ANALYSIS, 2025–2034, (USD MILLION)
FIGURE 76 REST OF WESTERN EUROPE LLMS IN CYBERSECURITY CURRENT AND FUTURE END USER ANALYSIS, 2025–2034, (USD MILLION)
FIGURE 77 EAST ASIA AND PACIFIC LLMS IN CYBERSECURITY CURRENT AND FUTURE MARKET VOLUME SHARE REGIONAL ANALYSIS, 2025–2034, (USD MILLION)
FIGURE 78 CHINA LLMS IN CYBERSECURITY CURRENT AND FUTURE TYPE ANALYSIS, 2025–2034, (USD MILLION)
FIGURE 79 CHINA LLMS IN CYBERSECURITY CURRENT AND FUTURE END USER ANALYSIS, 2025–2034, (USD MILLION)
FIGURE 80 JAPAN LLMS IN CYBERSECURITY CURRENT AND FUTURE TYPE ANALYSIS, 2025–2034, (USD MILLION)
FIGURE 81 JAPAN LLMS IN CYBERSECURITY CURRENT AND FUTURE END USER ANALYSIS, 2025–2034, (USD MILLION)
FIGURE 82 AUSTRALIA LLMS IN CYBERSECURITY CURRENT AND FUTURE TYPE ANALYSIS, 2025–2034, (USD MILLION)
FIGURE 83 AUSTRALIA LLMS IN CYBERSECURITY CURRENT AND FUTURE END USER ANALYSIS, 2025–2034, (USD MILLION)
FIGURE 84 CAMBODIA LLMS IN CYBERSECURITY CURRENT AND FUTURE TYPE ANALYSIS, 2025–2034, (USD MILLION)
FIGURE 85 CAMBODIA LLMS IN CYBERSECURITY CURRENT AND FUTURE END USER ANALYSIS, 2025–2034, (USD MILLION)
FIGURE 86 FIJI LLMS IN CYBERSECURITY CURRENT AND FUTURE TYPE ANALYSIS, 2025–2034, (USD MILLION)
FIGURE 87 FIJI LLMS IN CYBERSECURITY CURRENT AND FUTURE END USER ANALYSIS, 2025–2034, (USD MILLION)
FIGURE 88 INDONESIA LLMS IN CYBERSECURITY CURRENT AND FUTURE TYPE ANALYSIS, 2025–2034, (USD MILLION)
FIGURE 89 INDONESIA LLMS IN CYBERSECURITY CURRENT AND FUTURE END USER ANALYSIS, 2025–2034, (USD MILLION)
FIGURE 90 SOUTH KOREA LLMS IN CYBERSECURITY CURRENT AND FUTURE TYPE ANALYSIS, 2025–2034, (USD MILLION)
FIGURE 91 SOUTH KOREA LLMS IN CYBERSECURITY CURRENT AND FUTURE END USER ANALYSIS, 2025–2034, (USD MILLION)
FIGURE 92 REST OF EAST ASIA AND PACIFIC LLMS IN CYBERSECURITY CURRENT AND FUTURE TYPE ANALYSIS, 2025–2034, (USD MILLION)
FIGURE 93 REST OF EAST ASIA AND PACIFIC LLMS IN CYBERSECURITY CURRENT AND FUTURE END USER ANALYSIS, 2025–2034, (USD MILLION)
FIGURE 94 SEA AND SOUTH ASIA LLMS IN CYBERSECURITY CURRENT AND FUTURE MARKET VOLUME SHARE REGIONAL ANALYSIS, 2025–2034, (USD MILLION)
FIGURE 95 BANGLADESH LLMS IN CYBERSECURITY CURRENT AND FUTURE TYPE ANALYSIS, 2025–2034, (USD MILLION)
FIGURE 96 BANGLADESH LLMS IN CYBERSECURITY CURRENT AND FUTURE END USER ANALYSIS, 2025–2034, (USD MILLION)
FIGURE 97 NEW ZEALAND LLMS IN CYBERSECURITY CURRENT AND FUTURE TYPE ANALYSIS, 2025–2034, (USD MILLION)
FIGURE 98 NEW ZEALAND LLMS IN CYBERSECURITY CURRENT AND FUTURE END USER ANALYSIS, 2025–2034, (USD MILLION)
FIGURE 99 INDIA LLMS IN CYBERSECURITY CURRENT AND FUTURE TYPE ANALYSIS, 2025–2034, (USD MILLION)
FIGURE 100 INDIA LLMS IN CYBERSECURITY CURRENT AND FUTURE END USER ANALYSIS, 2025–2034, (USD MILLION)
FIGURE 101 SINGAPORE LLMS IN CYBERSECURITY CURRENT AND FUTURE TYPE ANALYSIS, 2025–2034, (USD MILLION)
FIGURE 102 SINGAPORE LLMS IN CYBERSECURITY CURRENT AND FUTURE END USER ANALYSIS, 2025–2034, (USD MILLION)
FIGURE 103 THAILAND LLMS IN CYBERSECURITY CURRENT AND FUTURE TYPE ANALYSIS, 2025–2034, (USD MILLION)
FIGURE 104 THAILAND LLMS IN CYBERSECURITY CURRENT AND FUTURE END USER ANALYSIS, 2025–2034, (USD MILLION)
FIGURE 105 TAIWAN LLMS IN CYBERSECURITY CURRENT AND FUTURE TYPE ANALYSIS, 2025–2034, (USD MILLION)
FIGURE 106 TAIWAN LLMS IN CYBERSECURITY CURRENT AND FUTURE END USER ANALYSIS, 2025–2034, (USD MILLION)
FIGURE 107 MALAYSIA LLMS IN CYBERSECURITY CURRENT AND FUTURE TYPE ANALYSIS, 2025–2034, (USD MILLION)
FIGURE 108 MALAYSIA LLMS IN CYBERSECURITY CURRENT AND FUTURE END USER ANALYSIS, 2025–2034, (USD MILLION)
FIGURE 109 REST OF SEA AND SOUTH ASIA LLMS IN CYBERSECURITY CURRENT AND FUTURE TYPE ANALYSIS, 2025–2034, (USD MILLION)
FIGURE 110 REST OF SEA AND SOUTH ASIA LLMS IN CYBERSECURITY CURRENT AND FUTURE END USER ANALYSIS, 2025–2034, (USD MILLION)
FIGURE 111 MIDDLE EAST AND AFRICA LLMS IN CYBERSECURITY CURRENT AND FUTURE MARKET VOLUME SHARE REGIONAL ANALYSIS, 2025–2034, (USD MILLION)
FIGURE 112 GCC COUNTRIES LLMS IN CYBERSECURITY CURRENT AND FUTURE TYPE ANALYSIS, 2025–2034, (USD MILLION)
FIGURE 113 GCC COUNTRIES LLMS IN CYBERSECURITY CURRENT AND FUTURE END USER ANALYSIS, 2025–2034, (USD MILLION)
FIGURE 114 SAUDI ARABIA LLMS IN CYBERSECURITY CURRENT AND FUTURE TYPE ANALYSIS, 2025–2034, (USD MILLION)
FIGURE 115 SAUDI ARABIA LLMS IN CYBERSECURITY CURRENT AND FUTURE END USER ANALYSIS, 2025–2034, (USD MILLION)
FIGURE 116 UAE LLMS IN CYBERSECURITY CURRENT AND FUTURE TYPE ANALYSIS, 2025–2034, (USD MILLION)
FIGURE 117 UAE LLMS IN CYBERSECURITY CURRENT AND FUTURE END USER ANALYSIS, 2025–2034, (USD MILLION)
FIGURE 118 BAHRAIN LLMS IN CYBERSECURITY CURRENT AND FUTURE TYPE ANALYSIS, 2025–2034, (USD MILLION)
FIGURE 119 BAHRAIN LLMS IN CYBERSECURITY CURRENT AND FUTURE END USER ANALYSIS, 2025–2034, (USD MILLION)
FIGURE 120 KUWAIT LLMS IN CYBERSECURITY CURRENT AND FUTURE TYPE ANALYSIS, 2025–2034, (USD MILLION)
FIGURE 121 KUWAIT LLMS IN CYBERSECURITY CURRENT AND FUTURE END USER ANALYSIS, 2025–2034, (USD MILLION)
FIGURE 122 OMAN LLMS IN CYBERSECURITY CURRENT AND FUTURE TYPE ANALYSIS, 2025–2034, (USD MILLION)
FIGURE 123 OMAN LLMS IN CYBERSECURITY CURRENT AND FUTURE END USER ANALYSIS, 2025–2034, (USD MILLION)
FIGURE 124 QATAR LLMS IN CYBERSECURITY CURRENT AND FUTURE TYPE ANALYSIS, 2025–2034, (USD MILLION)
FIGURE 125 QATAR LLMS IN CYBERSECURITY CURRENT AND FUTURE END USER ANALYSIS, 2025–2034, (USD MILLION)
FIGURE 126 EGYPT LLMS IN CYBERSECURITY CURRENT AND FUTURE TYPE ANALYSIS, 2025–2034, (USD MILLION)
FIGURE 127 EGYPT LLMS IN CYBERSECURITY CURRENT AND FUTURE END USER ANALYSIS, 2025–2034, (USD MILLION)
FIGURE 128 NIGERIA LLMS IN CYBERSECURITY CURRENT AND FUTURE TYPE ANALYSIS, 2025–2034, (USD MILLION)
FIGURE 129 NIGERIA LLMS IN CYBERSECURITY CURRENT AND FUTURE END USER ANALYSIS, 2025–2034, (USD MILLION)
FIGURE 130 SOUTH AFRICA LLMS IN CYBERSECURITY CURRENT AND FUTURE TYPE ANALYSIS, 2025–2034, (USD MILLION)
FIGURE 131 SOUTH AFRICA LLMS IN CYBERSECURITY CURRENT AND FUTURE END USER ANALYSIS, 2025–2034, (USD MILLION)
FIGURE 132 ISRAEL LLMS IN CYBERSECURITY CURRENT AND FUTURE TYPE ANALYSIS, 2025–2034, (USD MILLION)
FIGURE 133 ISRAEL LLMS IN CYBERSECURITY CURRENT AND FUTURE END USER ANALYSIS, 2025–2034, (USD MILLION)
FIGURE 134 REST OF MEA LLMS IN CYBERSECURITY CURRENT AND FUTURE TYPE ANALYSIS, 2025–2034, (USD MILLION)
FIGURE 135 REST OF MEA LLMS IN CYBERSECURITY CURRENT AND FUTURE END USER ANALYSIS, 2025–2034, (USD MILLION)
FIGURE 136 U. S. MARKET SHARE ANALYSIS BY TYPE (2024)
FIGURE 137 U. S. MARKET SHARE ANALYSIS BY END USER (2024)
FIGURE 138 CANADA MARKET SHARE ANALYSIS BY TYPE (2024)
FIGURE 139 CANADA MARKET SHARE ANALYSIS BY END USER (2024)
FIGURE 140 MEXICO MARKET SHARE ANALYSIS BY TYPE (2024)
FIGURE 141 MEXICO MARKET SHARE ANALYSIS BY END USER (2024)
FIGURE 142 CHINA MARKET SHARE ANALYSIS BY TYPE (2024)
FIGURE 143 CHINA MARKET SHARE ANALYSIS BY END USER (2024)
FIGURE 144 JAPAN MARKET SHARE ANALYSIS BY TYPE (2024)
FIGURE 145 JAPAN MARKET SHARE ANALYSIS BY END USER (2024)
FIGURE 146 INDIA MARKET SHARE ANALYSIS BY TYPE (2024)
FIGURE 147 INDIA MARKET SHARE ANALYSIS BY END USER (2024)
FIGURE 148 SOUTH KOREA MARKET SHARE ANALYSIS BY TYPE (2024)
FIGURE 149 SOUTH KOREA MARKET SHARE ANALYSIS BY END USER (2024)
FIGURE 150 SAUDI ARABIA MARKET SHARE ANALYSIS BY TYPE (2024)
FIGURE 151 SAUDI ARABIA MARKET SHARE ANALYSIS BY END USER (2024)
FIGURE 152 UAE MARKET SHARE ANALYSIS BY TYPE (2024)
FIGURE 153 UAE MARKET SHARE ANALYSIS BY END USER (2024)
FIGURE 154 EGYPT MARKET SHARE ANALYSIS BY TYPE (2024)
FIGURE 155 EGYPT MARKET SHARE ANALYSIS BY END USER (2024)
FIGURE 156 NIGERIA MARKET SHARE ANALYSIS BY TYPE (2024)
FIGURE 157 NIGERIA MARKET SHARE ANALYSIS BY END USER (2024)
FIGURE 158 SOUTH AFRICA MARKET SHARE ANALYSIS BY TYPE (2024)
FIGURE 159 SOUTH AFRICA MARKET SHARE ANALYSIS BY END USER (2024)
FIGURE 160 GERMANY MARKET SHARE ANALYSIS BY TYPE (2024)
FIGURE 161 GERMANY MARKET SHARE ANALYSIS BY END USER (2024)
FIGURE 162 FRANCE MARKET SHARE ANALYSIS BY TYPE (2024)
FIGURE 163 FRANCE MARKET SHARE ANALYSIS BY END USER (2024)
FIGURE 164 UK MARKET SHARE ANALYSIS BY TYPE (2024)
FIGURE 165 UK MARKET SHARE ANALYSIS BY END USER (2024)
FIGURE 166 SPAIN MARKET SHARE ANALYSIS BY TYPE (2024)
FIGURE 167 SPAIN MARKET SHARE ANALYSIS BY END USER (2024)
FIGURE 168 ITALY MARKET SHARE ANALYSIS BY TYPE (2024)
FIGURE 169 ITALY MARKET SHARE ANALYSIS BY END USER (2024)
FIGURE 170 BRAZIL MARKET SHARE ANALYSIS BY TYPE (2024)
FIGURE 171 BRAZIL MARKET SHARE ANALYSIS BY END USER (2024)
FIGURE 172 ARGENTINA MARKET SHARE ANALYSIS BY TYPE (2024)
FIGURE 173 ARGENTINA MARKET SHARE ANALYSIS BY END USER (2024)
FIGURE 174 COLUMBIA MARKET SHARE ANALYSIS BY TYPE (2024)
FIGURE 175 COLUMBIA MARKET SHARE ANALYSIS BY END USER (2024)
FIGURE 176 GLOBAL LLMS IN CYBERSECURITY CURRENT AND FUTURE MARKET KEY COUNTRY LEVEL ANALYSIS, 2024–2034, (USD MILLION)
FIGURE 177 FINANCIAL OVERVIEW:
Key Player Analysis
Palo Alto Networks, Inc.: Positioning: Leader. The company aligns its product roadmap to AI-driven security operations as enterprises scale LLM-enabled detection, investigation, and response across SOC workflows in 2025. Market expansion from USD 3.6 billion in 2024 toward USD 249.8 billion by 2034 at a projected CAGR of 52.8 percent supports broader platform adoption in network, cloud, and email security where LLM capabilities compress time-to-detect and time-to-respond. Strategy and differentiators: The firm benefits from the shift to cloud-delivered analytics, where buyers favor rapid iteration and integrated guardrails that match board-level priorities for AI risk management in 2025. Participation in the fast-growing generative AI cybersecurity segment, forecast to expand materially through 2030, underpins investments in model-assisted SOC automation and cross-domain signal correlation you can scale across global deployments.
CyberArk Software Ltd.: Positioning: Leader. The company focuses on identity security use cases where LLMs assist in privileged access monitoring, policy narration, and analyst guidance as zero trust programs mature under stricter governance in 2025. Identity-centric controls remain priority spend within AI in cybersecurity rollouts that pair behavioral analytics with automated remediation at the point of access. Strategy and differentiators: CyberArk’s core in privileged access and session oversight aligns to risk reduction mandates highlighted by boards and regulators, where AI assistance helps translate policy to action in complex estates. As AI in cybersecurity adoption rises, identity remains a control plane that absorbs LLM features for faster decision support and incident investigation across hybrid environments.
Darktrace Holdings Ltd.: Positioning: Innovator. The company’s AI-native approach maps to 2025 demand for continuous anomaly detection, email defense, and autonomous response as enterprises increase reliance on model-assisted triage in production SOCs. Buyers prioritize AI-driven detection to address alert volumes and advanced social engineering, in line with 2025 governance and resilience expectations. Strategy and differentiators: Darktrace benefits from the broader adoption of AI in cybersecurity, where LLMs and machine learning support narrative explanations, pattern discovery, and response playbooks at scale. The firm’s emphasis on automated defense resonates with board guidance on faster containment and recovery under updated 2025 cyber risk outlooks
Lasso.security: Positioning: Disruptor. Lasso.security offers a GenAI and LLM security platform that monitors all LLM interactions in real time, detects risks, and enforces policies across applications, agents, and gateways to protect data and workflows. The company raised USD 6 million in seed funding led by Entrée Capital with participation from Samsung Next to expand product development and go-to-market. Strategy and differentiators: The platform provides monitoring, live risk alerts, and instant data protection with masking and policy enforcement, delivered across major cloud marketplaces for rapid enterprise adoption you can operationalize in weeks. The firm expanded into U.S. public sector programs through Lasso Federal LLC and a partnership with Swish Data, signaling momentum in regulated environments that prioritize AI governance and runtime enforcement in 2025. Product and roadmap: Lasso publishes guidance on agentic AI risks and implements defenses for memory poisoning, tool misuse, and privilege compromise via policy engines and an MCP Gateway for guardrails and logging. In 2025 industry coverage, Lasso is cited for AI TRiSM-aligned capabilities such as real-time monitoring, continuous testing, and runtime inspection that help enterprises meet evolving compliance and risk requirements.
In 2025, security teams are moving from reactive response to proactive defense as attack volumes, multi-vector campaigns, and regulatory scrutiny increase across sectors and regions. Large language models (LLMs) now drive real-time anomaly analysis, phishing triage, and automated investigations across SIEM, SOAR, EDR, and email security stacks, speeding up adoption at scale. Market growth is strong, with near-term sales rising from approximately USD 3.88 billion in 2024 to USD 6.07 billion in 2025. This shows rapid acceptance of AI-assisted security workflows in enterprise settings.
Security-Specific Models Improve Detection and SOC Productivity
The transition from general-purpose models to security-focused LLMs is enhancing detection accuracy and response time. Models trained on CVEs, threat intelligence feeds, and malware data link alerts more accurately to frameworks like MITRE ATT&CK. This reduces analyst burnout and shortens the time to resolve issues. Emerging technologies, including security-specific LLM variants and guided copilots, indicate a shift toward operational AI that supports continuous monitoring and investigation at a large scale.
Restraint
Model Performance Variability Limits Autonomous Decisioning
Execution risks remain significant since LLM performance can change depending on dataset quality and context. Independent tests in regulated areas have shown that off-the-shelf tools often have low accuracy, limiting the safe use of autonomous actions without thorough tuning, evaluation, and human oversight. For many organizations, this means rolling out in stages and limiting deployment scopes, especially in high-risk settings.
Vendor Concentration and Governance Raise Cost and Risk
Market concentration creates dependency and pricing risks, as a handful of LLM developers dominate global revenue. Additionally, governance rules around safety, bias reduction, explainability, and auditability complicate integration and extend procurement timelines. These factors raise overall costs and slow down adoption for organizations that must comply with strict regulations.
Opportunity
Domain-Specific Deployments Unlock Measurable ROI
The biggest potential lies in domain-specific implementations where labeled data, clear policies, and standardized processes lead to greater accuracy and measurable results. Banking and financial services are already at the forefront, driven by needs in fraud detection, payments risk monitoring, and compliance automation. Similar chances are emerging in healthcare, critical infrastructure, and government security operations.
Regional Scale and Market Expansion Create Headroom
Regional growth is most noticeable in the United States, where enterprise security budgets and cloud adoption allow rapid scaling of LLM-powered defenses. Broader indicators show continued expansion through the decade, creating opportunities for specialized vendors, managed security providers, and platform integrators to generate value by bundling AI capabilities with threat intelligence and response services.
Trend
Cloud-Native, Managed Architectures Become the Default
Security architectures are moving toward managed, cloud-native systems that combine model hosting, guardrails, and observability. Cloud deployments are becoming the norm as organizations focus on scalability, quick updates, and centralized governance. LLM capabilities are increasingly integrated into software portfolios, making AI-assisted security a standard feature rather than an extra add-on.
Network Security and AI-Driven Intelligence Gain Priority
Adoption is strongest in network security, where teams analyze signals from endpoints, traffic, and identities in real-time. Boards and CISOs are increasing investment in AI-powered threat intelligence and proactive defense as essential parts of their cyber risk strategies. This change positions LLM-powered security platforms as long-term infrastructure investments that keep pace with evolving threats and regulatory demands.
Recent Developments
Feb 2025 – Palo Alto Networks: Expanded Precision AI coverage across portfolio and highlighted Cloud-Delivered Security Services that draw on telemetry from over 70,000 customers to deliver real-time prevention across cloud, endpoint, and network controls. This scale strengthens platform economics and reinforces unified defense positioning for large enterprise buyers.
Mar 2025 – Microsoft: Unveiled Security Copilot agents for phishing triage, insider risk, vulnerability remediation, identity policy tuning, and threat briefings; preview starts in April–May 2025, with Microsoft processing 84 trillion signals per day and observing 7,000 password attacks per second. The launch accelerates agentic automation across the Microsoft stack and increases customer lock-in for you as workflows shift to AI-assisted operations.
Apr 2025 – Lasso.security: Demonstrated GenAI and LLM runtime defenses at RSAC 2025, showcasing monitoring, policy enforcement, and guardrails for agents and applications across enterprise environments. The visibility boosts pipeline in regulated sectors and positions the firm as a specialist in AI runtime control you can deploy alongside existing security platforms.
Jul 2025 – Microsoft: Announced general availability of the Conditional Access Optimization Agent in Microsoft Entra to autonomously detect policy gaps and recommend one-click remediations, bringing continuous protection to identity workflows. The upgrade embeds AI into identity governance at scale and expands Copilot attach in enterprise accounts you manage.
Jul 2025 – Lasso.security: Established Lasso Federal LLC with Swish Data to deliver GenAI security to U.S. public sector programs, focusing on runtime monitoring, policy enforcement, and audit-ready logging for federal environments. The move opens federal procurement channels and deepens traction in high-compliance markets you target.
Sep 2025 – CrowdStrike: Reported an 85% quarter-over-quarter jump in Charlotte AI usage in Q2 FY2026, tied to an eight-figure re-Flex agreement and early SIEM displacement in a Fortune 500 software account; Street revenue outlook for FY2026 stands at USD 4.78 billion, up about 20.9% year over year. Higher AI adoption strengthens win rates and expands platform share in consolidated SOC stacks you evaluate.