
- Home
- Industries
 Aerospace And Defence
 Agriculture
 Automotive And Transportation
 Banking And Finance
 Business
 Chemicals And Materials
 Consumer And Retail
 Electronics And Semiconductors
 Food And Beverages
 Machinery & Equipments
 Manufacturing And Construction
 Medical Devices
 Others
 Pharmaceuticals And Healthcare
 Power And Energy
 Sports
 Technology
- Services
- News Room
- About us
- Contact Us
-
LNG Liquefaction Plant Market Size, Share & Forecast | CAGR 6.2%
Global LNG Liquefaction Plant Market Size, Share, Growth Analysis By Plant Type (Onshore Baseload Plants, Modular and Mid-Scale Onshore Plants, FLNG Plants), By Drive and Power Architecture (Gas-Turbine-Driven Plants, Electric-Motor-Driven Plants, Hybrid and Dual-Drive Plants), By Developer Type (NOC-Led Projects, IOC and Major-Led Projects, Independent Developer-Led Projects), Industry Trends, Investment Outlook, Competitive Landscape, Key Players, Project Pipeline, Regional Insights & Forecast 2026–2034

Report Overview
| Market Size (2025) | Forecast Value (2034) | CAGR (2026–2034) | Largest Region (2025) |
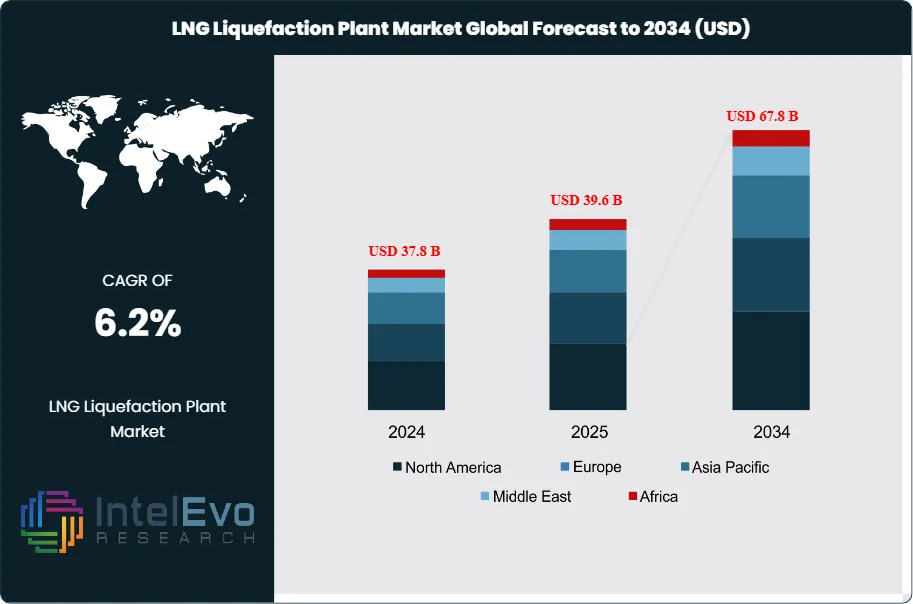
| USD 39.6 Billion | USD 67.8 Billion | 6.2% | North America, 34.0% |
The LNG Liquefaction Plant Market was valued at approximately USD 37.8 Billion in 2024 and increased to USD 39.6 Billion in 2025. The market is projected to reach nearly USD 67.8 Billion by 2034, expanding at a compound annual growth rate (CAGR) of around 6.2% during the forecast period from 2026 to 2034. The LNG liquefaction plant market is expanding on the back of a record post-FID capacity wave, stronger long-term LNG demand expectations, and a deeper project pipeline across the United States, Qatar, Canada, the UAE, and selected African markets.
Get More Information about this report -
Request Free Sample ReportThis report models the LNG liquefaction plant market as EPC scope, liquefaction process technology, cryogenic heat exchangers, compression systems, tanks, balance-of-plant, and digital control layers tied to export facilities and large-scale liquefaction trains. The market’s core search terms center on LNG liquefaction plant market size, LNG liquefaction plant market growth, LNG liquefaction plant market forecast 2034, LNG liquefaction plant market share, LNG liquefaction plant market trends 2025, global LNG liquefaction plant analysis, onshore LNG plant market, FLNG liquefaction market, modular LNG liquefaction plant demand, North America LNG liquefaction plant market, Europe LNG liquefaction plant market, and Asia Pacific LNG liquefaction plant market.
The LNG liquefaction plant market in 2025 reflects a supply chain that moved from scarcity to expansion, but not without cost pressure. IEA data shows roughly 670 bcm per year of global liquefaction capacity already in place, with nearly 290 bcm per year of additional post-FID capacity expected by 2030. IGU reports global liquefaction capacity at 494.4 MTPA at year-end 2024, while Shell notes that 2024 posted the weakest annual capacity addition in a decade before the next investment cycle accelerated. That combination matters. Owners are moving faster on sanctioned projects, yet contractors and equipment suppliers still face long-lead bottlenecks in compressors, main cryogenic heat exchangers, electrical systems, and skilled field labor. Those constraints keep procurement discipline tight and favor companies with proven LNG execution records.
Demand signals remain firm enough to support the LNG liquefaction plant market through 2034. Shell’s 2025 outlook points to a roughly 60% rise in global LNG demand by 2040, driven mainly by Asian power demand, heavy industry, shipping, and the electricity needs tied to AI-linked data center growth. IEA also expects about 300 bcm per year of new LNG export capacity by 2030, led by the United States and Qatar. Those signals support multi-train baseload projects first, then modular and electrified designs where capital intensity, emissions control, and build speed carry more weight. In 2025, onshore baseload plants account for 64.0% of LNG liquefaction plant market revenue, while North America leads with 34.0% share, or USD 13.5 Billion, due to the scale of U.S. Gulf Coast construction and Canada’s first Pacific Coast export start-up.
Regulation is shaping project design more directly than it did in the last cycle. U.S. export permits, FERC environmental reviews, and non-FTA authorizations still affect project timing. The UAE’s Ruwais project and several new standardized solutions also show the direction of travel toward electric-drive trains, automation, and lower-emission designs. ABB’s 2025 award on Ruwais highlights the rising share of digital controls, automation, and electrical scope inside new LNG liquefaction plant market contracts. Risk remains concentrated in cost inflation, schedule slippage, policy reversals, and offtake timing, but the investment hotspots are clear. The U.S. Gulf Coast, Qatar, Western Canada, Abu Dhabi, and selected U.S. brownfield expansions are setting the pace for the LNG liquefaction plant market through the remainder of the decade.
, By Drive and Power Architecture (Gas-Turbine-Driven Plants, Electric-Motor-Driven Plants, Hybrid and Dual-Drive Plants), By Developer Type (NOC-Led Projects, IOC and Major-Led Projects, Independent Developer-Led Projects), Industry Trends, Investment Outlook, Competitive Landscape, Key Players, Project Pipeline, Regional Insights & Forecast 2026–2034")
Key Takeaways
- Market Growth: The LNG liquefaction plant market stands at USD 39.6 Billion, 2025 and is projected to reach USD 67.8 Billion, 2034. That implies a 6.2% CAGR across 2025–2034, supported by the record post-FID export capacity wave now visible in IEA and IGU datasets.
- Segment Dominance: Onshore baseload plants lead the LNG liquefaction plant market by plant type with 64.0% share, 2025, equal to USD 25.3 Billion. The segment holds the largest EPC, cryogenic, storage, and compression scope per project.
- Segment Dominance: NOC-led projects lead by developer type with 41.0% share, 2025, equal to USD 16.2 Billion. Qatar Energy and ADNOC remain major anchors for large train awards and long-cycle equipment demand.
- Driver: The main driver is the sanctioned supply wave. IEA expects about 290-300 bcm/year of new post-FID LNG export capacity by 2030, while Shell sees global LNG demand reaching 630-718 MTPA by 2040. That pipeline lifts plant engineering and equipment demand across the forecast window.
- Restraint: Cost pressure is slowing project conversion. Reuters reported the Plaquemines LNG project cost moving to USD 21-22 Billion in 2024, while analysts also flagged rising U.S. terminal costs as a threat to new-project competitiveness.
- Opportunity: Electrified and lower-emission plants are the clearest white-space opportunity. ADNOC’s Ruwais project uses two electric-drive trains and ABB’s 2025 package adds advanced automation and electrical systems, pointing to a premium design niche that can capture USD 8.6 Billion of market revenue by 2034.
- Trend: Standardized and modular liquefaction is gaining share. Technip Energies’ SnapLNG offers a 2.5 MTPA electrically driven train format and claims delivery savings of more than two years versus conventional execution. That is shifting buyer interest toward repeatable train designs.
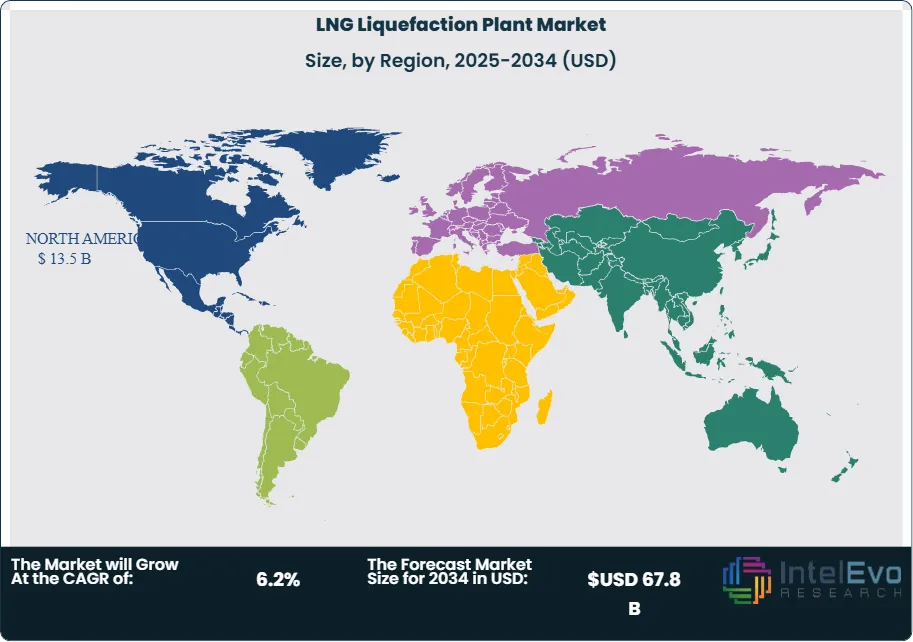
- Regional Analysis: North America leads the LNG liquefaction plant market with 34.0% share, 2025, equal to USD 13.5 Billion. U.S. Gulf Coast EPC activity and Canada’s first Pacific Coast LNG exports keep the region ahead.
Competitive Landscape
The LNG liquefaction plant market is moderately consolidated. The top four players control about 40.0% of 2025 market revenue. Competition is execution-led and technology-led rather than purely price-led because LNG owners place the highest weight on train reliability, schedule certainty, and bankable reference plants. Competitive intensity increased in 2025 as Commonwealth, Qatar, and Gulf Coast projects released new equipment packages, while Honeywell’s LNG technology acquisition and fresh FEED or EPC awards widened the field around the established EPC leaders.
| Company | Headquarters | Market Position | Key Product/Solution | Geographic Strength | Recent Strategic Move |
| TECHNIP ENERGIES | France | Leader | SnapLNG by T.EN™ | Middle East, Europe | Received Commonwealth LNG authorization for key equipment purchase orders for a 9.5 Mtpa plant in Dec 2025. |
| BECHTEL | United States | Leader | LNG EPC for Corpus Christi Stage 3 | North America | Advanced Corpus Christi Stage 3, with Train 1 reaching substantial completion in Mar 2025. |
| JGC HOLDINGS | Japan | Leader | LNG EPC and commissioning services | Asia Pacific, Middle East | Continued execution on LNG Canada and remained part of the Ruwais LNG EPC consortium; JGC states it has built plants covering over 30% of current world LNG production. |
| MCDERMOTT | United States | Leader | Golden Pass LNG EPC JV scope | North America | Executed the Trains 2 and 3 contract amendment at Golden Pass LNG in Nov 2025, after prior restructuring steps in 2024-2025. |
| HONEYWELL | United States | Challenger | LNG pretreatment and cryogenic technology portfolio | North America, Middle East | Completed the USD 1.81 Billion acquisition of Air Products’ LNG technology and equipment business in Sep 2024. |
| BAKER HUGHES | United States | Challenger | NMBL™ Modular LNG and LM9000-based compressor trains | North America | Won Commonwealth LNG liquefaction equipment scope in Dec 2025 after earlier project authorization for six refrigerant compressors in Aug 2025. |
| LINDE ENGINEERING | Germany | Challenger | Coil-wound heat exchangers and LNG process technology | Europe, Middle East | Continued positioning in cryogenic equipment, backed by proprietary CWHE and PFHE offerings used across LNG plants worldwide. |
| SIEMENS ENERGY | Germany | Niche Player | LNG compression and integrated electrical solutions | Europe, North America | Expanded its lower-emission LNG profile through electrical and compression offerings and prior work on Woodfibre LNG’s hydro-powered design. |
| KBR | United States | Niche Player | FEED and LNG project development support | North America, Africa | Won FEED for Coastal Bend LNG in Jan 2026, with multiple liquefaction trains and ConocoPhillips Optimized Cascade® technology. |
| BLACK & VEATCH | United States | Niche Player | Modular and mid-scale LNG design-build services | North America | Continued to target mid-scale and modular LNG opportunities where speed and smaller capital tickets matter; the segment remains favored by developers outside mega-train baseload hubs. |
By Plant Type.
Onshore baseload plants dominate the LNG liquefaction plant market with 64.0% share, 2025, equal to USD 25.3 Billion. They win because most sanctioned capacity sits in multi-train export terminals in the U.S., Qatar, Canada, and the UAE. These plants absorb the largest EPC packages, cryogenic trains, storage tanks, marine loading systems, and utility blocks. Modular and mid-scale onshore plants hold 22.0% share, or USD 8.7 Billion, and are gaining ground where developers want lower capital exposure, phased offtake ramp-up, and faster construction. Baker Hughes’ NMBL and Technip Energies’ SnapLNG reflect that shift toward repeatable train blocks in the 0.8 to 2.5 MTPA range. FLNG plants represent 14.0% share, or USD 5.5 Billion, and remain important in stranded-gas and offshore monetization cases, but they stay smaller in count because financing, offshore integration, and marine risk remain tougher than for fixed onshore assets. Competitive positioning is strongest for contractors with proven baseload references, while modular formats open space for equipment-led challengers and smaller EPC houses.
By Drive and Power Architecture.
Gas-turbine-driven plants account for 71.0% of LNG liquefaction plant market revenue in 2025, or USD 28.1 Billion. They still lead because the installed base, reference bankability, and contractor familiarity remain high across U.S. Gulf Coast and legacy Qatar-style trains. Electric-motor-driven plants now represent 17.0% share, or USD 6.7 Billion, and they are rising faster than the broader market because regulators, lenders, and premium Asian buyers are pressing for lower lifecycle emissions and tighter operational control. Ruwais LNG is the clearest signal. The project uses two electric-drive trains, and ABB’s 2025 award confirms that electrification now pulls in high-value automation, electrical, and digital packages along with the core process scope. Hybrid and dual-drive plants hold the remaining 12.0% share, or USD 4.8 Billion. These designs suit brownfield expansions and power-constrained regions where developers need better emissions performance without fully redesigning site utilities. The result is a plant market where drive architecture is no longer a secondary engineering detail. It is a commercial differentiator that changes emissions intensity, equipment mix, financing posture, and offtake appeal.
By Developer Type.
NOC-led projects lead the LNG liquefaction plant market with 41.0% share, 2025, equal to USD 16.2 Billion. That position rests on the scale of QatarEnergy and ADNOC programs, their access to upstream gas, and their ability to place long-cycle orders earlier than merchant developers. These projects favor top-tier EPC consortia and process licensors because execution failure carries national revenue and energy policy risk. IOC and major-led projects account for 34.0% share, or USD 13.5 Billion. Shell’s role in LNG Canada and major-company participation across Qatar and other export hubs keep this segment large. Majors usually demand strong cost control, strong HSE records, and proven commissioning depth, which narrows the field to the most established contractors. Independent developer-led projects hold 25.0% share, or USD 9.9 Billion. This segment includes U.S. developers that depend more heavily on SPAs, non-FTA approvals, and staged project financing. It can produce fast growth, but it also sees the most delay risk when cost inflation or permitting uncertainty hits. For the LNG liquefaction plant market, the developer mix directly shapes contract structure, payment timing, technology choice, and award concentration.
Regional Analysis
North America
North America holds 34.0% of the LNG liquefaction plant market in 2025, equal to USD 13.5 Billion. The United States is the clear core, contributing about USD 10.8 Billion of regional revenue as Gulf Coast projects continue to absorb EPC, compressor, storage, and controls spending. Bechtel’s active scope at Port Arthur, Corpus Christi Stage 3, and Rio Grande underlines the concentration of execution in the region. Canada adds about USD 1.6 Billion in 2025, lifted by LNG Canada’s first cargo in June 2025 and the broader signal that Pacific Coast liquefaction is now commercial reality. Mexico contributes about USD 0.7 Billion, led by smaller export and floating formats, while the rest of North America contributes USD 0.4 Billion. The region benefits from abundant feedgas, mature contractor ecosystems, large-scale financing capacity, and the strongest near-term project visibility worldwide. The main risks are labor scarcity, equipment lead times, cost inflation, and federal permit timing. Even so, North America remains the reference market for LNG liquefaction plant market growth through 2034.
Europe
Europe represents 9.0% of the LNG liquefaction plant market in 2025, equal to USD 3.6 Billion. Europe is not the main new-build export hub, but it remains central to the LNG liquefaction plant market through engineering, cryogenic equipment, automation, and project management. France contributes about USD 0.9 Billion, mainly through Technip Energies’ project leadership and process design role. Germany contributes USD 0.8 Billion, supported by Linde’s cryogenic heat exchangers and Siemens Energy’s compression and electrical scope. The United Kingdom contributes USD 0.7 Billion through owner, trader, and project development influence, while Norway adds USD 0.5 Billion through smaller liquefaction and offshore-adjacent technical know-how; the rest of Europe contributes USD 0.7 Billion. Europe’s regulatory framework pushes lower-emission design choices harder than most regions, which helps electric-drive, digital control, and efficiency packages win share. The market is therefore smaller in physical trains but stronger in high-value engineering content. That makes Europe important to margins even when train count is lower than in North America or the Middle East.
Asia Pacific
Asia Pacific accounts for 23.0% of the LNG liquefaction plant market in 2025, or USD 9.1 Billion. China leads the regional revenue pool at about USD 2.7 Billion, driven by owner procurement, EPC participation, and import-linked long-term contracting that influences upstream plant sanctions. Japan contributes about USD 2.2 Billion, anchored by JGC’s global LNG EPC role and Japanese buyer participation in large export ventures such as LNG Canada. India contributes USD 1.4 Billion as a rising long-term LNG buyer whose contracts increasingly support upstream liquefaction economics. Australia contributes USD 1.2 Billion, helped by Woodside’s Louisiana LNG FID and its wider LNG project expertise, while the rest of Asia Pacific contributes USD 1.6 Billion. Asia Pacific matters because it is both the largest end-market for LNG and a major source of engineering, procurement, and offtake capital. Shell and IGU both point to Asia as the main force behind long-run LNG demand growth, which keeps the region central to final investment decisions even when most new trains are built elsewhere.
Latin America
Latin America holds 7.0% of the LNG liquefaction plant market in 2025, equal to USD 2.8 Billion. Brazil leads with about USD 1.0 Billion, reflecting its role in gas market reform and emerging LNG-linked infrastructure demand. Mexico contributes USD 0.8 Billion, supported by fast-track export formats and proximity to U.S. gas supply. Argentina contributes USD 0.4 Billion as unconventional gas monetization keeps liquefaction concepts active, while the rest of Latin America contributes USD 0.6 Billion. The region’s investment case is less about mega-train density today and more about optionality. Developers value shorter-cycle formats, floating solutions, and staged buildouts that reduce balance-sheet risk. That favors modular OEMs, specialized cryogenic suppliers, and EPC firms willing to work on smaller ticket sizes. The region’s challenge is financing depth and policy continuity. Its advantage is access to feedgas and the ability to move earlier on niche export opportunities than on megaprojects. Latin America therefore remains a smaller share of the LNG liquefaction plant market in 2025 but a useful growth pocket over the forecast period.
Middle East & Africa
Middle East & Africa account for 27.0% of the LNG liquefaction plant market in 2025, equal to USD 10.7 Billion. Qatar is the regional anchor at about USD 5.3 Billion because North Field expansion remains one of the largest global train programs, with capacity expected to rise from 77 MTPA to 126 MTPA by 2027. The UAE contributes USD 2.1 Billion, driven by the Ruwais LNG EPC award and its all-electric design. Saudi Arabia contributes USD 1.2 Billion through growing LNG offtake and project participation, while South Africa contributes USD 0.5 Billion through long-cycle project development; the rest of MEA adds USD 1.6 Billion. Africa also offers selective upside in export monetization, although timelines remain less certain than in Qatar or Abu Dhabi. The region benefits from resource depth and strong sovereign backing, but schedule risk can rise where infrastructure, contracting capacity, or politics weaken. In value terms, Middle East & Africa remain the second-largest LNG liquefaction plant market because the average project is large, capital-heavy, and increasingly tied to lower-emission plant design.
Get More Information about this report -
Request Free Sample ReportMarket Key Segments
By Plant Type
- Onshore Baseload Plants
- Modular and Mid-Scale Onshore Plants
- FLNG Plants
By Drive and Power Architecture
- Gas-Turbine-Driven Plants
- Electric-Motor-Driven Plants
- Hybrid and Dual-Drive Plants
By Developer Type
- NOC-Led Projects
- IOC and Major-Led Projects
- Independent Developer-Led Projects
Regional Analysis and Coverage
- North America
- Latin America
- East Asia And Pacific
- Sea And South Asia
- Eastern Europe
- Western Europe
- Middle East & Africa
| Report Attribute | Details |
| Market size (2025) | USD 39.6 B |
| Forecast Revenue (2034) | USD 67.8 B |
| CAGR (2025-2034) | 6.2% |
| Historical data | 2021-2024 |
| Base Year For Estimation | 2025 |
| Forecast Period | 2026-2034 |
| Report coverage | Revenue Forecast, Competitive Landscape, Market Dynamics, Growth Factors, Trends and Recent Developments |
| Segments covered | By Plant Type (Onshore Baseload Plants, Modular and Mid-Scale Onshore Plants, FLNG Plants), By Drive and Power Architecture (Gas-Turbine-Driven Plants, Electric-Motor-Driven Plants, Hybrid and Dual-Drive Plants), By Developer Type (NOC-Led Projects, IOC and Major-Led Projects, Independent Developer-Led Projects) |
| Research Methodology |
|
| Regional scope |
|
| Competitive Landscape | TECHNIP ENERGIES, BECHTEL, JGC HOLDINGS, MCDERMOTT, HONEYWELL, BAKER HUGHES, LINDE ENGINEERING, SIEMENS ENERGY, KBR, BLACK & VEATCH, CHIYODA CORPORATION, FLUOR, WOODSIDE ENERGY, QATARENERGY, ADNOC, NEXTDECADE, COMMONWEALTH LNG, Others |
| Customization Scope | Customization for segments, region/country-level will be provided. Moreover, additional customization can be done based on the requirements. |
| Pricing and Purchase Options | Avail customized purchase options to meet your exact research needs. We have three licenses to opt for: Single User License, Multi-User License (Up to 5 Users), Corporate Use License (Unlimited User and Printable PDF). |
, By Drive and Power Architecture (Gas-Turbine-Driven Plants, Electric-Motor-Driven Plants, Hybrid and Dual-Drive Plants), By Developer Type (NOC-Led Projects, IOC and Major-Led Projects, Independent Developer-Led Projects), Industry Trends, Investment Outlook, Competitive Landscape, Key Players, Project Pipeline, Regional Insights & Forecast 2026–2034")
, By Drive and Power Architecture (Gas-Turbine-Driven Plants, Electric-Motor-Driven Plants, Hybrid and Dual-Drive Plants), By Developer Type (NOC-Led Projects, IOC and Major-Led Projects, Independent Developer-Led Projects), Industry Trends, Investment Outlook, Competitive Landscape, Key Players, Project Pipeline, Regional Insights & Forecast 2026–2034")
, By Drive and Power Architecture (Gas-Turbine-Driven Plants, Electric-Motor-Driven Plants, Hybrid and Dual-Drive Plants), By Developer Type (NOC-Led Projects, IOC and Major-Led Projects, Independent Developer-Led Projects), Industry Trends, Investment Outlook, Competitive Landscape, Key Players, Project Pipeline, Regional Insights & Forecast 2026–2034")
Frequently Asked Questions
How big is the LNG Liquefaction Plant Market?
The Global LNG Liquefaction Plant Market was valued at USD 39.6 Billion in 2025, projected to reach USD 67.8 Billion by 2034, growing at a CAGR of 6.2% from 2026–2034, driven by rising LNG demand, export capacity expansion, and investments in large-scale liquefaction infrastructure.
Who are the major players in the LNG Liquefaction Plant Market?
TECHNIP ENERGIES, BECHTEL, JGC HOLDINGS, MCDERMOTT, HONEYWELL, BAKER HUGHES, LINDE ENGINEERING, SIEMENS ENERGY, KBR, BLACK & VEATCH, CHIYODA CORPORATION, FLUOR, WOODSIDE ENERGY, QATARENERGY, ADNOC, NEXTDECADE, COMMONWEALTH LNG, Others
Which segments covered the LNG Liquefaction Plant Market?
By Plant Type (Onshore Baseload Plants, Modular and Mid-Scale Onshore Plants, FLNG Plants), By Drive and Power Architecture (Gas-Turbine-Driven Plants, Electric-Motor-Driven Plants, Hybrid and Dual-Drive Plants), By Developer Type (NOC-Led Projects, IOC and Major-Led Projects, Independent Developer-Led Projects)
How can this market research report help my business make strategic decisions?
Our market research reports provide actionable intelligence, including verified market size data, CAGR projections, competitive benchmarking, and segment-level opportunity analysis. These insights support strategic planning, investment decisions, product development, and market entry strategies for enterprises and startups alike.
How frequently is the data updated?
We continuously monitor industry developments and update our reports to reflect regulatory changes, technological advancements, and macroeconomic shifts. Updated editions ensure you receive the latest market intelligence.

Select Licence Type
Connect with our sales team
LNG Liquefaction Plant Market
Published Date : 20 Mar 2026 | Formats :Why IntelEvoResearch
100%
Customer
Satisfaction
24x7+
Availability - we are always
there when you need us
200+
Fortune 50 Companies trust
IntelEvoResearch
80%
of our reports are exclusive
and first in the industry
100%
more data
and analysis
1000+
reports published
till date
