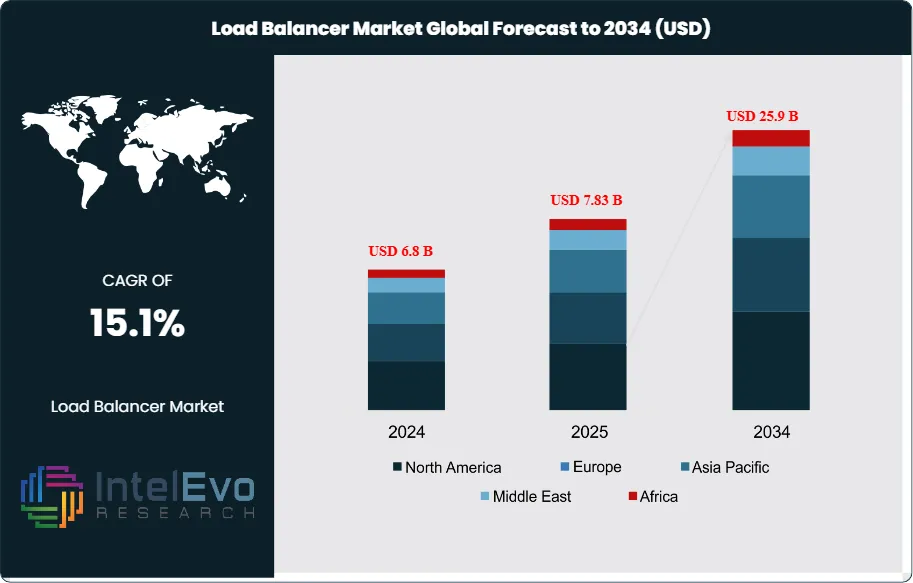
The Load Balancer Market is valued at approximately USD 6.8 Billion in 2024 and is projected to reach nearly USD 25.9 Billion by 2034, expanding at a CAGR of around 15.1% during 2025–2034. The surge in multi-cloud deployments, API-driven applications, and AI-enabled traffic optimization is reshaping demand globally. As enterprises scale microservices and edge workloads, advanced load-balancing tools are becoming mission-critical for reliability, latency reduction, and zero-downtime performance.
This trajectory reflects a market that is scaling from foundational, hardware-centric application delivery controllers to software-defined, cloud-native, and managed services models. Based on the current run-rate, the market is set to more than triple (+USD 13.9 billion, ~3.6x expansion) over the decade, with a mid-cycle inflection surpassing USD 10.2 billion by 2028 as enterprises re-platform latency-sensitive workloads and modernize network stacks.
Demand is underpinned by three durable forces: the migration of enterprise applications to multi-cloud and hybrid environments; the proliferation of connected endpoints and microservices architectures; and the non-negotiable requirement for always-on digital experiences. On the supply side, vendors are shifting toward elastic, subscription-based offerings that bundle L4–L7 traffic management with security controls (WAF, DDoS mitigation) and observability. Key growth drivers include surging internet traffic, containerized deployments (e.g., Kubernetes Ingress), and edge computing, which together increase the frequency and amplitude of traffic spikes that load balancers must absorb. Principal challenges remain architectural complexity, skills gaps in SRE/NetOps teams, and concerns over vendor lock-in and regulatory constraints such as data residency, all of which can elongate decision cycles and total cost of ownership.
Technology innovation is reshaping adoption patterns. AI- and ML-enhanced engines are moving from reactive to predictive traffic steering, enabling automated failover and adaptive capacity planning. Cloud-native designs are displacing appliance footprints through programmable data planes (including eBPF), API-centric control, and deep integration with service meshes. Illustrative moves include decentralized approaches such as ZeroLB by Kong—reducing reliance on traditional load balancers by embedding routing into the mesh—and portfolio consolidation exemplified by Progress’s USD 258 million acquisition of Kemp to expand application management breadth.
Regionally, North America leads on revenue, supported by hyperscaler ecosystems and early adopter enterprises, while Europe maintains steady modernization linked to privacy and digital sovereignty initiatives. Asia–Pacific is the fastest-growing corridor, propelled by rapid digitization in India and Southeast Asia and accelerated 5G/edge rollouts; investors should watch cloud-native and managed load-balancing services in these markets. Emerging opportunities span API security convergence, telemetry-rich analytics, and offload to smartNICs/DPUs—capabilities that reduce latency and operating expense while hardening resilience across distributed, multi-cloud topologies.
Key Takeaways
Market Growth: The global Load Balancer market was USD 6.8 Billion in 2024 and is projected to reach USD 25.9 Billion by 2034 at a 15.1% CAGR—an incremental expansion of ~USD 13.9 billion (~3.6x)—driven by multi-cloud adoption, microservices, and always-on digital experiences; the base remains hardware-heavy (56% in 2024), even as software/cloud models accelerate.
Segment Dominance – Deployment Model: On-premise led with 52.4% share in 2024 (~USD 2.83 billion), sustained by data-sovereignty mandates, low-latency requirements, and sunk capex in enterprise data centers; cloud-managed load balancing is scaling faster as organizations re-platform tier-1 applications.
Segment Dominance – Product Scope: Global load balancers (GSLB) captured >67% share in 2024 (~USD 3.62 billion), reflecting multi-region architectures, anycast/DNS traffic steering, and CDN integration that prioritize uptime and geo-redundancy for mission-critical services.
Driver: Enterprise concentration remains high—Large Enterprises accounted for 64.5% of spend (~USD 3.48 billion) in 2024—while IT & Telecom was the top vertical at 22.4% (~USD 1.21 billion), underpinned by 5G rollouts, OTT traffic, and encrypted L7 workloads that require elastic, policy-aware balancing.
Restraint: Architectural complexity and migration risk slow cloud transitions; with >50% of 2024 spend tied to on-prem and 56% to hardware, organizations face longer integration timelines and higher TCO for hybrid operations, alongside skills gaps across SRE/NetOps and compliance constraints.
Opportunity: Cloud-native and managed L7 load balancing (including API-aware WAF/DDoS bundles) in Asia–Pacific is poised for outperformance (mid-teens CAGR expected), creating a multi-billion-dollar revenue pool by 2033 as digital infrastructure scales in India and Southeast Asia.
Trend: Adoption is shifting toward software-defined, programmable data planes (e.g., service mesh/Envoy, eBPF) and AI-assisted traffic management for predictive autoscaling and failure remediation; cloud platform offerings (e.g., AWS, Azure, GCP) and decentralized approaches (e.g., mesh-embedded routing) are compressing appliance footprints.
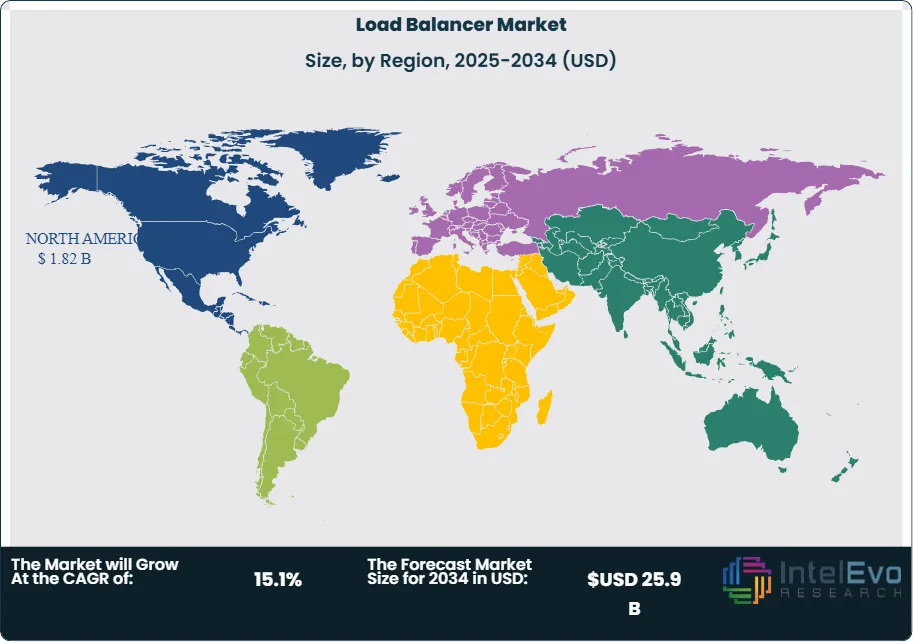
Regional Analysis: North America led with ~33.7% share in 2024 (~USD 1.82 billion) supported by hyperscaler ecosystems and early enterprise modernization; Europe follows with steady upgrades around digital sovereignty, while Asia–Pacific is the fastest-growing investment hotspot, outpacing the global CAGR on accelerating cloud, 5G, and edge deployments.
Component Analysis
Hardware remains the revenue anchor in 2025, underpinned by deterministic performance, L4–L7 offload (SSL/TLS termination, compression), and appliance-grade reliability demanded by high-throughput data centers. Building on its 56% share in 2024 (≈USD 3.0 billion), hardware still accounts for just above half of spend in 2025 (≈USD 3.8 billion out of an estimated USD ~7.0 billion market), supported by refresh cycles, data-center consolidation, and latency-sensitive workloads in regulated environments.
Software and services are growing faster than the total market as enterprises standardize on cloud-native stacks and shift to subscription and managed models. Virtual/software load balancers, service-mesh integrations, and provider-managed offerings (e.g., application gateways paired with WAF/DDoS) are expanding at a mid-to-high-teens pace, 200–400 bps above the market CAGR through 2030. By the late 2020s, software-plus-services is on course to overtake appliances on new deployments, helped by API-first control planes, automation, and lower initial capex.
Type Analysis
Global load balancers (GSLB) continue to lead on value creation, reflecting multi-region active-active architectures and stringent SLOs for digital channels. After capturing >67% in 2024 (≈USD 3.6 billion), GSLB represents roughly two-thirds of 2025 spend (≈USD 4.7 billion), powered by geo-routing, anycast/DNS steering, and disaster recovery requirements in e-commerce, fintech, and media. The ability to route around regional failures and reduce user-perceived latency is translating directly into higher attach rates for observability and security add-ons.
Local load balancers remain essential for intra-region distribution, east–west traffic, and Kubernetes ingress, particularly in edge locations and private clouds. Growth is sustained by microservices adoption and 5G/MEC rollouts, where localized traffic shaping and mTLS termination are required close to the workload. Vendors are bundling L7 policy, rate limiting, and API analytics to defend share in latency-critical sites.
Deployment Analysis
On-premise incumbency remains material—over 52.4% in 2024 (≈USD 2.83 billion)—as enterprises balance sovereignty, deterministic performance, and sunk capex. In 2025, hybrid dominates: on-premise still holds a slight majority of revenue, but its share is gradually diluting as refresh decisions pair appliances with virtual editions and cloud gateways for unified policy. Highly regulated BFSI, public sector, and exchange-connected workloads continue to favor on-prem for compliance and ultra-low latency.
Cloud load balancing is the structural growth engine, approaching parity by the latter 2020s as organizations consolidate tooling around provider-native gateways and third-party virtual appliances. Drivers include OpEx flexibility, autoscaling, global reach, and tight integration with CI/CD and Zero Trust controls. Expect cloud to surpass 50% share on new deployments by 2028–2029, with managed services capturing outsized growth in midmarket and greenfield builds.
Enterprise Size Analysis
Large enterprises remain the demand center, contributing 64.5% of 2024 spend (≈USD 3.5 billion) and still exceeding 60% in 2025. Their complex estates—spanning multi-cloud, private DCs, and edge—require advanced health checks, programmable data planes, and granular policy, alongside integrated WAF/DDoS and analytics. Multi-region failover testing and SRE-led reliability programs are increasing attach rates for premium features and support tiers.
SMEs are the fastest-rising cohort as managed L7 services and usage-based pricing compress time-to-value. Adoption is buoyed by SaaS-native architectures and container platforms, with SME growth expected to outpace the total market by 200–300 bps through 2030. This segment increasingly opts for opinionated, secure-by-default bundles that minimize NetOps overhead while meeting audit and uptime requirements.
Industry Vertical Analysis
IT & Telecom remains the single largest vertical—22.4% in 2024 (≈USD 1.2 billion)—and continues to expand in 2025 as 5G cores, streaming, and API-heavy services push encrypted L7 traffic and throughput peaks. BFSI ranks among the top adopters, driven by real-time payments, open banking, fraud analytics, and stringent resilience testing that favor GSLB and active-active topologies.
Retail/e-commerce and healthcare are the fastest climbers, propelled by peak-event elasticity, omnichannel experiences, telehealth, and HIPAA/GDPR-grade controls. Manufacturing is lifting investments around Industry 4.0 and edge gateways, while government programs prioritize sovereignty and continuity, sustaining on-prem and hybrid patterns.
Regional Analysis
North America remains the revenue leader with ~33.7% share in 2024 (≈USD 1.82 billion) and an estimated ≈USD 2.35 billion in 2025, anchored by hyperscaler ecosystems, early adoption of service-mesh patterns, and a high concentration of digital-native enterprises. Europe follows with steady modernization bounded by digital sovereignty and data-residency frameworks, sustaining hybrid topologies and regional GSLB deployments.
Asia Pacific is the fastest-growing corridor, outpacing the global CAGR through 2030 on the back of cloud adoption in India and Southeast Asia, domestic hyperscalers in China, and accelerated 5G/edge investments. Latin America and the Middle East & Africa are scaling from a smaller base with double-digit growth, led by fintech, e-commerce, and public-sector digitization that increasingly prefer managed L7 services to bridge skills and capex constraints.
By Component, Hardware, Software, Services, By Type, Local Load Balancers, Global Load Balancers, By Deployment, On-premise, Cloud, By Enterprise Size, Large Enterprises, SMEs, By Industry Vertical, BFSI, IT & Telecom, Retail, Government, Manufacturing, Healthcare, Others
Research Methodology
Primary Research- 100 Interviews of Stakeholders
Secondary Research
Desk Research
Regional scope
North America (United States, Canada, Mexico)
Latin America (Brazil, Argentina, Columbia)
East Asia And Pacific (China, Japan, South Korea, Australia, Cambodia, Fiji, Indonesia)
Sea And South Asia (India, Singapore, Thailand, Taiwan, Malaysia)
Eastern Europe (Poland, Russia, Czech Republic, Romania)
Western Europe (Germany, U.K., France, Spain, Itlay)
Middle East & Africa (GCC Countries, Egypt, Nigeria, South Africa, Israel)
Competitive Landscape
Radware, Amazon Web Services, Inc., A10 Networks, Inc., Imperva, International Business Machines (IBM) Corporation, Google LLC, Kemp Technologies, Inc., F5, Inc., Citrix Systems, Inc., Microsoft Corporation, Other Key Players
Customization Scope
Customization for segments, region/country-level will be provided. Moreover, additional customization can be done based on the requirements.
Pricing and Purchase Options
Avail customized purchase options to meet your exact research needs. We have three licenses to opt for: Single User License, Multi-User License (Up to 5 Users), Corporate Use License (Unlimited User and Printable PDF).
TABLE OF CONTENTS
1. EXECUTIVE SUMMARY
1.1. MARKET SNAPSHOT
1.2. KEY FINDINGS & INSIGHTS
1.3. ANALYST RECOMMENDATIONS
1.4. FUTURE OUTLOOK
2. RESEARCH METHODOLOGY
2.1. MARKET DEFINITION & SCOPE
2.2. RESEARCH OBJECTIVES: PRIMARY & SECONDARY DATA SOURCES
2.3. DATA COLLECTION SOURCES
2.3.1. COVERAGE OF 100+ PRIMARY RESEARCH/CONSULTATION CALLS WITH INDUSTRY STAKEHOLDERS
FIGURE 17 NORTH AMERICA LOAD BALANCER SYSTEM CURRENT AND FUTURE TYPE ANALYSIS, 2025–2034, (USD MILLION)
FIGURE 18 NORTH AMERICA LOAD BALANCER SYSTEM CURRENT AND FUTURE END USER ANALYSIS, 2025–2034, (USD MILLION)
FIGURE 19 MARKET SHARE BY COUNTRY
FIGURE 20 LATIN AMERICA LOAD BALANCER SYSTEM CURRENT AND FUTURE TYPE ANALYSIS, 2025–2034, (USD MILLION)
FIGURE 21 LATIN AMERICA LOAD BALANCER SYSTEM CURRENT AND FUTURE END USER ANALYSIS, 2025–2034, (USD MILLION)
FIGURE 22 MARKET SHARE BY COUNTRY
FIGURE 23 EASTERN EUROPE LOAD BALANCER SYSTEM CURRENT AND FUTURE TYPE ANALYSIS, 2025–2034, (USD MILLION)
FIGURE 24 EASTERN EUROPE LOAD BALANCER SYSTEM CURRENT AND FUTURE END USER ANALYSIS, 2025–2034, (USD MILLION)
FIGURE 25 MARKET SHARE BY COUNTRY
FIGURE 26 WESTERN EUROPE LOAD BALANCER SYSTEM CURRENT AND FUTURE TYPE ANALYSIS, 2025–2034, (USD MILLION)
FIGURE 27 WESTERN EUROPE LOAD BALANCER SYSTEM CURRENT AND FUTURE END USER ANALYSIS, 2025–2034, (USD MILLION)
FIGURE 28 MARKET SHARE BY COUNTRY
FIGURE 29 EAST ASIA AND PACIFIC LOAD BALANCER SYSTEM CURRENT AND FUTURE TYPE ANALYSIS, 2025–2034, (USD MILLION)
FIGURE 30 EAST ASIA AND PACIFIC LOAD BALANCER SYSTEM CURRENT AND FUTURE END USER ANALYSIS, 2025–2034, (USD MILLION)
FIGURE 31 MARKET SHARE BY COUNTRY
FIGURE 32 SEA AND SOUTH ASIA LOAD BALANCER SYSTEM CURRENT AND FUTURE TYPE ANALYSIS, 2025–2034, (USD MILLION)
FIGURE 33 SEA AND SOUTH ASIA LOAD BALANCER SYSTEM CURRENT AND FUTURE END USER ANALYSIS, 2025–2034, (USD MILLION)
FIGURE 34 MARKET SHARE BY COUNTRY
FIGURE 35 MIDDLE EAST AND AFRICA LOAD BALANCER SYSTEM CURRENT AND FUTURE TYPE ANALYSIS, 2025–2034, (USD MILLION)
FIGURE 36 MIDDLE EAST AND AFRICA LOAD BALANCER SYSTEM CURRENT AND FUTURE END USER ANALYSIS, 2025–2034, (USD MILLION)
FIGURE 37 NORTH AMERICA LOAD BALANCER SYSTEM CURRENT AND FUTURE MARKET VOLUME SHARE REGIONAL ANALYSIS, 2025–2034, (USD MILLION)
FIGURE 38 U.S. LOAD BALANCER SYSTEM CURRENT AND FUTURE TYPE ANALYSIS, 2025–2034, (USD MILLION)
FIGURE 39 U.S. LOAD BALANCER SYSTEM CURRENT AND FUTURE END USER ANALYSIS, 2025–2034, (USD MILLION)
FIGURE 40 CANADA LOAD BALANCER SYSTEM CURRENT AND FUTURE TYPE ANALYSIS, 2025–2034, (USD MILLION)
FIGURE 41 CANADA LOAD BALANCER SYSTEM CURRENT AND FUTURE END USER ANALYSIS, 2025–2034, (USD MILLION)
FIGURE 42 LATIN AMERICA LOAD BALANCER SYSTEM CURRENT AND FUTURE MARKET VOLUME SHARE REGIONAL ANALYSIS, 2025–2034, (USD MILLION)
FIGURE 43 MEXICO LOAD BALANCER SYSTEM CURRENT AND FUTURE TYPE ANALYSIS, 2025–2034, (USD MILLION)
FIGURE 44 MEXICO LOAD BALANCER SYSTEM CURRENT AND FUTURE END USER ANALYSIS, 2025–2034, (USD MILLION)
FIGURE 45 BRAZIL LOAD BALANCER SYSTEM CURRENT AND FUTURE TYPE ANALYSIS, 2025–2034, (USD MILLION)
FIGURE 46 BRAZIL LOAD BALANCER SYSTEM CURRENT AND FUTURE END USER ANALYSIS, 2025–2034, (USD MILLION)
FIGURE 47 ARGENTINA LOAD BALANCER SYSTEM CURRENT AND FUTURE TYPE ANALYSIS, 2025–2034, (USD MILLION)
FIGURE 48 ARGENTINA LOAD BALANCER SYSTEM CURRENT AND FUTURE END USER ANALYSIS, 2025–2034, (USD MILLION)
FIGURE 49 COLUMBIA LOAD BALANCER SYSTEM CURRENT AND FUTURE TYPE ANALYSIS, 2025–2034, (USD MILLION)
FIGURE 50 COLUMBIA LOAD BALANCER SYSTEM CURRENT AND FUTURE END USER ANALYSIS, 2025–2034, (USD MILLION)
FIGURE 51 REST OF LATIN AMERICA LOAD BALANCER SYSTEM CURRENT AND FUTURE TYPE ANALYSIS, 2025–2034, (USD MILLION)
FIGURE 52 REST OF LATIN AMERICA LOAD BALANCER SYSTEM CURRENT AND FUTURE END USER ANALYSIS, 2025–2034, (USD MILLION)
FIGURE 53 EASTERN EUROPE LOAD BALANCER SYSTEM CURRENT AND FUTURE MARKET VOLUME SHARE REGIONAL ANALYSIS, 2025–2034, (USD MILLION)
FIGURE 54 POLAND LOAD BALANCER SYSTEM CURRENT AND FUTURE TYPE ANALYSIS, 2025–2034, (USD MILLION)
FIGURE 55 POLAND LOAD BALANCER SYSTEM CURRENT AND FUTURE END USER ANALYSIS, 2025–2034, (USD MILLION)
FIGURE 56 RUSSIA LOAD BALANCER SYSTEM CURRENT AND FUTURE TYPE ANALYSIS, 2025–2034, (USD MILLION)
FIGURE 57 RUSSIA LOAD BALANCER SYSTEM CURRENT AND FUTURE END USER ANALYSIS, 2025–2034, (USD MILLION)
FIGURE 58 CZECH REPUBLIC LOAD BALANCER SYSTEM CURRENT AND FUTURE TYPE ANALYSIS, 2025–2034, (USD MILLION)
FIGURE 59 CZECH REPUBLIC LOAD BALANCER SYSTEM CURRENT AND FUTURE END USER ANALYSIS, 2025–2034, (USD MILLION)
FIGURE 60 ROMANIA LOAD BALANCER SYSTEM CURRENT AND FUTURE TYPE ANALYSIS, 2025–2034, (USD MILLION)
FIGURE 61 ROMANIA LOAD BALANCER SYSTEM CURRENT AND FUTURE END USER ANALYSIS, 2025–2034, (USD MILLION)
FIGURE 62 REST OF EASTERN EUROPE LOAD BALANCER SYSTEM CURRENT AND FUTURE TYPE ANALYSIS, 2025–2034, (USD MILLION)
FIGURE 63 REST OF EASTERN EUROPE LOAD BALANCER SYSTEM CURRENT AND FUTURE END USER ANALYSIS, 2025–2034, (USD MILLION)
FIGURE 64 WESTERN EUROPE LOAD BALANCER SYSTEM CURRENT AND FUTURE MARKET VOLUME SHARE REGIONAL ANALYSIS, 2025–2034, (USD MILLION)
FIGURE 65 GERMANY LOAD BALANCER SYSTEM CURRENT AND FUTURE TYPE ANALYSIS, 2025–2034, (USD MILLION)
FIGURE 66 GERMANY LOAD BALANCER SYSTEM CURRENT AND FUTURE END USER ANALYSIS, 2025–2034, (USD MILLION)
FIGURE 67 FRANCE LOAD BALANCER SYSTEM CURRENT AND FUTURE TYPE ANALYSIS, 2025–2034, (USD MILLION)
FIGURE 68 FRANCE LOAD BALANCER SYSTEM CURRENT AND FUTURE END USER ANALYSIS, 2025–2034, (USD MILLION)
FIGURE 69 UK LOAD BALANCER SYSTEM CURRENT AND FUTURE TYPE ANALYSIS, 2025–2034, (USD MILLION)
FIGURE 70 UK LOAD BALANCER SYSTEM CURRENT AND FUTURE END USER ANALYSIS, 2025–2034, (USD MILLION)
FIGURE 71 SPAIN LOAD BALANCER SYSTEM CURRENT AND FUTURE TYPE ANALYSIS, 2025–2034, (USD MILLION)
FIGURE 72 SPAIN LOAD BALANCER SYSTEM CURRENT AND FUTURE END USER ANALYSIS, 2025–2034, (USD MILLION)
FIGURE 73 ITALY LOAD BALANCER SYSTEM CURRENT AND FUTURE TYPE ANALYSIS, 2025–2034, (USD MILLION)
FIGURE 74 ITALY LOAD BALANCER SYSTEM CURRENT AND FUTURE END USER ANALYSIS, 2025–2034, (USD MILLION)
FIGURE 75 REST OF WESTERN EUROPE LOAD BALANCER SYSTEM CURRENT AND FUTURE TYPE ANALYSIS, 2025–2034, (USD MILLION)
FIGURE 76 REST OF WESTERN EUROPE LOAD BALANCER SYSTEM CURRENT AND FUTURE END USER ANALYSIS, 2025–2034, (USD MILLION)
FIGURE 77 EAST ASIA AND PACIFIC LOAD BALANCER SYSTEM CURRENT AND FUTURE MARKET VOLUME SHARE REGIONAL ANALYSIS, 2025–2034, (USD MILLION)
FIGURE 78 CHINA LOAD BALANCER SYSTEM CURRENT AND FUTURE TYPE ANALYSIS, 2025–2034, (USD MILLION)
FIGURE 79 CHINA LOAD BALANCER SYSTEM CURRENT AND FUTURE END USER ANALYSIS, 2025–2034, (USD MILLION)
FIGURE 80 JAPAN LOAD BALANCER SYSTEM CURRENT AND FUTURE TYPE ANALYSIS, 2025–2034, (USD MILLION)
FIGURE 81 JAPAN LOAD BALANCER SYSTEM CURRENT AND FUTURE END USER ANALYSIS, 2025–2034, (USD MILLION)
FIGURE 82 AUSTRALIA LOAD BALANCER SYSTEM CURRENT AND FUTURE TYPE ANALYSIS, 2025–2034, (USD MILLION)
FIGURE 83 AUSTRALIA LOAD BALANCER SYSTEM CURRENT AND FUTURE END USER ANALYSIS, 2025–2034, (USD MILLION)
FIGURE 84 CAMBODIA LOAD BALANCER SYSTEM CURRENT AND FUTURE TYPE ANALYSIS, 2025–2034, (USD MILLION)
FIGURE 85 CAMBODIA LOAD BALANCER SYSTEM CURRENT AND FUTURE END USER ANALYSIS, 2025–2034, (USD MILLION)
FIGURE 86 FIJI LOAD BALANCER SYSTEM CURRENT AND FUTURE TYPE ANALYSIS, 2025–2034, (USD MILLION)
FIGURE 87 FIJI LOAD BALANCER SYSTEM CURRENT AND FUTURE END USER ANALYSIS, 2025–2034, (USD MILLION)
FIGURE 88 INDONESIA LOAD BALANCER SYSTEM CURRENT AND FUTURE TYPE ANALYSIS, 2025–2034, (USD MILLION)
FIGURE 89 INDONESIA LOAD BALANCER SYSTEM CURRENT AND FUTURE END USER ANALYSIS, 2025–2034, (USD MILLION)
FIGURE 90 SOUTH KOREA LOAD BALANCER SYSTEM CURRENT AND FUTURE TYPE ANALYSIS, 2025–2034, (USD MILLION)
FIGURE 91 SOUTH KOREA LOAD BALANCER SYSTEM CURRENT AND FUTURE END USER ANALYSIS, 2025–2034, (USD MILLION)
FIGURE 92 REST OF EAST ASIA AND PACIFIC LOAD BALANCER SYSTEM CURRENT AND FUTURE TYPE ANALYSIS, 2025–2034, (USD MILLION)
FIGURE 93 REST OF EAST ASIA AND PACIFIC LOAD BALANCER SYSTEM CURRENT AND FUTURE END USER ANALYSIS, 2025–2034, (USD MILLION)
FIGURE 94 SEA AND SOUTH ASIA LOAD BALANCER SYSTEM CURRENT AND FUTURE MARKET VOLUME SHARE REGIONAL ANALYSIS, 2025–2034, (USD MILLION)
FIGURE 95 BANGLADESH LOAD BALANCER SYSTEM CURRENT AND FUTURE TYPE ANALYSIS, 2025–2034, (USD MILLION)
FIGURE 96 BANGLADESH LOAD BALANCER SYSTEM CURRENT AND FUTURE END USER ANALYSIS, 2025–2034, (USD MILLION)
FIGURE 97 NEW ZEALAND LOAD BALANCER SYSTEM CURRENT AND FUTURE TYPE ANALYSIS, 2025–2034, (USD MILLION)
FIGURE 98 NEW ZEALAND LOAD BALANCER SYSTEM CURRENT AND FUTURE END USER ANALYSIS, 2025–2034, (USD MILLION)
FIGURE 99 INDIA LOAD BALANCER SYSTEM CURRENT AND FUTURE TYPE ANALYSIS, 2025–2034, (USD MILLION)
FIGURE 100 INDIA LOAD BALANCER SYSTEM CURRENT AND FUTURE END USER ANALYSIS, 2025–2034, (USD MILLION)
FIGURE 101 SINGAPORE LOAD BALANCER SYSTEM CURRENT AND FUTURE TYPE ANALYSIS, 2025–2034, (USD MILLION)
FIGURE 102 SINGAPORE LOAD BALANCER SYSTEM CURRENT AND FUTURE END USER ANALYSIS, 2025–2034, (USD MILLION)
FIGURE 103 THAILAND LOAD BALANCER SYSTEM CURRENT AND FUTURE TYPE ANALYSIS, 2025–2034, (USD MILLION)
FIGURE 104 THAILAND LOAD BALANCER SYSTEM CURRENT AND FUTURE END USER ANALYSIS, 2025–2034, (USD MILLION)
FIGURE 105 TAIWAN LOAD BALANCER SYSTEM CURRENT AND FUTURE TYPE ANALYSIS, 2025–2034, (USD MILLION)
FIGURE 106 TAIWAN LOAD BALANCER SYSTEM CURRENT AND FUTURE END USER ANALYSIS, 2025–2034, (USD MILLION)
FIGURE 107 MALAYSIA LOAD BALANCER SYSTEM CURRENT AND FUTURE TYPE ANALYSIS, 2025–2034, (USD MILLION)
FIGURE 108 MALAYSIA LOAD BALANCER SYSTEM CURRENT AND FUTURE END USER ANALYSIS, 2025–2034, (USD MILLION)
FIGURE 109 REST OF SEA AND SOUTH ASIA LOAD BALANCER SYSTEM CURRENT AND FUTURE TYPE ANALYSIS, 2025–2034, (USD MILLION)
FIGURE 110 REST OF SEA AND SOUTH ASIA LOAD BALANCER SYSTEM CURRENT AND FUTURE END USER ANALYSIS, 2025–2034, (USD MILLION)
FIGURE 111 MIDDLE EAST AND AFRICA LOAD BALANCER SYSTEM CURRENT AND FUTURE MARKET VOLUME SHARE REGIONAL ANALYSIS, 2025–2034, (USD MILLION)
FIGURE 112 GCC COUNTRIES LOAD BALANCER SYSTEM CURRENT AND FUTURE TYPE ANALYSIS, 2025–2034, (USD MILLION)
FIGURE 113 GCC COUNTRIES LOAD BALANCER SYSTEM CURRENT AND FUTURE END USER ANALYSIS, 2025–2034, (USD MILLION)
FIGURE 114 SAUDI ARABIA LOAD BALANCER SYSTEM CURRENT AND FUTURE TYPE ANALYSIS, 2025–2034, (USD MILLION)
FIGURE 115 SAUDI ARABIA LOAD BALANCER SYSTEM CURRENT AND FUTURE END USER ANALYSIS, 2025–2034, (USD MILLION)
FIGURE 116 UAE LOAD BALANCER SYSTEM CURRENT AND FUTURE TYPE ANALYSIS, 2025–2034, (USD MILLION)
FIGURE 117 UAE LOAD BALANCER SYSTEM CURRENT AND FUTURE END USER ANALYSIS, 2025–2034, (USD MILLION)
FIGURE 118 BAHRAIN LOAD BALANCER SYSTEM CURRENT AND FUTURE TYPE ANALYSIS, 2025–2034, (USD MILLION)
FIGURE 119 BAHRAIN LOAD BALANCER SYSTEM CURRENT AND FUTURE END USER ANALYSIS, 2025–2034, (USD MILLION)
FIGURE 120 KUWAIT LOAD BALANCER SYSTEM CURRENT AND FUTURE TYPE ANALYSIS, 2025–2034, (USD MILLION)
FIGURE 121 KUWAIT LOAD BALANCER SYSTEM CURRENT AND FUTURE END USER ANALYSIS, 2025–2034, (USD MILLION)
FIGURE 122 OMAN LOAD BALANCER SYSTEM CURRENT AND FUTURE TYPE ANALYSIS, 2025–2034, (USD MILLION)
FIGURE 123 OMAN LOAD BALANCER SYSTEM CURRENT AND FUTURE END USER ANALYSIS, 2025–2034, (USD MILLION)
FIGURE 124 QATAR LOAD BALANCER SYSTEM CURRENT AND FUTURE TYPE ANALYSIS, 2025–2034, (USD MILLION)
FIGURE 125 QATAR LOAD BALANCER SYSTEM CURRENT AND FUTURE END USER ANALYSIS, 2025–2034, (USD MILLION)
FIGURE 126 EGYPT LOAD BALANCER SYSTEM CURRENT AND FUTURE TYPE ANALYSIS, 2025–2034, (USD MILLION)
FIGURE 127 EGYPT LOAD BALANCER SYSTEM CURRENT AND FUTURE END USER ANALYSIS, 2025–2034, (USD MILLION)
FIGURE 128 NIGERIA LOAD BALANCER SYSTEM CURRENT AND FUTURE TYPE ANALYSIS, 2025–2034, (USD MILLION)
FIGURE 129 NIGERIA LOAD BALANCER SYSTEM CURRENT AND FUTURE END USER ANALYSIS, 2025–2034, (USD MILLION)
FIGURE 130 SOUTH AFRICA LOAD BALANCER SYSTEM CURRENT AND FUTURE TYPE ANALYSIS, 2025–2034, (USD MILLION)
FIGURE 131 SOUTH AFRICA LOAD BALANCER SYSTEM CURRENT AND FUTURE END USER ANALYSIS, 2025–2034, (USD MILLION)
FIGURE 132 ISRAEL LOAD BALANCER SYSTEM CURRENT AND FUTURE TYPE ANALYSIS, 2025–2034, (USD MILLION)
FIGURE 133 ISRAEL LOAD BALANCER SYSTEM CURRENT AND FUTURE END USER ANALYSIS, 2025–2034, (USD MILLION)
FIGURE 134 REST OF MEA LOAD BALANCER SYSTEM CURRENT AND FUTURE TYPE ANALYSIS, 2025–2034, (USD MILLION)
FIGURE 135 REST OF MEA LOAD BALANCER SYSTEM CURRENT AND FUTURE END USER ANALYSIS, 2025–2034, (USD MILLION)
FIGURE 136 U. S. MARKET SHARE ANALYSIS BY TYPE (2024)
FIGURE 137 U. S. MARKET SHARE ANALYSIS BY END USER (2024)
FIGURE 138 CANADA MARKET SHARE ANALYSIS BY TYPE (2024)
FIGURE 139 CANADA MARKET SHARE ANALYSIS BY END USER (2024)
FIGURE 140 MEXICO MARKET SHARE ANALYSIS BY TYPE (2024)
FIGURE 141 MEXICO MARKET SHARE ANALYSIS BY END USER (2024)
FIGURE 142 CHINA MARKET SHARE ANALYSIS BY TYPE (2024)
FIGURE 143 CHINA MARKET SHARE ANALYSIS BY END USER (2024)
FIGURE 144 JAPAN MARKET SHARE ANALYSIS BY TYPE (2024)
FIGURE 145 JAPAN MARKET SHARE ANALYSIS BY END USER (2024)
FIGURE 146 INDIA MARKET SHARE ANALYSIS BY TYPE (2024)
FIGURE 147 INDIA MARKET SHARE ANALYSIS BY END USER (2024)
FIGURE 148 SOUTH KOREA MARKET SHARE ANALYSIS BY TYPE (2024)
FIGURE 149 SOUTH KOREA MARKET SHARE ANALYSIS BY END USER (2024)
FIGURE 150 SAUDI ARABIA MARKET SHARE ANALYSIS BY TYPE (2024)
FIGURE 151 SAUDI ARABIA MARKET SHARE ANALYSIS BY END USER (2024)
FIGURE 152 UAE MARKET SHARE ANALYSIS BY TYPE (2024)
FIGURE 153 UAE MARKET SHARE ANALYSIS BY END USER (2024)
FIGURE 154 EGYPT MARKET SHARE ANALYSIS BY TYPE (2024)
FIGURE 155 EGYPT MARKET SHARE ANALYSIS BY END USER (2024)
FIGURE 156 NIGERIA MARKET SHARE ANALYSIS BY TYPE (2024)
FIGURE 157 NIGERIA MARKET SHARE ANALYSIS BY END USER (2024)
FIGURE 158 SOUTH AFRICA MARKET SHARE ANALYSIS BY TYPE (2024)
FIGURE 159 SOUTH AFRICA MARKET SHARE ANALYSIS BY END USER (2024)
FIGURE 160 GERMANY MARKET SHARE ANALYSIS BY TYPE (2024)
FIGURE 161 GERMANY MARKET SHARE ANALYSIS BY END USER (2024)
FIGURE 162 FRANCE MARKET SHARE ANALYSIS BY TYPE (2024)
FIGURE 163 FRANCE MARKET SHARE ANALYSIS BY END USER (2024)
FIGURE 164 UK MARKET SHARE ANALYSIS BY TYPE (2024)
FIGURE 165 UK MARKET SHARE ANALYSIS BY END USER (2024)
FIGURE 166 SPAIN MARKET SHARE ANALYSIS BY TYPE (2024)
FIGURE 167 SPAIN MARKET SHARE ANALYSIS BY END USER (2024)
FIGURE 168 ITALY MARKET SHARE ANALYSIS BY TYPE (2024)
FIGURE 169 ITALY MARKET SHARE ANALYSIS BY END USER (2024)
FIGURE 170 BRAZIL MARKET SHARE ANALYSIS BY TYPE (2024)
FIGURE 171 BRAZIL MARKET SHARE ANALYSIS BY END USER (2024)
FIGURE 172 ARGENTINA MARKET SHARE ANALYSIS BY TYPE (2024)
FIGURE 173 ARGENTINA MARKET SHARE ANALYSIS BY END USER (2024)
FIGURE 174 COLUMBIA MARKET SHARE ANALYSIS BY TYPE (2024)
FIGURE 175 COLUMBIA MARKET SHARE ANALYSIS BY END USER (2024)
FIGURE 176 GLOBAL LOAD BALANCER SYSTEM CURRENT AND FUTURE MARKET KEY COUNTRY LEVEL ANALYSIS, 2024–2034, (USD MILLION)
FIGURE 177 FINANCIAL OVERVIEW:
Key Player Analysis
Microsoft Corporation: Leader. Microsoft anchors the enterprise load-balancing stack with Azure Load Balancer (L4), Azure Application Gateway (L7/WAF), and Azure Front Door for global HTTP(S) acceleration and security. Its moat is distribution—70+ Azure regions and 400+ datacenters—plus a large edge footprint (Front Door operates across ~190+ PoPs) that helps enterprises meet latency and resilience SLOs at scale. Tight coupling with Azure DDoS Protection and Defender drives “platform” buying, lifting attach rates for security and observability across multi-cloud and hybrid estates.
Microsoft’s 2025 roadmap emphasizes AI-ready application delivery—policy-driven routing, ML-assisted anomaly detection, and migration from Front Door (classic) to Standard/Premium SKUs—to simplify global traffic engineering and reduce operational toil. The strategy positions Microsoft as the preferred control plane for cloud-first workloads and regulated industries seeking deterministic performance with integrated governance and defense-in-depth.
Citrix Systems, Inc. (NetScaler): Challenger. Now part of Cloud Software Group, Citrix’s NetScaler ADC and Gateway remain entrenched in virtualization-heavy enterprises that value tight integration with Citrix Workspace/DaaS. Since the NetScaler brand relaunch, the company has leaned into a partner-led motion—most notably an eight-year strategic partnership with Microsoft and Arrow as the exclusive distributor across North America and Europe in 2025—broadening reach while focusing R&D on app security and zero-trust access.
Execution focus in 2025 centers on resilience and security currency—rapid patching for high-severity flaws and expanded threat-intel integrations—aimed at protecting a sizable installed base while competing more effectively for hybrid refreshes. Regional alliances (e.g., Midis Group in EEMEA) strengthen field coverage, but competitive pressure from cloud-native gateways requires continued investment in automation, API-first policy, and telemetry depth.
A10 Networks, Inc.: Innovator/Niche leader in carrier-grade delivery and security. A10 targets telco/5G, large enterprises, and public sector with Thunder ADC, DDoS protection, and CGNAT, benefiting from traffic growth and encryption-heavy L7 workloads. In FY2024, revenue reached $261.7 million with strong profitability (non-GAAP net margin ~25%), providing capacity for sustained R&D in adaptive DDoS mitigation and automation that lowers opex for lean NetOps teams.
Strategically, A10 leverages differentiated telemetry and frequent threat-landscape reporting (e.g., tracking millions of DDoS “weapons”) to win modernization bids where availability and security converge. Its focus on compact form factors, high TLS performance, and controller-driven policy orchestration positions A10 as a cost-efficient alternative in 5G cores, MEC, and latency-sensitive government networks.
Google LLC: Leader/Innovator in cloud-native load balancing. Google Cloud Load Balancing provides global anycast software L4/L7 services with PoPs distributed worldwide and 200+ network edge locations, tightly integrated with Google’s backbone. Underpinned by Google’s Maglev architecture—designed to handle millions of requests per second without pre-warming—the platform is attractive for AI/ML and high-fan-out microservices that require elastic, planet-scale delivery.
In 2025, Google’s differentiation is programmability and SRE-grade automation: unified policies across L7 security, traffic steering, and observability; regional and global LB options; and edge ingress aligned to its expanding regional footprint. This stack compresses time-to-value for digital natives and accelerates legacy refactors by abstracting away capacity planning and failure domains.
As of 2025, application traffic is growing faster than infrastructure budgets, propelled by multi-cloud adoption, microservices, and data-intensive digital channels. The global Load Balancer market is tracking toward ~USD 7.0 billion in 2025 and a ~13–14% CAGR through 2033, with peak-event volumes (commerce, media, fintech) pushing enterprises to engineer for 5–10x bursts without sacrificing SLOs. Load balancers now operate as policy-aware control points at L4–L7—terminating SSL/TLS, shaping flows, and steering requests across regions—to preserve latency and uptime as east-west service calls multiply.
The strategic impact is clear: organizations that standardize on programmable, analytics-driven load balancing cut incident minutes and avoid revenue leakage during spikes. With over two-thirds of large enterprises running hybrid or multi-cloud estates, global server load balancing (GSLB) and managed cloud gateways are becoming default, lifting attach rates for observability and security add-ons and consolidating spend with vendors that integrate traffic, security, and telemetry.
Restraint:
High Ownership Costs and Integration Complexity Slowing Adoption
Total cost of ownership remains the gating factor in 2025. Enterprise-grade deployments—often combining appliances, virtual editions, WAF/DDoS bundles, and professional services—can require six-figure capex per site and quarters of integration effort. Skills scarcity in SRE/NetOps and the complexity of hybrid policy management raise operating expense and elongate payback periods, particularly where hardware still accounts for just over half of installed base value.
Strategically, high up-front and integration costs slow refresh cycles and favor incumbents with embedded footprints, even when cloud-native alternatives promise lower unit costs. The result is a measured shift rather than a rapid pivot: many buyers retain on-prem for sovereignty/latency while piloting cloud gateways at the edge—spreading budgets across parallel stacks and dampening short-term margin expansion for challengers.
Opportunity:
AI-Driven Traffic Engineering and Cloud-Managed Gateways Unlocking New Growth
AI, IoT, and SDN are expanding the addressable market, creating premium tiers for intelligent traffic engineering. AI/ML-assisted load balancing—combining predictive autoscaling with anomaly-aware routing—can trim error budgets and infrastructure headroom, unlocking double-digit ROI for high-volume digital businesses. Between 2025 and 2030, cloud-managed L7 services and mesh-integrated gateways are poised to outgrow the market by 200–300 bps, with Asia Pacific (India/SEA) and regulated verticals (BFSI, healthcare) generating multi-billion-dollar incremental demand.
For vendors and investors, the upside concentrates in software and services: API-first platforms, usage-based pricing, and bundled security/observability. Expect managed offerings to capture a majority of new deployments by the late 2020s, while edge/5G rollouts and industrial IoT catalyze localized, low-latency use cases that favor lightweight, programmable data planes.
Cloud-native and security-converged load balancing is the dominant 2025 theme. Provider gateways (AWS, Azure, Google Cloud) and third-party virtual appliances are converging with WAF, bot defense, and DDoS controls, shifting buying centers toward platform suites. At the same time, service-mesh and eBPF-enabled data planes, smartNIC/DPUs for SSL offload, and decentralized approaches (e.g., mesh-embedded routing) are compressing appliance footprints and moving policy closer to the workload.
This convergence changes competition and valuation logic: differentiation now hinges on telemetry depth, automation, and ecosystem integrations rather than raw throughput. Vendors that tie traffic steering to real-time business signals—checkout errors, session abandonment, fraud scores—are winning enterprise RFPs, raising subscription mix, and increasing net revenue retention as customers standardize on fewer, programmable control points across multi-cloud topologies.
Recent Developments
Dec 2024 – F5, Inc.: F5 introduced an AI assistant for its Distributed Cloud Services and reported adoption by “more than half” of its Distributed Cloud Services customers within weeks of launch. The move strengthens F5’s value proposition around autonomous operations and AI-driven troubleshooting across multi-cloud load-balancing estates.
Feb 2025 – A10 Networks: A10 acquired ThreatX Protect (deal value undisclosed) to fold runtime API and bot mitigation into its web application & API protection (WAAP) and application delivery stack. The acquisition broadens A10’s security-led differentiation in high-performance load balancing for telecom and enterprise gateways.
Feb 2025 – Amazon Web Services (AWS): AWS added the ability to disable Availability Zones on existing Network Load Balancers—improving operational control for fault isolation and cost/performance tuning in regulated or latency-sensitive environments. The capability enhances production change management, particularly for zonal maintenance and incident response.
Mar 2025 – Google Cloud: Google introduced custom metrics–based traffic steering (Preview) for Application Load Balancers, enabling routing decisions on business or SRE signals beyond default utilization/rate metrics. This elevates L7 policy precision for e-commerce, media, and AI inference workloads seeking SLO-aware request placement.
Jul 2025 – Microsoft (Azure Front Door): Microsoft confirmed policy changes for Azure Front Door (classic) effective Aug 15, 2025—no new domain onboarding and no support for managed certificates (with migration guidance to Standard/Premium; AFD classic retirement set for Mar 31, 2027). The transition nudges customers toward newer SKUs with integrated WAF and private connectivity, impacting multi-region global load-balancing roadmaps.
Sep 2025 – Google Cloud: Google tightened protocol compliance in Cloud Load Balancing by enforcing RFC 9112 handling for Transfer-Encoding: chunked and adding explicit HTTP/1.0 ALPN support earlier in the month. The updates reduce interoperability edge cases and harden security posture for legacy client mixes at internet scale.