Global Low-Latency Content Sharing Market Size, Share & Analysis By Content-Type (Audio Content Sharing, Video Content Sharing, Data Content Sharing), By Deployment Mode (Cloud-Based, On-Premise), By Industry Vertical (Media and Entertainment, Healthcare, Education, Gaming, Financial Services, Telecommunications, Automotive), Industry Outlook & Forecast 2025–2034
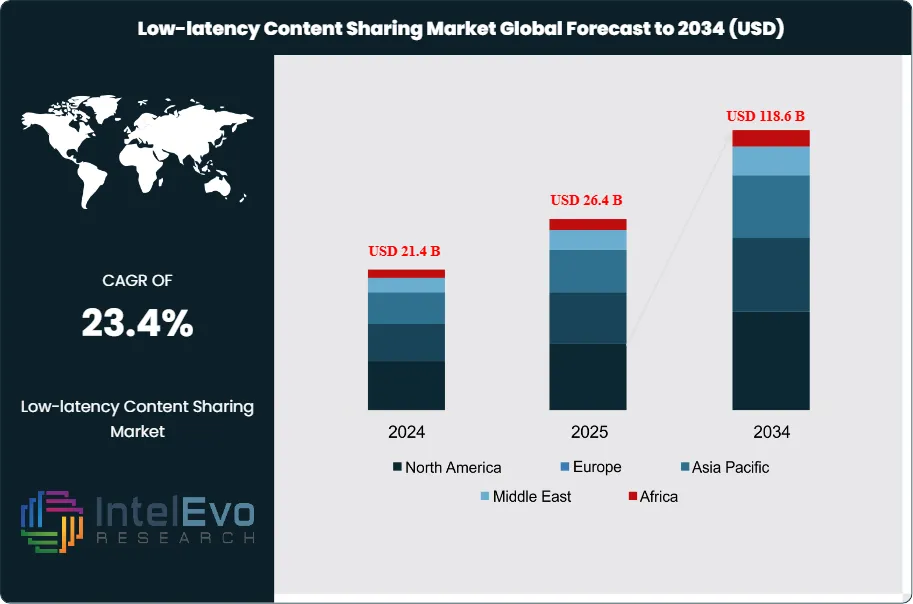
The Low-Latency Content Sharing Market is expected to be worth USD 21.4 billion in 2024. It should grow to about USD 118.6 billion by 2034, showing a strong annual growth rate of around 23.4% from 2025 to 2034. The market is benefiting from the growing use of real-time communication tools, edge-enabled content delivery, and high-performance interactive applications in both consumer and business settings. As global users seek seamless and fast content experiences, demand is rising in video collaboration, live streaming, gaming, and immersive media.
The rapid shift to real-time digital communication is changing the low-latency content sharing landscape. Both businesses and consumers want instant access to video, audio, and interactive media. This demand is driving platforms to implement systems that can deliver performance with sub-second round-trip times. Cloud-based collaboration tools, high-quality video conferencing, and virtual event platforms have become critical for corporate productivity and unified communication.
In 2024, live-streaming platforms continued to grow, making up over 30% of global revenue. This growth is supported by creator monetization, interactive chat features, and events that can handle a high number of users. The increase in the market is closely linked to rising user expectations for seamless, high-quality content experiences.
Online gaming is a key driver of low-latency demand, with over 3.4 billion users worldwide needing ultra-low latency, often below 50 milliseconds, for competitive and immersive gameplay. Real-time interaction in esports, cloud gaming, and social gaming is changing data routing strategies and infrastructure purchases across major markets.
Hyperscalers and telecom companies are increasing the number of edge computing nodes to support fast delivery pipelines. These setups ensure that content-processing occurs closer to users, which helps to reduce issues like jitter, packet loss, and delays. Consequently, edge integration is becoming essential in modern content delivery networks.
North America leads in infrastructure readiness, with over 65% of mobile traffic routed through low-latency networks as of 2024. Early adoption of 5G, strong fiber networks, and significant spending by businesses strengthen the region’s competitive position.
Meanwhile, Asia Pacific is turning into the fastest-growing region. Growing 5G access in India, South Korea, Japan, and Southeast Asia, along with increasing digital media consumption, is creating a high demand for low-latency content delivery solutions. This regional growth is attracting investments in telecom upgrades, local data centers, and real-time processing options.
Market growth is limited by rising bandwidth costs, which went up about 9% year-on-year due to supply chain issues and delays in Western Europe’s data center operations. Additionally, regulatory challenges around cross-border data transfer, content moderation, and platform compliance complicate multinational operations.
These challenges are especially tough for providers in the Middle East and Africa, where inconsistent infrastructure and uneven policies slow the rollout of modern low-latency services. Providers must tackle these issues while ensuring service reliability and meeting strict delivery standards.
New developments in AI-based compression, adaptive bitrate optimization, and machine learning routing have become key to reducing latency. By 2024, over 40% of global content platforms had adopted AI-enabled traffic routing for ongoing performance adjustments and automatic content prioritization. Improvements in optical fiber capacity and software-defined networking are changing cost-performance dynamics, allowing operators to deliver more throughput with lower operational costs.
Enhanced automation in content workflows enables real-time load balancing and congestion management, ensuring that high-resolution formats like 4K and 8K video streams are transmitted smoothly even during peak traffic.
Investor confidence in the market is robust, with more than USD 12 billion in private equity and venture capital recorded in 2023. Funding is directed toward platforms and infrastructure providers that support real-time interaction, immersive media formats, and large-scale collaboration.
As content ecosystems progress toward mixed-reality environments, AI-driven engagement, and seamless multi-device functionality, industry players face a clear challenge: shorten end-to-end delivery time while meeting increasing demands for concurrency and resolution. These changes will help ensure that the low-latency content sharing market continues to grow strongly through 2034.
Key Takeaways
Market Growth: The global low-latency content sharing market reached USD 21.4 billion in 2024 and is forecast to hit USD 118.6 billion by 2034, growing at a CAGR of 23.4%. Growth is driven by rising demand for real-time digital interaction in sectors like gaming, telemedicine, and enterprise collaboration.
Application: Live video streaming led the market with over 28% revenue share in 2023, driven by consumer preference for uninterrupted, high-resolution content and monetization models adopted by platforms like Twitch and YouTube Live.
End Use: The gaming industry remains a core adopter, supported by a global user base exceeding 3.2 billion and infrastructure demands for sub-50 millisecond latency in competitive and cloud-based gameplay environments.
Driver: Increased deployment of 5G and edge computing infrastructure is accelerating content delivery performance. In 2023, over 65% of North American mobile traffic was routed through low-latency networks, improving user experience for high-bandwidth applications.
Restraint: Rising infrastructure costs pose a challenge. Bandwidth pricing climbed 9% year-on-year due to supply chain constraints and delayed data center projects, particularly in Western Europe and parts of Latin America.
Opportunity: Asia Pacific presents strong potential, with India, South Korea, and Indonesia recording high adoption growth. The region is projected to register a CAGR above 24% through 2032, supported by rapid 5G rollout and increasing demand for mobile content sharing.
Trend: AI-based traffic management is gaining traction. Over 40% of major platforms integrated machine learning algorithms for predictive routing and bitrate adjustment in 2024, reducing latency while supporting concurrency at scale.
Regional Analysis: North America leads the market in infrastructure readiness and revenue share. Asia Pacific is closing the gap, fueled by investments in telecom upgrades and rising mobile internet penetration. Europe shows steady adoption but lags in latency optimization due to regulatory hurdles.
Content Type Analysis
Video content sharing remains the dominant content type in the global low-latency content sharing market, accounting for approximately 62.7% of total revenue in 2025. Its growth is fueled by widespread adoption across sectors requiring real-time communication and high-resolution media. Applications such as telemedicine, virtual education, and remote corporate training rely heavily on uninterrupted video delivery, creating consistent demand for high-performance streaming capabilities. The rise of hybrid work models and growing penetration of video conferencing platforms continue to push video content into the mainstream.
This segment also benefits from the increasing use of immersive technologies. Live sports streaming, interactive entertainment, and AR/VR experiences have strict latency requirements, making video content sharing a core driver of infrastructure development. Content providers are prioritizing speed and clarity, particularly in markets where consumer retention is tied to performance. As a result, investment in adaptive bitrate streaming and AI-enhanced delivery systems is concentrated in this segment.
Deployment Mode Analysis
Cloud-based deployment leads the market by a significant margin, capturing 76.4% of global revenue share in 2025. Organizations across industries are migrating to cloud platforms to enable faster deployment, lower infrastructure overhead, and scalable content delivery. The shift is especially pronounced among streaming platforms, enterprise collaboration tools, and education tech firms, which require rapid scaling based on fluctuating user loads. Cloud models also allow integration with edge computing and AI-based routing to maintain low-latency performance at global scale.
While the cloud model dominates, the on-premise segment is showing steady growth in industries with stricter data privacy and latency control requirements. Financial institutions, defense, and some healthcare providers continue to deploy on-premise systems to meet regulatory standards. This segment is projected to grow at a modest CAGR through 2032, supported by advances in hybrid architectures.
Industry Vertical Analysis
The media and entertainment industry continues to hold the largest share of the market in 2025, driven by growing demand for high-speed content delivery across live broadcasting, over-the-top (OTT) platforms, and esports. The segment leads adoption of low-latency infrastructure to support concurrent users, interactive features, and high-definition streaming. In 2024, major streaming providers increased infrastructure investments by over 15% to reduce latency and enhance viewer experience.
Gaming and education are fast-rising verticals. Cloud gaming platforms rely on sub-50 millisecond latency to maintain competitive playability, while online learning tools are being restructured to support synchronous video and interactive content. Financial services and healthcare are also expanding their use of low-latency systems, particularly for high-frequency trading and real-time diagnostics.
Regional Analysis
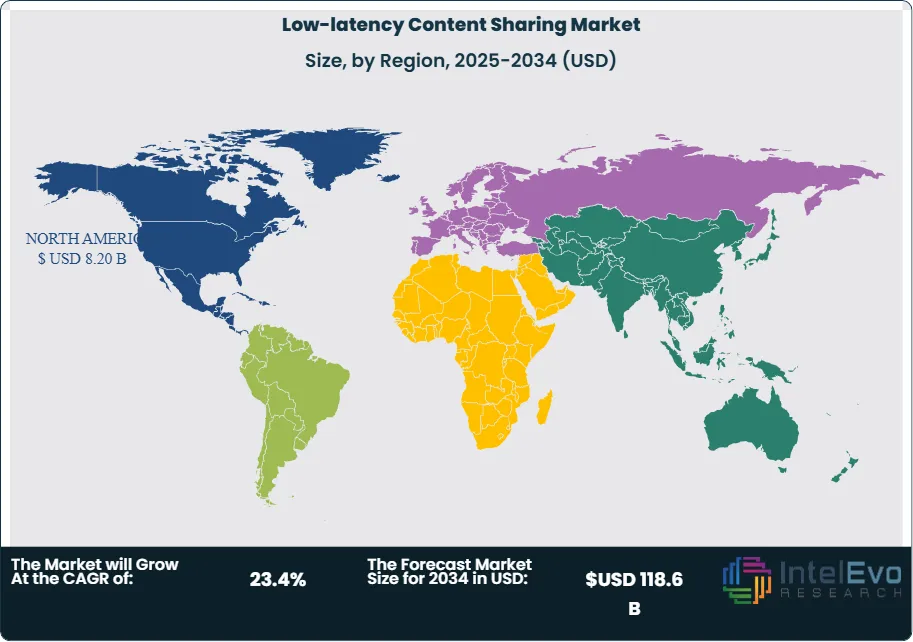
North America remains the leading region, holding a 38.3% revenue share in the global low-latency content sharing market. Its dominance is anchored by mature digital infrastructure, wide 5G coverage, and early adoption of edge computing. Key sectors such as finance, entertainment, and healthcare rely on near-instantaneous content transmission, with firms in the U.S. and Canada allocating higher budgets to low-latency technologies than any other region.
Asia Pacific is the fastest-growing region, supported by expanding digital ecosystems in India, China, and Southeast Asia. The region is expected to register a CAGR above 23% through 2032. Demand for real-time mobile content, rapid urban internet penetration, and growing investment in telecom infrastructure are driving uptake. Meanwhile, Europe shows stable growth, though deployment delays and regulatory barriers have slowed adoption in some countries. The Middle East and Africa remain under-penetrated but are beginning to see targeted investments in latency-sensitive sectors like telehealth and education.
By Content-Type (Audio Content Sharing, Video Content Sharing, Data Content Sharing), By Deployment Mode (Cloud-Based, On-Premise), By Industry Vertical (Media and Entertainment, Healthcare, Education, Gaming, Financial Services, Telecommunications, Automotive, Other Industry Verticals)
Research Methodology
Primary Research- 100 Interviews of Stakeholders
Secondary Research
Desk Research
Regional scope
North America (United States, Canada, Mexico)
Latin America (Brazil, Argentina, Columbia)
East Asia And Pacific (China, Japan, South Korea, Australia, Cambodia, Fiji, Indonesia)
Sea And South Asia (India, Singapore, Thailand, Taiwan, Malaysia)
Eastern Europe (Poland, Russia, Czech Republic, Romania)
Western Europe (Germany, U.K., France, Spain, Itlay)
Middle East & Africa (GCC Countries, Egypt, Nigeria, South Africa, Israel)
Competitive Landscape
Cloudflare, Inc., Cisco Systems, Inc., Amazon Web Services, Inc., Verizon Communications Inc., Google LLC, Fastly, Akamai Technologies, Inc., Huawei Technologies Co., Ltd., Ericsson, Microsoft Corporation, Other Key Players
Customization Scope
Customization for segments, region/country-level will be provided. Moreover, additional customization can be done based on the requirements.
Pricing and Purchase Options
Avail customized purchase options to meet your exact research needs. We have three licenses to opt for: Single User License, Multi-User License (Up to 5 Users), Corporate Use License (Unlimited User and Printable PDF).
TABLE OF CONTENTS
1. EXECUTIVE SUMMARY
1.1. MARKET SNAPSHOT
1.2. KEY FINDINGS & INSIGHTS
1.3. ANALYST RECOMMENDATIONS
1.4. FUTURE OUTLOOK
2. RESEARCH METHODOLOGY
2.1. MARKET DEFINITION & SCOPE
2.2. RESEARCH OBJECTIVES: PRIMARY & SECONDARY DATA SOURCES
2.3. DATA COLLECTION SOURCES
2.3.1. COVERAGE OF 100+ PRIMARY RESEARCH/CONSULTATION CALLS WITH INDUSTRY STAKEHOLDERS
FIGURE 17 NORTH AMERICA LOW-LATENCY CONTENT SHARING CURRENT AND FUTURE TYPE ANALYSIS, 2025–2034, (USD MILLION)
FIGURE 18 NORTH AMERICA LOW-LATENCY CONTENT SHARING CURRENT AND FUTURE END USER ANALYSIS, 2025–2034, (USD MILLION)
FIGURE 19 MARKET SHARE BY COUNTRY
FIGURE 20 LATIN AMERICA LOW-LATENCY CONTENT SHARING CURRENT AND FUTURE TYPE ANALYSIS, 2025–2034, (USD MILLION)
FIGURE 21 LATIN AMERICA LOW-LATENCY CONTENT SHARING CURRENT AND FUTURE END USER ANALYSIS, 2025–2034, (USD MILLION)
FIGURE 22 MARKET SHARE BY COUNTRY
FIGURE 23 EASTERN EUROPE LOW-LATENCY CONTENT SHARING CURRENT AND FUTURE TYPE ANALYSIS, 2025–2034, (USD MILLION)
FIGURE 24 EASTERN EUROPE LOW-LATENCY CONTENT SHARING CURRENT AND FUTURE END USER ANALYSIS, 2025–2034, (USD MILLION)
FIGURE 25 MARKET SHARE BY COUNTRY
FIGURE 26 WESTERN EUROPE LOW-LATENCY CONTENT SHARING CURRENT AND FUTURE TYPE ANALYSIS, 2025–2034, (USD MILLION)
FIGURE 27 WESTERN EUROPE LOW-LATENCY CONTENT SHARING CURRENT AND FUTURE END USER ANALYSIS, 2025–2034, (USD MILLION)
FIGURE 28 MARKET SHARE BY COUNTRY
FIGURE 29 EAST ASIA AND PACIFIC LOW-LATENCY CONTENT SHARING CURRENT AND FUTURE TYPE ANALYSIS, 2025–2034, (USD MILLION)
FIGURE 30 EAST ASIA AND PACIFIC LOW-LATENCY CONTENT SHARING CURRENT AND FUTURE END USER ANALYSIS, 2025–2034, (USD MILLION)
FIGURE 31 MARKET SHARE BY COUNTRY
FIGURE 32 SEA AND SOUTH ASIA LOW-LATENCY CONTENT SHARING CURRENT AND FUTURE TYPE ANALYSIS, 2025–2034, (USD MILLION)
FIGURE 33 SEA AND SOUTH ASIA LOW-LATENCY CONTENT SHARING CURRENT AND FUTURE END USER ANALYSIS, 2025–2034, (USD MILLION)
FIGURE 34 MARKET SHARE BY COUNTRY
FIGURE 35 MIDDLE EAST AND AFRICA LOW-LATENCY CONTENT SHARING CURRENT AND FUTURE TYPE ANALYSIS, 2025–2034, (USD MILLION)
FIGURE 36 MIDDLE EAST AND AFRICA LOW-LATENCY CONTENT SHARING CURRENT AND FUTURE END USER ANALYSIS, 2025–2034, (USD MILLION)
FIGURE 37 NORTH AMERICA LOW-LATENCY CONTENT SHARING CURRENT AND FUTURE MARKET VOLUME SHARE REGIONAL ANALYSIS, 2025–2034, (USD MILLION)
FIGURE 38 U.S. LOW-LATENCY CONTENT SHARING CURRENT AND FUTURE TYPE ANALYSIS, 2025–2034, (USD MILLION)
FIGURE 39 U.S. LOW-LATENCY CONTENT SHARING CURRENT AND FUTURE END USER ANALYSIS, 2025–2034, (USD MILLION)
FIGURE 40 CANADA LOW-LATENCY CONTENT SHARING CURRENT AND FUTURE TYPE ANALYSIS, 2025–2034, (USD MILLION)
FIGURE 41 CANADA LOW-LATENCY CONTENT SHARING CURRENT AND FUTURE END USER ANALYSIS, 2025–2034, (USD MILLION)
FIGURE 42 LATIN AMERICA LOW-LATENCY CONTENT SHARING CURRENT AND FUTURE MARKET VOLUME SHARE REGIONAL ANALYSIS, 2025–2034, (USD MILLION)
FIGURE 43 MEXICO LOW-LATENCY CONTENT SHARING CURRENT AND FUTURE TYPE ANALYSIS, 2025–2034, (USD MILLION)
FIGURE 44 MEXICO LOW-LATENCY CONTENT SHARING CURRENT AND FUTURE END USER ANALYSIS, 2025–2034, (USD MILLION)
FIGURE 45 BRAZIL LOW-LATENCY CONTENT SHARING CURRENT AND FUTURE TYPE ANALYSIS, 2025–2034, (USD MILLION)
FIGURE 46 BRAZIL LOW-LATENCY CONTENT SHARING CURRENT AND FUTURE END USER ANALYSIS, 2025–2034, (USD MILLION)
FIGURE 47 ARGENTINA LOW-LATENCY CONTENT SHARING CURRENT AND FUTURE TYPE ANALYSIS, 2025–2034, (USD MILLION)
FIGURE 48 ARGENTINA LOW-LATENCY CONTENT SHARING CURRENT AND FUTURE END USER ANALYSIS, 2025–2034, (USD MILLION)
FIGURE 49 COLUMBIA LOW-LATENCY CONTENT SHARING CURRENT AND FUTURE TYPE ANALYSIS, 2025–2034, (USD MILLION)
FIGURE 50 COLUMBIA LOW-LATENCY CONTENT SHARING CURRENT AND FUTURE END USER ANALYSIS, 2025–2034, (USD MILLION)
FIGURE 51 REST OF LATIN AMERICA LOW-LATENCY CONTENT SHARING CURRENT AND FUTURE TYPE ANALYSIS, 2025–2034, (USD MILLION)
FIGURE 52 REST OF LATIN AMERICA LOW-LATENCY CONTENT SHARING CURRENT AND FUTURE END USER ANALYSIS, 2025–2034, (USD MILLION)
FIGURE 53 EASTERN EUROPE LOW-LATENCY CONTENT SHARING CURRENT AND FUTURE MARKET VOLUME SHARE REGIONAL ANALYSIS, 2025–2034, (USD MILLION)
FIGURE 54 POLAND LOW-LATENCY CONTENT SHARING CURRENT AND FUTURE TYPE ANALYSIS, 2025–2034, (USD MILLION)
FIGURE 55 POLAND LOW-LATENCY CONTENT SHARING CURRENT AND FUTURE END USER ANALYSIS, 2025–2034, (USD MILLION)
FIGURE 56 RUSSIA LOW-LATENCY CONTENT SHARING CURRENT AND FUTURE TYPE ANALYSIS, 2025–2034, (USD MILLION)
FIGURE 57 RUSSIA LOW-LATENCY CONTENT SHARING CURRENT AND FUTURE END USER ANALYSIS, 2025–2034, (USD MILLION)
FIGURE 58 CZECH REPUBLIC LOW-LATENCY CONTENT SHARING CURRENT AND FUTURE TYPE ANALYSIS, 2025–2034, (USD MILLION)
FIGURE 59 CZECH REPUBLIC LOW-LATENCY CONTENT SHARING CURRENT AND FUTURE END USER ANALYSIS, 2025–2034, (USD MILLION)
FIGURE 60 ROMANIA LOW-LATENCY CONTENT SHARING CURRENT AND FUTURE TYPE ANALYSIS, 2025–2034, (USD MILLION)
FIGURE 61 ROMANIA LOW-LATENCY CONTENT SHARING CURRENT AND FUTURE END USER ANALYSIS, 2025–2034, (USD MILLION)
FIGURE 62 REST OF EASTERN EUROPE LOW-LATENCY CONTENT SHARING CURRENT AND FUTURE TYPE ANALYSIS, 2025–2034, (USD MILLION)
FIGURE 63 REST OF EASTERN EUROPE LOW-LATENCY CONTENT SHARING CURRENT AND FUTURE END USER ANALYSIS, 2025–2034, (USD MILLION)
FIGURE 64 WESTERN EUROPE LOW-LATENCY CONTENT SHARING CURRENT AND FUTURE MARKET VOLUME SHARE REGIONAL ANALYSIS, 2025–2034, (USD MILLION)
FIGURE 65 GERMANY LOW-LATENCY CONTENT SHARING CURRENT AND FUTURE TYPE ANALYSIS, 2025–2034, (USD MILLION)
FIGURE 66 GERMANY LOW-LATENCY CONTENT SHARING CURRENT AND FUTURE END USER ANALYSIS, 2025–2034, (USD MILLION)
FIGURE 67 FRANCE LOW-LATENCY CONTENT SHARING CURRENT AND FUTURE TYPE ANALYSIS, 2025–2034, (USD MILLION)
FIGURE 68 FRANCE LOW-LATENCY CONTENT SHARING CURRENT AND FUTURE END USER ANALYSIS, 2025–2034, (USD MILLION)
FIGURE 69 UK LOW-LATENCY CONTENT SHARING CURRENT AND FUTURE TYPE ANALYSIS, 2025–2034, (USD MILLION)
FIGURE 70 UK LOW-LATENCY CONTENT SHARING CURRENT AND FUTURE END USER ANALYSIS, 2025–2034, (USD MILLION)
FIGURE 71 SPAIN LOW-LATENCY CONTENT SHARING CURRENT AND FUTURE TYPE ANALYSIS, 2025–2034, (USD MILLION)
FIGURE 72 SPAIN LOW-LATENCY CONTENT SHARING CURRENT AND FUTURE END USER ANALYSIS, 2025–2034, (USD MILLION)
FIGURE 73 ITALY LOW-LATENCY CONTENT SHARING CURRENT AND FUTURE TYPE ANALYSIS, 2025–2034, (USD MILLION)
FIGURE 74 ITALY LOW-LATENCY CONTENT SHARING CURRENT AND FUTURE END USER ANALYSIS, 2025–2034, (USD MILLION)
FIGURE 75 REST OF WESTERN EUROPE LOW-LATENCY CONTENT SHARING CURRENT AND FUTURE TYPE ANALYSIS, 2025–2034, (USD MILLION)
FIGURE 76 REST OF WESTERN EUROPE LOW-LATENCY CONTENT SHARING CURRENT AND FUTURE END USER ANALYSIS, 2025–2034, (USD MILLION)
FIGURE 77 EAST ASIA AND PACIFIC LOW-LATENCY CONTENT SHARING CURRENT AND FUTURE MARKET VOLUME SHARE REGIONAL ANALYSIS, 2025–2034, (USD MILLION)
FIGURE 78 CHINA LOW-LATENCY CONTENT SHARING CURRENT AND FUTURE TYPE ANALYSIS, 2025–2034, (USD MILLION)
FIGURE 79 CHINA LOW-LATENCY CONTENT SHARING CURRENT AND FUTURE END USER ANALYSIS, 2025–2034, (USD MILLION)
FIGURE 80 JAPAN LOW-LATENCY CONTENT SHARING CURRENT AND FUTURE TYPE ANALYSIS, 2025–2034, (USD MILLION)
FIGURE 81 JAPAN LOW-LATENCY CONTENT SHARING CURRENT AND FUTURE END USER ANALYSIS, 2025–2034, (USD MILLION)
FIGURE 82 AUSTRALIA LOW-LATENCY CONTENT SHARING CURRENT AND FUTURE TYPE ANALYSIS, 2025–2034, (USD MILLION)
FIGURE 83 AUSTRALIA LOW-LATENCY CONTENT SHARING CURRENT AND FUTURE END USER ANALYSIS, 2025–2034, (USD MILLION)
FIGURE 84 CAMBODIA LOW-LATENCY CONTENT SHARING CURRENT AND FUTURE TYPE ANALYSIS, 2025–2034, (USD MILLION)
FIGURE 85 CAMBODIA LOW-LATENCY CONTENT SHARING CURRENT AND FUTURE END USER ANALYSIS, 2025–2034, (USD MILLION)
FIGURE 86 FIJI LOW-LATENCY CONTENT SHARING CURRENT AND FUTURE TYPE ANALYSIS, 2025–2034, (USD MILLION)
FIGURE 87 FIJI LOW-LATENCY CONTENT SHARING CURRENT AND FUTURE END USER ANALYSIS, 2025–2034, (USD MILLION)
FIGURE 88 INDONESIA LOW-LATENCY CONTENT SHARING CURRENT AND FUTURE TYPE ANALYSIS, 2025–2034, (USD MILLION)
FIGURE 89 INDONESIA LOW-LATENCY CONTENT SHARING CURRENT AND FUTURE END USER ANALYSIS, 2025–2034, (USD MILLION)
FIGURE 90 SOUTH KOREA LOW-LATENCY CONTENT SHARING CURRENT AND FUTURE TYPE ANALYSIS, 2025–2034, (USD MILLION)
FIGURE 91 SOUTH KOREA LOW-LATENCY CONTENT SHARING CURRENT AND FUTURE END USER ANALYSIS, 2025–2034, (USD MILLION)
FIGURE 92 REST OF EAST ASIA AND PACIFIC LOW-LATENCY CONTENT SHARING CURRENT AND FUTURE TYPE ANALYSIS, 2025–2034, (USD MILLION)
FIGURE 93 REST OF EAST ASIA AND PACIFIC LOW-LATENCY CONTENT SHARING CURRENT AND FUTURE END USER ANALYSIS, 2025–2034, (USD MILLION)
FIGURE 94 SEA AND SOUTH ASIA LOW-LATENCY CONTENT SHARING CURRENT AND FUTURE MARKET VOLUME SHARE REGIONAL ANALYSIS, 2025–2034, (USD MILLION)
FIGURE 95 BANGLADESH LOW-LATENCY CONTENT SHARING CURRENT AND FUTURE TYPE ANALYSIS, 2025–2034, (USD MILLION)
FIGURE 96 BANGLADESH LOW-LATENCY CONTENT SHARING CURRENT AND FUTURE END USER ANALYSIS, 2025–2034, (USD MILLION)
FIGURE 97 NEW ZEALAND LOW-LATENCY CONTENT SHARING CURRENT AND FUTURE TYPE ANALYSIS, 2025–2034, (USD MILLION)
FIGURE 98 NEW ZEALAND LOW-LATENCY CONTENT SHARING CURRENT AND FUTURE END USER ANALYSIS, 2025–2034, (USD MILLION)
FIGURE 99 INDIA LOW-LATENCY CONTENT SHARING CURRENT AND FUTURE TYPE ANALYSIS, 2025–2034, (USD MILLION)
FIGURE 100 INDIA LOW-LATENCY CONTENT SHARING CURRENT AND FUTURE END USER ANALYSIS, 2025–2034, (USD MILLION)
FIGURE 101 SINGAPORE LOW-LATENCY CONTENT SHARING CURRENT AND FUTURE TYPE ANALYSIS, 2025–2034, (USD MILLION)
FIGURE 102 SINGAPORE LOW-LATENCY CONTENT SHARING CURRENT AND FUTURE END USER ANALYSIS, 2025–2034, (USD MILLION)
FIGURE 103 THAILAND LOW-LATENCY CONTENT SHARING CURRENT AND FUTURE TYPE ANALYSIS, 2025–2034, (USD MILLION)
FIGURE 104 THAILAND LOW-LATENCY CONTENT SHARING CURRENT AND FUTURE END USER ANALYSIS, 2025–2034, (USD MILLION)
FIGURE 105 TAIWAN LOW-LATENCY CONTENT SHARING CURRENT AND FUTURE TYPE ANALYSIS, 2025–2034, (USD MILLION)
FIGURE 106 TAIWAN LOW-LATENCY CONTENT SHARING CURRENT AND FUTURE END USER ANALYSIS, 2025–2034, (USD MILLION)
FIGURE 107 MALAYSIA LOW-LATENCY CONTENT SHARING CURRENT AND FUTURE TYPE ANALYSIS, 2025–2034, (USD MILLION)
FIGURE 108 MALAYSIA LOW-LATENCY CONTENT SHARING CURRENT AND FUTURE END USER ANALYSIS, 2025–2034, (USD MILLION)
FIGURE 109 REST OF SEA AND SOUTH ASIA LOW-LATENCY CONTENT SHARING CURRENT AND FUTURE TYPE ANALYSIS, 2025–2034, (USD MILLION)
FIGURE 110 REST OF SEA AND SOUTH ASIA LOW-LATENCY CONTENT SHARING CURRENT AND FUTURE END USER ANALYSIS, 2025–2034, (USD MILLION)
FIGURE 111 MIDDLE EAST AND AFRICA LOW-LATENCY CONTENT SHARING CURRENT AND FUTURE MARKET VOLUME SHARE REGIONAL ANALYSIS, 2025–2034, (USD MILLION)
FIGURE 112 GCC COUNTRIES LOW-LATENCY CONTENT SHARING CURRENT AND FUTURE TYPE ANALYSIS, 2025–2034, (USD MILLION)
FIGURE 113 GCC COUNTRIES LOW-LATENCY CONTENT SHARING CURRENT AND FUTURE END USER ANALYSIS, 2025–2034, (USD MILLION)
FIGURE 114 SAUDI ARABIA LOW-LATENCY CONTENT SHARING CURRENT AND FUTURE TYPE ANALYSIS, 2025–2034, (USD MILLION)
FIGURE 115 SAUDI ARABIA LOW-LATENCY CONTENT SHARING CURRENT AND FUTURE END USER ANALYSIS, 2025–2034, (USD MILLION)
FIGURE 116 UAE LOW-LATENCY CONTENT SHARING CURRENT AND FUTURE TYPE ANALYSIS, 2025–2034, (USD MILLION)
FIGURE 117 UAE LOW-LATENCY CONTENT SHARING CURRENT AND FUTURE END USER ANALYSIS, 2025–2034, (USD MILLION)
FIGURE 118 BAHRAIN LOW-LATENCY CONTENT SHARING CURRENT AND FUTURE TYPE ANALYSIS, 2025–2034, (USD MILLION)
FIGURE 119 BAHRAIN LOW-LATENCY CONTENT SHARING CURRENT AND FUTURE END USER ANALYSIS, 2025–2034, (USD MILLION)
FIGURE 120 KUWAIT LOW-LATENCY CONTENT SHARING CURRENT AND FUTURE TYPE ANALYSIS, 2025–2034, (USD MILLION)
FIGURE 121 KUWAIT LOW-LATENCY CONTENT SHARING CURRENT AND FUTURE END USER ANALYSIS, 2025–2034, (USD MILLION)
FIGURE 122 OMAN LOW-LATENCY CONTENT SHARING CURRENT AND FUTURE TYPE ANALYSIS, 2025–2034, (USD MILLION)
FIGURE 123 OMAN LOW-LATENCY CONTENT SHARING CURRENT AND FUTURE END USER ANALYSIS, 2025–2034, (USD MILLION)
FIGURE 124 QATAR LOW-LATENCY CONTENT SHARING CURRENT AND FUTURE TYPE ANALYSIS, 2025–2034, (USD MILLION)
FIGURE 125 QATAR LOW-LATENCY CONTENT SHARING CURRENT AND FUTURE END USER ANALYSIS, 2025–2034, (USD MILLION)
FIGURE 126 EGYPT LOW-LATENCY CONTENT SHARING CURRENT AND FUTURE TYPE ANALYSIS, 2025–2034, (USD MILLION)
FIGURE 127 EGYPT LOW-LATENCY CONTENT SHARING CURRENT AND FUTURE END USER ANALYSIS, 2025–2034, (USD MILLION)
FIGURE 128 NIGERIA LOW-LATENCY CONTENT SHARING CURRENT AND FUTURE TYPE ANALYSIS, 2025–2034, (USD MILLION)
FIGURE 129 NIGERIA LOW-LATENCY CONTENT SHARING CURRENT AND FUTURE END USER ANALYSIS, 2025–2034, (USD MILLION)
FIGURE 130 SOUTH AFRICA LOW-LATENCY CONTENT SHARING CURRENT AND FUTURE TYPE ANALYSIS, 2025–2034, (USD MILLION)
FIGURE 131 SOUTH AFRICA LOW-LATENCY CONTENT SHARING CURRENT AND FUTURE END USER ANALYSIS, 2025–2034, (USD MILLION)
FIGURE 132 ISRAEL LOW-LATENCY CONTENT SHARING CURRENT AND FUTURE TYPE ANALYSIS, 2025–2034, (USD MILLION)
FIGURE 133 ISRAEL LOW-LATENCY CONTENT SHARING CURRENT AND FUTURE END USER ANALYSIS, 2025–2034, (USD MILLION)
FIGURE 134 REST OF MEA LOW-LATENCY CONTENT SHARING CURRENT AND FUTURE TYPE ANALYSIS, 2025–2034, (USD MILLION)
FIGURE 135 REST OF MEA LOW-LATENCY CONTENT SHARING CURRENT AND FUTURE END USER ANALYSIS, 2025–2034, (USD MILLION)
FIGURE 136 U. S. MARKET SHARE ANALYSIS BY TYPE (2024)
FIGURE 137 U. S. MARKET SHARE ANALYSIS BY END USER (2024)
FIGURE 138 CANADA MARKET SHARE ANALYSIS BY TYPE (2024)
FIGURE 139 CANADA MARKET SHARE ANALYSIS BY END USER (2024)
FIGURE 140 MEXICO MARKET SHARE ANALYSIS BY TYPE (2024)
FIGURE 141 MEXICO MARKET SHARE ANALYSIS BY END USER (2024)
FIGURE 142 CHINA MARKET SHARE ANALYSIS BY TYPE (2024)
FIGURE 143 CHINA MARKET SHARE ANALYSIS BY END USER (2024)
FIGURE 144 JAPAN MARKET SHARE ANALYSIS BY TYPE (2024)
FIGURE 145 JAPAN MARKET SHARE ANALYSIS BY END USER (2024)
FIGURE 146 INDIA MARKET SHARE ANALYSIS BY TYPE (2024)
FIGURE 147 INDIA MARKET SHARE ANALYSIS BY END USER (2024)
FIGURE 148 SOUTH KOREA MARKET SHARE ANALYSIS BY TYPE (2024)
FIGURE 149 SOUTH KOREA MARKET SHARE ANALYSIS BY END USER (2024)
FIGURE 150 SAUDI ARABIA MARKET SHARE ANALYSIS BY TYPE (2024)
FIGURE 151 SAUDI ARABIA MARKET SHARE ANALYSIS BY END USER (2024)
FIGURE 152 UAE MARKET SHARE ANALYSIS BY TYPE (2024)
FIGURE 153 UAE MARKET SHARE ANALYSIS BY END USER (2024)
FIGURE 154 EGYPT MARKET SHARE ANALYSIS BY TYPE (2024)
FIGURE 155 EGYPT MARKET SHARE ANALYSIS BY END USER (2024)
FIGURE 156 NIGERIA MARKET SHARE ANALYSIS BY TYPE (2024)
FIGURE 157 NIGERIA MARKET SHARE ANALYSIS BY END USER (2024)
FIGURE 158 SOUTH AFRICA MARKET SHARE ANALYSIS BY TYPE (2024)
FIGURE 159 SOUTH AFRICA MARKET SHARE ANALYSIS BY END USER (2024)
FIGURE 160 GERMANY MARKET SHARE ANALYSIS BY TYPE (2024)
FIGURE 161 GERMANY MARKET SHARE ANALYSIS BY END USER (2024)
FIGURE 162 FRANCE MARKET SHARE ANALYSIS BY TYPE (2024)
FIGURE 163 FRANCE MARKET SHARE ANALYSIS BY END USER (2024)
FIGURE 164 UK MARKET SHARE ANALYSIS BY TYPE (2024)
FIGURE 165 UK MARKET SHARE ANALYSIS BY END USER (2024)
FIGURE 166 SPAIN MARKET SHARE ANALYSIS BY TYPE (2024)
FIGURE 167 SPAIN MARKET SHARE ANALYSIS BY END USER (2024)
FIGURE 168 ITALY MARKET SHARE ANALYSIS BY TYPE (2024)
FIGURE 169 ITALY MARKET SHARE ANALYSIS BY END USER (2024)
FIGURE 170 BRAZIL MARKET SHARE ANALYSIS BY TYPE (2024)
FIGURE 171 BRAZIL MARKET SHARE ANALYSIS BY END USER (2024)
FIGURE 172 ARGENTINA MARKET SHARE ANALYSIS BY TYPE (2024)
FIGURE 173 ARGENTINA MARKET SHARE ANALYSIS BY END USER (2024)
FIGURE 174 COLUMBIA MARKET SHARE ANALYSIS BY TYPE (2024)
FIGURE 175 COLUMBIA MARKET SHARE ANALYSIS BY END USER (2024)
FIGURE 176 GLOBAL LOW-LATENCY CONTENT SHARING CURRENT AND FUTURE MARKET KEY COUNTRY LEVEL ANALYSIS, 2024–2034, (USD MILLION)
FIGURE 177 FINANCIAL OVERVIEW:
Key Player Analysis
Amazon Web Services, Inc.: Amazon Web Services (AWS) maintains a leadership position in the low-latency content sharing market, supported by its expansive global cloud infrastructure and edge capabilities. The company’s AWS CloudFront and AWS Elemental Media Services enable high-performance video processing and content delivery, serving major media platforms and enterprise clients. As of 2025, AWS operates over 600 edge locations in more than 100 countries, reinforcing its ability to meet real-time delivery requirements. AWS continues to invest in AI-based content optimization and real-time streaming capabilities, aligning with the demand for latency-sensitive applications in gaming, broadcasting, and virtual events. The 2024 acquisition of a real-time video startup strengthened its low-latency encoding stack, positioning AWS as a preferred vendor for OTT and cloud gaming services.
Akamai Technologies, Inc.: Akamai positions itself as a challenger in this market, leveraging its established CDN infrastructure and expanding edge platform to meet growing demands for real-time content delivery. The company supports sub-50 millisecond latency across several global regions through its EdgeWorkers and Adaptive Media Delivery services. In 2025, Akamai’s low-latency solutions power live sports streaming, esports broadcasts, and enterprise-grade video collaboration tools. Its 2024 launch of Akamai Connected Cloud enhanced its appeal to latency-sensitive industries by integrating compute, storage, and content delivery under a single platform. Differentiators include strong penetration in financial services and security-focused deployments, where real-time performance and data protection are equally prioritized.
Google LLC: Google holds a strong position as an innovator, driven by its integrated cloud and AI ecosystem. Google Cloud’s Media CDN, combined with its global network backbone, delivers sub-second latency for video, audio, and data applications. YouTube’s continued scale and performance requirements have shaped Google’s infrastructure investments, providing a testing ground for global low-latency capabilities. In 2025, the company advanced its real-time delivery through AI-driven bitrate adjustment and traffic routing. Google’s emphasis on open-source frameworks like WebRTC and AV1 adoption strengthens its value proposition among developers and enterprise clients looking for flexible, cost-efficient streaming solutions.
Microsoft Corporation: Microsoft operates as a strategic platform provider, with Azure driving its position in the low-latency content sharing ecosystem. Azure Media Services, combined with Azure Edge Zones and Azure Front Door, supports real-time video delivery, live encoding, and low-latency conferencing tools. The company’s collaboration tools, particularly Microsoft Teams, have seen significant upgrades with AI-based enhancements to reduce lag and improve synchronous user interactions. As of 2025, Microsoft reports a 27% year-on-year increase in usage of its media APIs, largely driven by hybrid workplace adoption and education sector demand. Its partnerships with telecom providers in North America and Europe have expanded regional low-latency reach, making Azure a competitive option for content providers requiring performance consistency across markets.
Market Key Players
Cloudflare, Inc.
Cisco Systems, Inc.
Amazon Web Services, Inc.
Verizon Communications Inc.
Google LLC
Fastly
Akamai Technologies, Inc.
Huawei Technologies Co., Ltd.
Ericsson
Microsoft Corporation
Other Key Players
Driver:
Rising Demand for Instant, High-Quality Digital Interactions
Surging Demand for Real-Time Digital Interactions
Real-time content delivery has become crucial for enterprise platforms, consumer entertainment, and institutional communications. As virtual collaboration tools, live-streaming services, and interactive digital environments grow globally, performance expectations keep increasing. Video now makes up more than 70% of total global internet traffic, highlighting the need for efficient, low-latency delivery channels. Low-latency infrastructure allows seamless interaction in hybrid work environments, immersive media formats, and cloud-connected workflows. This directly impacts user retention, revenue, and competitive edge. Companies increasingly aim for delivery times under 100 milliseconds to keep users engaged and offer premium experiences across multiple devices.
Edge, AI, and Streaming Technologies Reshaping Performance Expectations
This focus on performance is changing investment priorities in the digital landscape. Organizations are speeding up the deployment of edge computing nodes, AI-driven traffic management, and adaptive bitrate streaming technologies. These efforts aim to cut load times and ensure stable quality despite variable network conditions. Leading platforms are enhancing real-time processing to support global audiences with minimal delay, particularly in industries where seconds or milliseconds affect business outcomes. These improvements reinforce low-latency content delivery as a key driver of digital communication and media consumption in 2025 and beyond.
Restraint:
Infrastructure Gaps and Latency Inequality Across Regions
Infrastructure Gaps Limiting Global Low-Latency Access
Despite improvements in global connectivity, significant infrastructure gaps still hinder the widespread adoption of low-latency services. Regions in Sub-Saharan Africa, Latin America, and South Asia struggle with inconsistent broadband access and poor mobile network performance. By 2025, over 30% of the global population will still face network latency above 150 milliseconds, severely limiting real-time applications like cloud gaming, virtual classrooms, telehealth, and live-streamed corporate communications. These limitations create unequal access to digital services, slowing market adoption in latency-sensitive fields and widening the technology gap between wealthy and emerging markets.
Network Congestion and Last-Mile Challenges Increasing Delivery Costs
Even advanced regions face challenges related to network congestion, inadequate last-mile infrastructure, and bandwidth overload during peak times. Companies and content platforms often have to spend more on CDN optimization, multi-region hosting, and backup connectivity to maintain consistent quality across fragmented networks. These challenges add to operational complexity and increase service delivery costs. Without major investment in fiber expansion, spectrum usage, and edge infrastructure, low-latency use cases will continue to encounter adoption barriers in large areas of the global market.
Opportunity:
Expansion of Real-Time Digital Learning and Interactive Education
Rapid Expansion of Low-Latency Virtual Learning Ecosystems
Virtual education is emerging as a strong opportunity for low-latency content sharing in the next decade. The global e-learning market is expected to surpass USD 600 billion by 2030. Real-time video instruction, collaboration tools, and interactive assessment features are becoming vital parts of modern classrooms. In 2025, more than 1.2 billion students will engage in hybrid or fully remote learning, many of which depend on uninterrupted, high-quality live sessions. Low-latency systems greatly improve engagement, reduce lag in communication between teachers and students, and boost understanding—especially in STEM, language learning, and skills training that needs real-time feedback.
Real-Time EdTech Tools Unlocking New Commercial Opportunities
The EdTech sector is quickly adopting WebRTC-based streaming models, instant collaboration tools, and latency-sensitive applications like virtual labs, interactive whiteboards, and live polling. As developing regions invest in digital learning infrastructure, demand for reliable low-latency solutions is likely to grow rapidly. Providers that can offer scalable, cost-effective, and bandwidth-efficient content delivery networks (CDNs) will find strong competitive advantages. This area represents a high-growth opportunity for technology vendors looking to expand into education, training, and workforce development markets.
The combination of 5G connectivity and distributed edge computing is changing the framework of low-latency content delivery. By 2025, over 45% of global mobile connections will be 5G-enabled, leading to faster uplink and downlink speeds and significantly less jitter and round-trip delay. Telecom operators are rapidly setting up edge data centers to bring computing power closer to users, cutting latency by 40-60% for real-time applications. This shift in infrastructure is enabling new use cases, such as real-time translation, interactive e-commerce, augmented and spatial computing, and remote industrial operations that need near-instant data processing and streaming.
Low-Latency Zones Enabling Next-Generation Interactive Applications
Cloud providers and telecom companies are creating strategic partnerships to build "low-latency zones" where app developers and organizations can run workloads tailored for high-performance streaming. These advances allow providers to offer highly responsive experiences at scale while supporting millions of concurrent users. As content processing moves closer to the network edge, organizations will gain more control over performance, reliability, and localization, setting the stage for next-generation, highly interactive digital ecosystems.
Recent Developments
Dec 2024 – Akamai Technologies, Inc.: Akamai launched its upgraded Adaptive Media Delivery platform with edge AI integration to reduce video start time by up to 35% across key markets. This strengthens Akamai’s position in latency-sensitive applications like esports and live broadcasting.
Feb 2025 – Microsoft Corporation: Microsoft expanded Azure Edge Zones to five new cities in Europe and Asia, targeting dense user clusters for low-latency media delivery. The expansion supports Azure’s regional growth strategy and improves performance for enterprise and education clients.
Apr 2025 – Amazon Web Services, Inc.: AWS acquired FrameShift Video, a low-latency streaming startup valued at approximately USD 210 million, to enhance its real-time video encoding capabilities. The acquisition enhances AWS’s competitive edge in live content delivery for OTT and cloud gaming providers.
Jul 2025 – Google LLC: Google introduced an AI-powered traffic management system within Google Cloud’s Media CDN that reduced latency by up to 28% during peak traffic. The update improves user experience on YouTube and bolsters Google’s position as a key infrastructure provider for content platforms.
Sep 2025 – Tencent Cloud: Tencent Cloud entered the European market with a new low-latency CDN offering, initially covering 11 countries. The expansion marks Tencent’s strategic move to compete with global CDN leaders and capture demand from gaming, streaming, and enterprise users.
Sep 2025 – Zoom Video Communications: Zoom announced a partnership with Akamai to deploy real-time optimization for video conferencing across Asia Pacific. The collaboration is expected to reduce average latency by 40% in key markets like India and Indonesia, strengthening Zoom’s enterprise user base in the region.