Lubricants Market Size, Share & Growth Outlook | CAGR 5.1%
Global Lubricants Market Size, Share & Industry Analysis By Product Type (Mineral Oil, Synthetic, Bio-Based), By Application (Automotive, Industrial, Marine, Aviation), EV Impact on Lubricant Demand, Sustainability & Low-Emission Formulations, Digital Monitoring Trends, Regional Outlook, Key Manufacturers & Forecast 2025–2034
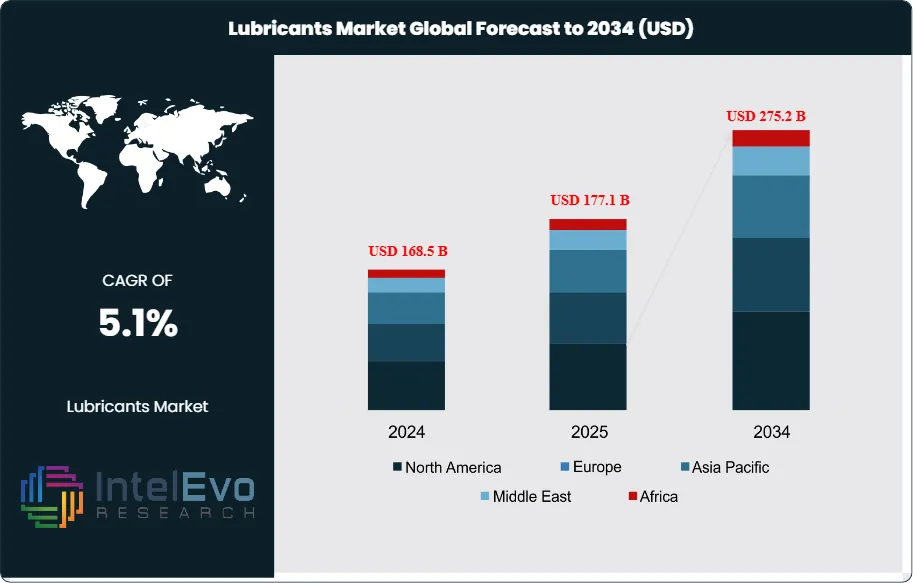
The Lubricants Market is estimated at USD 168.5 billion in 2024 and is projected to reach approximately USD 275.2 billion by 2034, registering a compound annual growth rate (CAGR) of about 5.1% during 2025–2034. This steady expansion reflects sustained demand from automotive, industrial manufacturing, and energy sectors, alongside rising vehicle parc growth in emerging economies. In parallel, the accelerating shift toward high-performance synthetic and bio-based lubricants is reshaping product mix and value realization. Increasing emphasis on equipment longevity, fuel efficiency, and emissions reduction is further reinforcing lubricant consumption across both mature and developing markets, supporting long-term industry momentum.
The market has expanded steadily over the past decade, supported by rising industrial output, increasing vehicle ownership, and the growing need for specialized formulations across automotive, manufacturing, marine, and energy sectors. While demand growth has moderated compared with earlier cycles, the market continues to demonstrate resilience, with steady replacement demand and new applications sustaining long-term consumption.
Automotive lubricants remain the largest segment, accounting for more than 50% of global demand, driven by the expansion of passenger and commercial vehicle fleets. Industrial lubricants are also gaining traction, supported by manufacturing growth in Asia and the modernization of equipment in developed economies. Marine and aviation lubricants, though smaller in scale, are expected to see stable demand as global trade volumes recover and fleet upgrades require higher-grade formulations.
Several demand-side drivers are shaping the market outlook. Rising adoption of energy-efficient vehicles is increasing the need for advanced lubricants with improved thermal stability and lower viscosity. Industrial users are seeking products that extend equipment life and reduce downtime, creating opportunities for synthetic and semi-synthetic blends. On the supply side, volatility in crude oil prices and tightening environmental regulations present challenges, particularly for producers reliant on conventional base oils. The transition toward bio-based lubricants is gaining momentum, with regulatory support in Europe and North America accelerating adoption.
Technology is reshaping the competitive landscape. Digital monitoring systems that track lubricant performance in real time are being integrated into industrial operations, reducing waste and improving predictive maintenance. Artificial intelligence and automation are enabling more precise formulation development, while additive technologies are enhancing lubricant efficiency and durability. These advancements are expected to support premiumization and margin expansion for producers.
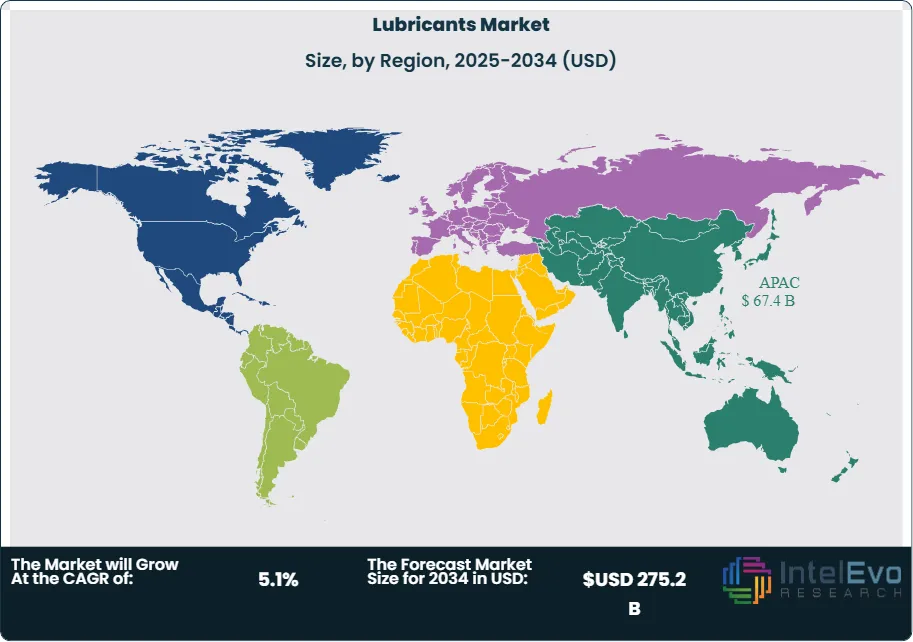
Regionally, Asia-Pacific dominates consumption, accounting for over 40% of global demand, led by China and India’s automotive and industrial sectors. North America and Europe remain mature but important markets, with growth centered on synthetics and environmentally compliant products. Emerging opportunities are visible in the Middle East and Africa, where infrastructure expansion and industrialization are driving lubricant requirements. For investors, the most attractive hotspots lie in synthetic lubricants, bio-based alternatives, and digitalized service models that align with sustainability and efficiency priorities.
Key Takeaways
Market Growth: The global lubricants industry was estimated at USD 168.5 billion in 2024 and is forecasted to climb to USD 275.2 billion by 2034, advancing at a compound annual growth rate (CAGR) of 5.1% between 2023 and 2032. This expansion is being fueled by the steady rise in automotive consumption, the broadening of industrial activities, and the increasing reliance on high-performance fluids for modern machinery.
By Type: Synthetic lubricants accounted for 39.3% of global revenue in 2022, driven by superior thermal stability, extended drain intervals, and adoption in premium automotive and industrial applications. Mineral oils remain widely used but face pressure from regulatory and efficiency requirements.
By Application: Automotive lubricants represent over 50% of total demand, with engine oils, gear oils, and transmission fluids driving consumption. Industrial lubricants follow, supported by hydraulic systems, compressors, and heavy machinery in manufacturing and construction.
Driver: Global vehicle ownership exceeded 1.4 billion units in 2022, directly fueling lubricant consumption. Expanding transportation fleets in Asia and Africa are expected to add significant incremental demand through 2032.
Restraint: The rapid adoption of electric vehicles, which require up to 30% fewer lubricants than internal combustion engine vehicles, poses a long-term risk. EVs are projected to represent 18% of global vehicle sales by 2030, reducing demand for conventional engine oils.
Opportunity: Bio-based lubricants are gaining traction, with the segment expected to surpass USD 5.5 billion by 2030 at a CAGR above 6%. Regulatory incentives in Europe and North America are accelerating adoption, creating a high-growth niche for producers.
Trend: Digital monitoring of lubricant performance is expanding, with predictive maintenance solutions reducing downtime by up to 20%. Companies such as Shell and ExxonMobil are investing in AI-driven lubricant management platforms to strengthen aftermarket services.
Regional Analysis: Asia-Pacific accounted for over 40% of global lubricant demand in 2022, led by China and India’s automotive and industrial sectors. North America and Europe remain mature markets with strong demand for synthetics and eco-friendly products, while the Middle East and Africa are emerging growth hubs supported by infrastructure and energy investments.
Type Analysis
The global lubricants market in 2025 continues to be defined by three primary categories: mineral, semi-synthetic, and synthetic formulations. Synthetic lubricants remain the largest and fastest-growing segment, accounting for more than 39% of global revenue in 2024 and projected to expand at a CAGR above 4% through 2032. Their dominance is linked to superior performance in high-temperature and high-load environments, making them essential for advanced automotive engines, aerospace applications, and heavy industrial machinery. Producers such as ExxonMobil and Shell are expanding premium synthetic portfolios to capture this demand.
Semi-synthetic lubricants, which blend mineral and synthetic bases, are gaining traction as a cost-effective alternative. They provide improved thermal stability and wear protection compared with mineral oils, while remaining more affordable than fully synthetic options. This balance has made them particularly attractive in emerging markets where cost sensitivity is high but performance requirements are rising.
Mineral lubricants, derived directly from crude oil, still represent a significant share of global consumption due to their wide availability and low cost. However, their growth is slowing as regulatory pressures and efficiency standards push end-users toward higher-performing alternatives. By 2030, mineral lubricants are expected to lose share to synthetics and bio-based formulations, especially in North America and Europe.
Product Analysis
Automotive oils remain the largest product category, representing more than half of total lubricant demand in 2024. Engine oils, gear oils, and transmission fluids continue to drive consumption, supported by a global vehicle fleet exceeding 1.5 billion units. Growth is particularly strong in Asia-Pacific, where rising car ownership and commercial fleet expansion sustain high demand.
Industrial oils form the second-largest segment, with applications across hydraulic systems, compressors, bearings, and gears. Industrial demand is being reinforced by manufacturing growth in Asia and the modernization of equipment in Europe and North America. Metalworking fluids, though smaller in scale, are critical in automotive and aerospace component production, with demand tied closely to global manufacturing output.
Marine lubricants, designed to withstand corrosion and extreme operating conditions, are a specialized but stable segment. Demand is supported by global shipping activity, offshore drilling, and naval operations. Increasing regulatory requirements on sulfur emissions are driving the adoption of higher-grade marine lubricants, creating opportunities for suppliers with advanced formulations.
End-Use Analysis
Transportation remains the dominant end-use sector, accounting for more than 50% of global lubricant consumption in 2024. This includes passenger vehicles, commercial fleets, and aviation. While electric vehicle adoption is expected to reduce demand for conventional engine oils, growth in commercial transport and aviation continues to sustain lubricant requirements.
The industrial sector is the second-largest end-user, spanning agriculture, mining, construction, and manufacturing. Industrial lubricants are critical for reducing downtime and extending equipment life, particularly in capital-intensive industries. Demand is expected to rise steadily in Asia-Pacific and the Middle East, where infrastructure and industrial investments remain strong.
Marine applications represent a smaller but strategically important end-use category. Commercial shipping, offshore rigs, and naval fleets require specialized lubricants that can withstand extreme conditions. Regulatory compliance on emissions and sustainability is reshaping this segment, with bio-based and low-sulfur lubricants gaining traction.
Regional Analysis
Asia-Pacific continues to lead the global lubricants market, accounting for more than 40% of total demand in 2024. China and India remain the largest consumers, driven by rapid industrialization, expanding automotive fleets, and infrastructure development. The region is projected to maintain a CAGR above 3.5% through 2032, making it the most attractive growth hub for producers.
North America and Europe represent mature but stable markets. Demand is shifting toward synthetic and environmentally compliant lubricants, supported by stringent emissions regulations and the adoption of advanced machinery. The U.S. remains a key market for premium automotive and industrial lubricants, while Europe is leading in bio-based lubricant adoption.
Latin America and the Middle East & Africa are emerging growth regions. Brazil and Mexico are driving demand in Latin America through automotive and industrial expansion. In the Middle East & Africa, infrastructure projects, energy sector investments, and rising vehicle ownership are expected to accelerate lubricant consumption. These regions present long-term opportunities for suppliers targeting cost-effective yet high-performance formulations.
By Type, Mineral, Semi-Synthetic, Synthetic, By Product, Automotive Oils, Industrial Oils, Metalworking Fluids, Hydraulic Oils, Process Oils, Marine Oils, Greases, Other Products, By End-Use Industry, Transportation, Industries, Marine
Research Methodology
Primary Research- 100 Interviews of Stakeholders
Secondary Research
Desk Research
Regional scope
North America (United States, Canada, Mexico)
Latin America (Brazil, Argentina, Columbia)
East Asia And Pacific (China, Japan, South Korea, Australia, Cambodia, Fiji, Indonesia)
Sea And South Asia (India, Singapore, Thailand, Taiwan, Malaysia)
Eastern Europe (Poland, Russia, Czech Republic, Romania)
Western Europe (Germany, U.K., France, Spain, Itlay)
Middle East & Africa (GCC Countries, Egypt, Nigeria, South Africa, Israel)
Competitive Landscape
Valvoline LLC, PetroFer Chemie, ExxonMobil Corp., Castrol India Ltd., Zeller Gmelin Gmbh & Co. KG, Chevron Corp., Lukoil, Royal Dutch Shell Co., Blaser Swisslube Inc., Amsoil Inc., Quaker Chemical Corp., PetroChina Company Ltd., Fuchs, Petrobras, JX Nippon Oil & Gas Exploration Corp., China Petrochemical Corp., Petronas Lubricant International, Idemitsu Kosan Co. Ltd., Total Energies, Buhmwoo Chemical Co. Ltd., Philips 66 Company, BP PLC., Other Key Players
Customization Scope
Customization for segments, region/country-level will be provided. Moreover, additional customization can be done based on the requirements.
Pricing and Purchase Options
Avail customized purchase options to meet your exact research needs. We have three licenses to opt for: Single User License, Multi-User License (Up to 5 Users), Corporate Use License (Unlimited User and Printable PDF).
TABLE OF CONTENTS
1. EXECUTIVE SUMMARY
1.1. MARKET SNAPSHOT
1.2. KEY FINDINGS & INSIGHTS
1.3. ANALYST RECOMMENDATIONS
1.4. FUTURE OUTLOOK
2. RESEARCH METHODOLOGY
2.1. MARKET DEFINITION & SCOPE
2.2. RESEARCH OBJECTIVES: PRIMARY & SECONDARY DATA SOURCES
2.3. DATA COLLECTION SOURCES
2.3.1. COVERAGE OF 100+ PRIMARY RESEARCH/CONSULTATION CALLS WITH INDUSTRY STAKEHOLDERS
FIGURE 17 NORTH AMERICA LUBRICANTS CURRENT AND FUTURE TYPE ANALYSIS, 2025–2034, (USD MILLION)
FIGURE 18 NORTH AMERICA LUBRICANTS CURRENT AND FUTURE END USER ANALYSIS, 2025–2034, (USD MILLION)
FIGURE 19 MARKET SHARE BY COUNTRY
FIGURE 20 LATIN AMERICA LUBRICANTS CURRENT AND FUTURE TYPE ANALYSIS, 2025–2034, (USD MILLION)
FIGURE 21 LATIN AMERICA LUBRICANTS CURRENT AND FUTURE END USER ANALYSIS, 2025–2034, (USD MILLION)
FIGURE 22 MARKET SHARE BY COUNTRY
FIGURE 23 EASTERN EUROPE LUBRICANTS CURRENT AND FUTURE TYPE ANALYSIS, 2025–2034, (USD MILLION)
FIGURE 24 EASTERN EUROPE LUBRICANTS CURRENT AND FUTURE END USER ANALYSIS, 2025–2034, (USD MILLION)
FIGURE 25 MARKET SHARE BY COUNTRY
FIGURE 26 WESTERN EUROPE LUBRICANTS CURRENT AND FUTURE TYPE ANALYSIS, 2025–2034, (USD MILLION)
FIGURE 27 WESTERN EUROPE LUBRICANTS CURRENT AND FUTURE END USER ANALYSIS, 2025–2034, (USD MILLION)
FIGURE 28 MARKET SHARE BY COUNTRY
FIGURE 29 EAST ASIA AND PACIFIC LUBRICANTS CURRENT AND FUTURE TYPE ANALYSIS, 2025–2034, (USD MILLION)
FIGURE 30 EAST ASIA AND PACIFIC LUBRICANTS CURRENT AND FUTURE END USER ANALYSIS, 2025–2034, (USD MILLION)
FIGURE 31 MARKET SHARE BY COUNTRY
FIGURE 32 SEA AND SOUTH ASIA LUBRICANTS CURRENT AND FUTURE TYPE ANALYSIS, 2025–2034, (USD MILLION)
FIGURE 33 SEA AND SOUTH ASIA LUBRICANTS CURRENT AND FUTURE END USER ANALYSIS, 2025–2034, (USD MILLION)
FIGURE 34 MARKET SHARE BY COUNTRY
FIGURE 35 MIDDLE EAST AND AFRICA LUBRICANTS CURRENT AND FUTURE TYPE ANALYSIS, 2025–2034, (USD MILLION)
FIGURE 36 MIDDLE EAST AND AFRICA LUBRICANTS CURRENT AND FUTURE END USER ANALYSIS, 2025–2034, (USD MILLION)
FIGURE 37 NORTH AMERICA LUBRICANTS CURRENT AND FUTURE MARKET VOLUME SHARE REGIONAL ANALYSIS, 2025–2034, (USD MILLION)
FIGURE 38 U.S. LUBRICANTS CURRENT AND FUTURE TYPE ANALYSIS, 2025–2034, (USD MILLION)
FIGURE 39 U.S. LUBRICANTS CURRENT AND FUTURE END USER ANALYSIS, 2025–2034, (USD MILLION)
FIGURE 40 CANADA LUBRICANTS CURRENT AND FUTURE TYPE ANALYSIS, 2025–2034, (USD MILLION)
FIGURE 41 CANADA LUBRICANTS CURRENT AND FUTURE END USER ANALYSIS, 2025–2034, (USD MILLION)
FIGURE 42 LATIN AMERICA LUBRICANTS CURRENT AND FUTURE MARKET VOLUME SHARE REGIONAL ANALYSIS, 2025–2034, (USD MILLION)
FIGURE 43 MEXICO LUBRICANTS CURRENT AND FUTURE TYPE ANALYSIS, 2025–2034, (USD MILLION)
FIGURE 44 MEXICO LUBRICANTS CURRENT AND FUTURE END USER ANALYSIS, 2025–2034, (USD MILLION)
FIGURE 45 BRAZIL LUBRICANTS CURRENT AND FUTURE TYPE ANALYSIS, 2025–2034, (USD MILLION)
FIGURE 46 BRAZIL LUBRICANTS CURRENT AND FUTURE END USER ANALYSIS, 2025–2034, (USD MILLION)
FIGURE 47 ARGENTINA LUBRICANTS CURRENT AND FUTURE TYPE ANALYSIS, 2025–2034, (USD MILLION)
FIGURE 48 ARGENTINA LUBRICANTS CURRENT AND FUTURE END USER ANALYSIS, 2025–2034, (USD MILLION)
FIGURE 49 COLUMBIA LUBRICANTS CURRENT AND FUTURE TYPE ANALYSIS, 2025–2034, (USD MILLION)
FIGURE 50 COLUMBIA LUBRICANTS CURRENT AND FUTURE END USER ANALYSIS, 2025–2034, (USD MILLION)
FIGURE 51 REST OF LATIN AMERICA LUBRICANTS CURRENT AND FUTURE TYPE ANALYSIS, 2025–2034, (USD MILLION)
FIGURE 52 REST OF LATIN AMERICA LUBRICANTS CURRENT AND FUTURE END USER ANALYSIS, 2025–2034, (USD MILLION)
FIGURE 53 EASTERN EUROPE LUBRICANTS CURRENT AND FUTURE MARKET VOLUME SHARE REGIONAL ANALYSIS, 2025–2034, (USD MILLION)
FIGURE 54 POLAND LUBRICANTS CURRENT AND FUTURE TYPE ANALYSIS, 2025–2034, (USD MILLION)
FIGURE 55 POLAND LUBRICANTS CURRENT AND FUTURE END USER ANALYSIS, 2025–2034, (USD MILLION)
FIGURE 56 RUSSIA LUBRICANTS CURRENT AND FUTURE TYPE ANALYSIS, 2025–2034, (USD MILLION)
FIGURE 57 RUSSIA LUBRICANTS CURRENT AND FUTURE END USER ANALYSIS, 2025–2034, (USD MILLION)
FIGURE 58 CZECH REPUBLIC LUBRICANTS CURRENT AND FUTURE TYPE ANALYSIS, 2025–2034, (USD MILLION)
FIGURE 59 CZECH REPUBLIC LUBRICANTS CURRENT AND FUTURE END USER ANALYSIS, 2025–2034, (USD MILLION)
FIGURE 60 ROMANIA LUBRICANTS CURRENT AND FUTURE TYPE ANALYSIS, 2025–2034, (USD MILLION)
FIGURE 61 ROMANIA LUBRICANTS CURRENT AND FUTURE END USER ANALYSIS, 2025–2034, (USD MILLION)
FIGURE 62 REST OF EASTERN EUROPE LUBRICANTS CURRENT AND FUTURE TYPE ANALYSIS, 2025–2034, (USD MILLION)
FIGURE 63 REST OF EASTERN EUROPE LUBRICANTS CURRENT AND FUTURE END USER ANALYSIS, 2025–2034, (USD MILLION)
FIGURE 64 WESTERN EUROPE LUBRICANTS CURRENT AND FUTURE MARKET VOLUME SHARE REGIONAL ANALYSIS, 2025–2034, (USD MILLION)
FIGURE 65 GERMANY LUBRICANTS CURRENT AND FUTURE TYPE ANALYSIS, 2025–2034, (USD MILLION)
FIGURE 66 GERMANY LUBRICANTS CURRENT AND FUTURE END USER ANALYSIS, 2025–2034, (USD MILLION)
FIGURE 67 FRANCE LUBRICANTS CURRENT AND FUTURE TYPE ANALYSIS, 2025–2034, (USD MILLION)
FIGURE 68 FRANCE LUBRICANTS CURRENT AND FUTURE END USER ANALYSIS, 2025–2034, (USD MILLION)
FIGURE 69 UK LUBRICANTS CURRENT AND FUTURE TYPE ANALYSIS, 2025–2034, (USD MILLION)
FIGURE 70 UK LUBRICANTS CURRENT AND FUTURE END USER ANALYSIS, 2025–2034, (USD MILLION)
FIGURE 71 SPAIN LUBRICANTS CURRENT AND FUTURE TYPE ANALYSIS, 2025–2034, (USD MILLION)
FIGURE 72 SPAIN LUBRICANTS CURRENT AND FUTURE END USER ANALYSIS, 2025–2034, (USD MILLION)
FIGURE 73 ITALY LUBRICANTS CURRENT AND FUTURE TYPE ANALYSIS, 2025–2034, (USD MILLION)
FIGURE 74 ITALY LUBRICANTS CURRENT AND FUTURE END USER ANALYSIS, 2025–2034, (USD MILLION)
FIGURE 75 REST OF WESTERN EUROPE LUBRICANTS CURRENT AND FUTURE TYPE ANALYSIS, 2025–2034, (USD MILLION)
FIGURE 76 REST OF WESTERN EUROPE LUBRICANTS CURRENT AND FUTURE END USER ANALYSIS, 2025–2034, (USD MILLION)
FIGURE 77 EAST ASIA AND PACIFIC LUBRICANTS CURRENT AND FUTURE MARKET VOLUME SHARE REGIONAL ANALYSIS, 2025–2034, (USD MILLION)
FIGURE 78 CHINA LUBRICANTS CURRENT AND FUTURE TYPE ANALYSIS, 2025–2034, (USD MILLION)
FIGURE 79 CHINA LUBRICANTS CURRENT AND FUTURE END USER ANALYSIS, 2025–2034, (USD MILLION)
FIGURE 80 JAPAN LUBRICANTS CURRENT AND FUTURE TYPE ANALYSIS, 2025–2034, (USD MILLION)
FIGURE 81 JAPAN LUBRICANTS CURRENT AND FUTURE END USER ANALYSIS, 2025–2034, (USD MILLION)
FIGURE 82 AUSTRALIA LUBRICANTS CURRENT AND FUTURE TYPE ANALYSIS, 2025–2034, (USD MILLION)
FIGURE 83 AUSTRALIA LUBRICANTS CURRENT AND FUTURE END USER ANALYSIS, 2025–2034, (USD MILLION)
FIGURE 84 CAMBODIA LUBRICANTS CURRENT AND FUTURE TYPE ANALYSIS, 2025–2034, (USD MILLION)
FIGURE 85 CAMBODIA LUBRICANTS CURRENT AND FUTURE END USER ANALYSIS, 2025–2034, (USD MILLION)
FIGURE 86 FIJI LUBRICANTS CURRENT AND FUTURE TYPE ANALYSIS, 2025–2034, (USD MILLION)
FIGURE 87 FIJI LUBRICANTS CURRENT AND FUTURE END USER ANALYSIS, 2025–2034, (USD MILLION)
FIGURE 88 INDONESIA LUBRICANTS CURRENT AND FUTURE TYPE ANALYSIS, 2025–2034, (USD MILLION)
FIGURE 89 INDONESIA LUBRICANTS CURRENT AND FUTURE END USER ANALYSIS, 2025–2034, (USD MILLION)
FIGURE 90 SOUTH KOREA LUBRICANTS CURRENT AND FUTURE TYPE ANALYSIS, 2025–2034, (USD MILLION)
FIGURE 91 SOUTH KOREA LUBRICANTS CURRENT AND FUTURE END USER ANALYSIS, 2025–2034, (USD MILLION)
FIGURE 92 REST OF EAST ASIA AND PACIFIC LUBRICANTS CURRENT AND FUTURE TYPE ANALYSIS, 2025–2034, (USD MILLION)
FIGURE 93 REST OF EAST ASIA AND PACIFIC LUBRICANTS CURRENT AND FUTURE END USER ANALYSIS, 2025–2034, (USD MILLION)
FIGURE 94 SEA AND SOUTH ASIA LUBRICANTS CURRENT AND FUTURE MARKET VOLUME SHARE REGIONAL ANALYSIS, 2025–2034, (USD MILLION)
FIGURE 95 BANGLADESH LUBRICANTS CURRENT AND FUTURE TYPE ANALYSIS, 2025–2034, (USD MILLION)
FIGURE 96 BANGLADESH LUBRICANTS CURRENT AND FUTURE END USER ANALYSIS, 2025–2034, (USD MILLION)
FIGURE 97 NEW ZEALAND LUBRICANTS CURRENT AND FUTURE TYPE ANALYSIS, 2025–2034, (USD MILLION)
FIGURE 98 NEW ZEALAND LUBRICANTS CURRENT AND FUTURE END USER ANALYSIS, 2025–2034, (USD MILLION)
FIGURE 99 INDIA LUBRICANTS CURRENT AND FUTURE TYPE ANALYSIS, 2025–2034, (USD MILLION)
FIGURE 100 INDIA LUBRICANTS CURRENT AND FUTURE END USER ANALYSIS, 2025–2034, (USD MILLION)
FIGURE 101 SINGAPORE LUBRICANTS CURRENT AND FUTURE TYPE ANALYSIS, 2025–2034, (USD MILLION)
FIGURE 102 SINGAPORE LUBRICANTS CURRENT AND FUTURE END USER ANALYSIS, 2025–2034, (USD MILLION)
FIGURE 103 THAILAND LUBRICANTS CURRENT AND FUTURE TYPE ANALYSIS, 2025–2034, (USD MILLION)
FIGURE 104 THAILAND LUBRICANTS CURRENT AND FUTURE END USER ANALYSIS, 2025–2034, (USD MILLION)
FIGURE 105 TAIWAN LUBRICANTS CURRENT AND FUTURE TYPE ANALYSIS, 2025–2034, (USD MILLION)
FIGURE 106 TAIWAN LUBRICANTS CURRENT AND FUTURE END USER ANALYSIS, 2025–2034, (USD MILLION)
FIGURE 107 MALAYSIA LUBRICANTS CURRENT AND FUTURE TYPE ANALYSIS, 2025–2034, (USD MILLION)
FIGURE 108 MALAYSIA LUBRICANTS CURRENT AND FUTURE END USER ANALYSIS, 2025–2034, (USD MILLION)
FIGURE 109 REST OF SEA AND SOUTH ASIA LUBRICANTS CURRENT AND FUTURE TYPE ANALYSIS, 2025–2034, (USD MILLION)
FIGURE 110 REST OF SEA AND SOUTH ASIA LUBRICANTS CURRENT AND FUTURE END USER ANALYSIS, 2025–2034, (USD MILLION)
FIGURE 111 MIDDLE EAST AND AFRICA LUBRICANTS CURRENT AND FUTURE MARKET VOLUME SHARE REGIONAL ANALYSIS, 2025–2034, (USD MILLION)
FIGURE 112 GCC COUNTRIES LUBRICANTS CURRENT AND FUTURE TYPE ANALYSIS, 2025–2034, (USD MILLION)
FIGURE 113 GCC COUNTRIES LUBRICANTS CURRENT AND FUTURE END USER ANALYSIS, 2025–2034, (USD MILLION)
FIGURE 114 SAUDI ARABIA LUBRICANTS CURRENT AND FUTURE TYPE ANALYSIS, 2025–2034, (USD MILLION)
FIGURE 115 SAUDI ARABIA LUBRICANTS CURRENT AND FUTURE END USER ANALYSIS, 2025–2034, (USD MILLION)
FIGURE 116 UAE LUBRICANTS CURRENT AND FUTURE TYPE ANALYSIS, 2025–2034, (USD MILLION)
FIGURE 117 UAE LUBRICANTS CURRENT AND FUTURE END USER ANALYSIS, 2025–2034, (USD MILLION)
FIGURE 118 BAHRAIN LUBRICANTS CURRENT AND FUTURE TYPE ANALYSIS, 2025–2034, (USD MILLION)
FIGURE 119 BAHRAIN LUBRICANTS CURRENT AND FUTURE END USER ANALYSIS, 2025–2034, (USD MILLION)
FIGURE 120 KUWAIT LUBRICANTS CURRENT AND FUTURE TYPE ANALYSIS, 2025–2034, (USD MILLION)
FIGURE 121 KUWAIT LUBRICANTS CURRENT AND FUTURE END USER ANALYSIS, 2025–2034, (USD MILLION)
FIGURE 122 OMAN LUBRICANTS CURRENT AND FUTURE TYPE ANALYSIS, 2025–2034, (USD MILLION)
FIGURE 123 OMAN LUBRICANTS CURRENT AND FUTURE END USER ANALYSIS, 2025–2034, (USD MILLION)
FIGURE 124 QATAR LUBRICANTS CURRENT AND FUTURE TYPE ANALYSIS, 2025–2034, (USD MILLION)
FIGURE 125 QATAR LUBRICANTS CURRENT AND FUTURE END USER ANALYSIS, 2025–2034, (USD MILLION)
FIGURE 126 EGYPT LUBRICANTS CURRENT AND FUTURE TYPE ANALYSIS, 2025–2034, (USD MILLION)
FIGURE 127 EGYPT LUBRICANTS CURRENT AND FUTURE END USER ANALYSIS, 2025–2034, (USD MILLION)
FIGURE 128 NIGERIA LUBRICANTS CURRENT AND FUTURE TYPE ANALYSIS, 2025–2034, (USD MILLION)
FIGURE 129 NIGERIA LUBRICANTS CURRENT AND FUTURE END USER ANALYSIS, 2025–2034, (USD MILLION)
FIGURE 130 SOUTH AFRICA LUBRICANTS CURRENT AND FUTURE TYPE ANALYSIS, 2025–2034, (USD MILLION)
FIGURE 131 SOUTH AFRICA LUBRICANTS CURRENT AND FUTURE END USER ANALYSIS, 2025–2034, (USD MILLION)
FIGURE 132 ISRAEL LUBRICANTS CURRENT AND FUTURE TYPE ANALYSIS, 2025–2034, (USD MILLION)
FIGURE 133 ISRAEL LUBRICANTS CURRENT AND FUTURE END USER ANALYSIS, 2025–2034, (USD MILLION)
FIGURE 134 REST OF MEA LUBRICANTS CURRENT AND FUTURE TYPE ANALYSIS, 2025–2034, (USD MILLION)
FIGURE 135 REST OF MEA LUBRICANTS CURRENT AND FUTURE END USER ANALYSIS, 2025–2034, (USD MILLION)
FIGURE 136 U. S. MARKET SHARE ANALYSIS BY TYPE (2024)
FIGURE 137 U. S. MARKET SHARE ANALYSIS BY END USER (2024)
FIGURE 138 CANADA MARKET SHARE ANALYSIS BY TYPE (2024)
FIGURE 139 CANADA MARKET SHARE ANALYSIS BY END USER (2024)
FIGURE 140 MEXICO MARKET SHARE ANALYSIS BY TYPE (2024)
FIGURE 141 MEXICO MARKET SHARE ANALYSIS BY END USER (2024)
FIGURE 142 CHINA MARKET SHARE ANALYSIS BY TYPE (2024)
FIGURE 143 CHINA MARKET SHARE ANALYSIS BY END USER (2024)
FIGURE 144 JAPAN MARKET SHARE ANALYSIS BY TYPE (2024)
FIGURE 145 JAPAN MARKET SHARE ANALYSIS BY END USER (2024)
FIGURE 146 INDIA MARKET SHARE ANALYSIS BY TYPE (2024)
FIGURE 147 INDIA MARKET SHARE ANALYSIS BY END USER (2024)
FIGURE 148 SOUTH KOREA MARKET SHARE ANALYSIS BY TYPE (2024)
FIGURE 149 SOUTH KOREA MARKET SHARE ANALYSIS BY END USER (2024)
FIGURE 150 SAUDI ARABIA MARKET SHARE ANALYSIS BY TYPE (2024)
FIGURE 151 SAUDI ARABIA MARKET SHARE ANALYSIS BY END USER (2024)
FIGURE 152 UAE MARKET SHARE ANALYSIS BY TYPE (2024)
FIGURE 153 UAE MARKET SHARE ANALYSIS BY END USER (2024)
FIGURE 154 EGYPT MARKET SHARE ANALYSIS BY TYPE (2024)
FIGURE 155 EGYPT MARKET SHARE ANALYSIS BY END USER (2024)
FIGURE 156 NIGERIA MARKET SHARE ANALYSIS BY TYPE (2024)
FIGURE 157 NIGERIA MARKET SHARE ANALYSIS BY END USER (2024)
FIGURE 158 SOUTH AFRICA MARKET SHARE ANALYSIS BY TYPE (2024)
FIGURE 159 SOUTH AFRICA MARKET SHARE ANALYSIS BY END USER (2024)
FIGURE 160 GERMANY MARKET SHARE ANALYSIS BY TYPE (2024)
FIGURE 161 GERMANY MARKET SHARE ANALYSIS BY END USER (2024)
FIGURE 162 FRANCE MARKET SHARE ANALYSIS BY TYPE (2024)
FIGURE 163 FRANCE MARKET SHARE ANALYSIS BY END USER (2024)
FIGURE 164 UK MARKET SHARE ANALYSIS BY TYPE (2024)
FIGURE 165 UK MARKET SHARE ANALYSIS BY END USER (2024)
FIGURE 166 SPAIN MARKET SHARE ANALYSIS BY TYPE (2024)
FIGURE 167 SPAIN MARKET SHARE ANALYSIS BY END USER (2024)
FIGURE 168 ITALY MARKET SHARE ANALYSIS BY TYPE (2024)
FIGURE 169 ITALY MARKET SHARE ANALYSIS BY END USER (2024)
FIGURE 170 BRAZIL MARKET SHARE ANALYSIS BY TYPE (2024)
FIGURE 171 BRAZIL MARKET SHARE ANALYSIS BY END USER (2024)
FIGURE 172 ARGENTINA MARKET SHARE ANALYSIS BY TYPE (2024)
FIGURE 173 ARGENTINA MARKET SHARE ANALYSIS BY END USER (2024)
FIGURE 174 COLUMBIA MARKET SHARE ANALYSIS BY TYPE (2024)
FIGURE 175 COLUMBIA MARKET SHARE ANALYSIS BY END USER (2024)
FIGURE 176 GLOBAL LUBRICANTS CURRENT AND FUTURE MARKET KEY COUNTRY LEVEL ANALYSIS, 2024–2034, (USD MILLION)
FIGURE 177 FINANCIAL OVERVIEW:
Key Player Analysis
Royal Dutch Shell Co.: Shell positions as a leader with a broad portfolio across engine oils, industrial lubricants, greases, marine oils, and metalworking fluids. The company’s premium synthetic range targets high-mileage fleets and advanced manufacturing. In 2025, Shell focuses on AI-enabled lubricant monitoring, offering predictive maintenance and extended drain programs to large industrial clients. You see this in integrated service contracts that link oil analytics with uptime guarantees.
Shell’s strategy centers on digital platforms, OEM partnerships, and low-carbon products. The company reports rising synthetic mix and higher-margin service attachments in North America and Europe. It invests in bio-based blends for regulated markets and pilots closed-loop recycling for used oils in select regions. The differentiator is scale and data. Global distribution, embedded analytics, and deep OEM integration create switching costs and support price discipline in premium segments.
BP PLC.: BP acts as a challenger in automotive and industrial lubricants under Castrol-branded products. The company is strong in passenger car engine oils and motorsports-grade synthetics. In 2025, BP expands industrial fluids for compressors, hydraulics, and gears, targeting manufacturing in Asia Pacific. It deploys asset monitoring partnerships with equipment makers to tie lubricant usage to performance KPIs.
BP’s growth focus is on premium synthetics and EV-compatible fluids, including thermal management fluids for battery systems. The company highlights higher-margin product mix and targeted market share gains in India and Southeast Asia. Differentiators include strong consumer brand equity, deep retail channel presence, and co-development with OEMs. You should note BP’s push into performance services that bundle analytics with supply, improving retention and pricing power.
Total Energies: TotalEnergies is an innovator in low-emission and bio-based lubricants for automotive, marine, and industrial uses. The company builds on strong positions in Europe and Africa and increases its footprint in Middle East downstream. In 2025, TotalEnergies accelerates R&D in ashless formulations, low-sulfur marine oils, and long-life synthetics for heavy equipment. It supports clients with condition monitoring and fluid management platforms.
The firm differentiates through sustainability claims aligned with EU regulations, lifecycle assessments, and circularity pilots. Management targets double-digit growth in premium synthetics in select European markets and rising share in African commercial fleets. Strategic moves include port-side service expansions for marine customers and partnerships in industrial automation to embed lubricant analytics. The result is stronger pull-through in regulated and service-attached segments.
Chevron Corp.: Chevron is a niche player with strength in North America for commercial fleets, off-highway equipment, and industrial oils. The company’s Delo and Havoline lines address heavy-duty engines and consumer vehicles. In 2025, Chevron focuses on extended drain heavy-duty engine oils, high-load gear oils, and hydraulic fluids for construction and mining. It increases investments in reliability services, offering oil condition analysis and fleet maintenance programs.
Chevron’s differentiators are heavy-duty performance data, direct relationships with fleet operators, and strong presence in energy and mining regions. The company reports steady growth in synthetics within commercial segments and rising attachment of monitoring services. Targeted expansions in Latin America support volume with balanced pricing. For you, the takeaway is clear. Chevron defends margins through technical validation, service depth, and concentration in heavy-duty applications where performance and uptime matter most.
Market Key Players
Valvoline LLC
PetroFer Chemie
ExxonMobil Corp.
Castrol India Ltd.
Zeller Gmelin Gmbh & Co. KG
Chevron Corp.
Lukoil
Royal Dutch Shell Co.
Blaser Swisslube Inc.
Amsoil Inc.
Quaker Chemical Corp.
PetroChina Company Ltd.
Fuchs
Petrobras
JX Nippon Oil & Gas Exploration Corp.
China Petrochemical Corp.
Petronas Lubricant International
Idemitsu Kosan Co. Ltd.
Total Energies
Buhmwoo Chemical Co. Ltd.
Philips 66 Company
BP PLC.
Other Key Players
Driver
Automotive and Industrial Demand Sustains Volume Growth
By 2025, the lubricants market is expected to keep growing due to strong demand from the automotive and industrial sectors. The global vehicle fleet should surpass 1.6 billion units by 2030, ensuring steady use of engine oils, transmission fluids, and gear oils in both passenger and commercial vehicles. Even with improvements in efficiency, regular maintenance and aftermarket demand still support basic lubricant volumes, especially in emerging economies where vehicles last longer.
Energy Efficiency and Equipment Protection Drive Premiumization
Industrial demand is rising as manufacturers use better machinery under Industry 4.0. High-performance lubricants that work well under extreme temperatures, pressures, and continuous-duty cycles are becoming crucial to reduce downtime and extend equipment life. Energy-efficient formulas are gaining popularity as industries aim to cut costs and meet carbon reduction goals. This shift is increasing the need for premium lubricants that contribute to productivity, reliability, and sustainability.
The lubricants market is facing more challenges due to stricter environmental regulations in Europe, North America, and parts of Asia. Policies aimed at reducing emissions and harmful substances are limiting the use of traditional mineral-based lubricants. This forces manufacturers to heavily invest in reformulation, testing, and certification. These compliance demands increase production costs and lengthen product development times, especially for smaller companies with limited research and development resources.
Electric Vehicle Adoption Reduces Core Lubricant Volumes
The faster shift to electric vehicles poses a structural challenge for the market. EVs use up to 30% fewer lubricants than vehicles with internal combustion engines, which largely cuts out the demand for engine oils. With EVs expected to represent over 20% of global new car sales by 2030, this change will gradually reduce volumes in the largest lubricant segment. Producers need to adjust their portfolios toward industrial, specialty, and non-engine applications to counter this long-term decline.
Opportunity
Bio-Based Lubricants Align with Sustainability Mandates
Bio-based lubricants are one of the most promising growth opportunities in the market. Made from renewable feedstocks, these products are set to exceed USD 6 billion in annual revenues by 2030, with a compound annual growth rate above 6%. Regulatory incentives, eco-labeling programs, and corporate ESG commitments are speeding up adoption, particularly in industries sensitive to environmental issues like agriculture, marine, and forestry.
Synthetic Lubricants Benefit from Industrial Expansion
Synthetic lubricants are gaining market share because of their better thermal stability, oxidation resistance, and longer drain intervals. Demand is increasing in premium automotive segments, heavy equipment, and high-speed industrial applications. Rapid industrial growth and infrastructure development in Asia-Pacific and the Middle East are further driving the consumption of high-performance industrial lubricants. For investors, these segments promise strong long-term growth potential with higher margins and lower regulatory risk.
Trend
Sustainability-Focused Formulation Innovation
Sustainability is transforming product development strategies in the lubricants industry. Manufacturers are more frequently using bio-based ingredients, low-toxicity additives, and recyclable packaging to meet the expectations of customers and regulators. At the same time, lubricants enhanced with nanotechnology are emerging, providing better wear protection and longer service life, which helps lower overall lubricant use and waste.
Digitalization and Predictive Maintenance Integration
Digital transformation is becoming a key trend in lubricant use and service delivery. IoT-enabled sensors and AI-driven analytics are now monitoring lubricant conditions in real-time, allowing for predictive maintenance and better replacement timing. These systems can cut equipment downtime by up to 20% and lower overall maintenance costs. Leading suppliers are combining lubricant supply with digital monitoring platforms, moving the market towards value-added services and ongoing revenue models beyond traditional product sales.
Recent Developments
December 2024 – SLB: Finalized its agreement to acquire ChampionX in an all-stock transaction valued at approximately $7.75 billion, with the deal's closure expected by early 2025. This merger combines SLB's technology with ChampionX's production chemistry expertise to broaden service offerings for the energy sector.
January 2025 – FUCHS: Acquired Boss Lubricants GmbH & Co. KG, a German lubricants company. This purchase strengthens FUCHS's market presence within Germany and expands its portfolio of specialty lubricant products.
April 2025 – FUCHS: Acquired IRMCO, a U.S.-based specialist in metal-forming lubricants, continuing its strategic acquisitions. This move deepens the company’s capabilities in high-value industrial segments and grows its footprint in the North American market.
July 2025 – Shell: Completed the 100% acquisition of Raj Petro Specialities in India, integrating its portfolio of transformer oils, white oils, and waxes. The acquisition significantly expands Shell's B2B market reach and product depth in the high-growth Indian lubricants space.
October 2025 – Shell: Launched its upgraded Shell Advance Ultra motorcycle oil, meeting the advanced API SP standard, at the 2025 MotoGP in Thailand. This launch reinforces Shell’s position in the premium synthetic lubricants market, capitalizing on the growing demand for high-performance products which accounted for nearly 35% of new lubricant formulations in 2025.