Marine Composites Market Size, Share & Growth Analysis | North America, Europe, Asia Pacific
Global Marine Composites Market Size, Share, and Industry Analysis by Fiber Type (Glass Fiber, Carbon Fiber, Aramid Fiber), by Resin Type (Polyester, Vinyl Ester, Epoxy, Others), by Application (Hull, Deck, Superstructure, Interior Components), by End User (Recreational Boats, Commercial Marine, Naval & Defense, Offshore Wind & Energy) with Regional Insights, Competitive Landscape, Technology Advancements, Sustainability Trends, Market Dynamics, and Forecast 2025–2034
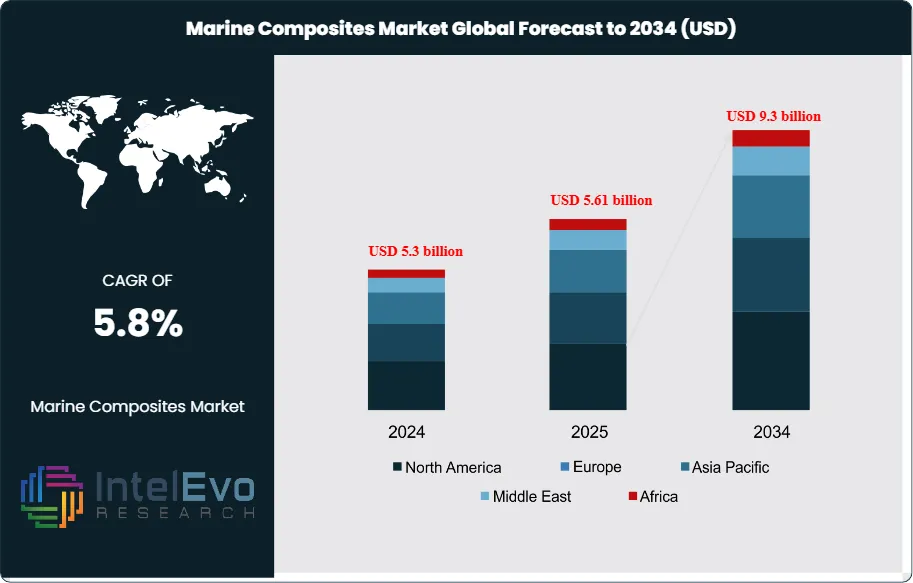
The Marine Composites Market is estimated at USD 5.3 billion in 2024 and is on track to reach roughly USD 9.3 billion by 2034, implying a compound annual growth rate of 5.8% over 2025–2034. This growth is driven by the increasing adoption of lightweight, corrosion-resistant materials in boat hulls, decks, and superstructures to improve fuel efficiency and durability. Rising demand from recreational boating, offshore wind support vessels, and naval modernization programs is further strengthening market momentum. In addition, advancements in fiber-reinforced polymers and resin technologies are enabling longer service life and lower maintenance costs, making marine composites a preferred choice across commercial and defense marine applications.
Market expansion stems from stronger demand for lightweight, corrosion-resistant, high-strength materials across commercial, defense, and recreational fleets. Shipyards increase composite adoption in hulls, decks, and superstructures as operators pursue fuel savings and higher speed profiles. Changing fleet renewal cycles reinforce this trend, with composite-intensive vessels posting fuel savings near 12% and weight reductions near 25% compared with steel-based builds. These performance gains support a steady shift in procurement strategies across large yards in Europe, North America, and East Asia.
Supply conditions remain stable, supported by consistent output in glass fiber, carbon fiber, and resin systems. Glass fiber holds near 55% share due to competitive pricing and broad application, while carbon fiber advances as producers scale output. Resin innovation shapes supplier competition, with vinyl ester and epoxy systems expected to capture stronger margins through improved thermal resistance and lower maintenance costs. Producers accelerate automation in lay-up processes to limit labor shortages and increase throughput. Digital quality checks and AI-supported defect detection reduce scrap rates and strengthen reliability metrics across high-volume parts.
Regulatory actions influence vessel designs across all major regions. Emissions rules under IMO frameworks push builders toward lighter structures. Noise and vibration standards raise demand for composite components with stronger damping properties. Trade rules and import duties add cost pressure in some markets, which encourages investment in regionalized supply chains. North America posts steady growth near 6% per year as coastal enforcement fleets and recreational segments expand. Asia Pacific remains the strongest investment hotspot, capturing near 42% of global demand by 2034, driven by rising leisure craft production in China and South Korea and continued naval procurement in India.
Risk profiles include resin price swings, energy-intensive production stages, and certification challenges for large composite structures. Even with these constraints, composite penetration rises across high-speed craft, ferries, and specialty vessels. Strategic investments in automated molding, digital simulation for structural validation, and integrated recycling systems position leading suppliers to secure long-term share as global fleet needs shift toward lighter and more efficient architectures.
Key Takeaways
Market Growth: The marine composites market reaches USD 5.3 billion in 2024 and moves toward USD 9.3 billion by 2034. The market posts a CAGR of 5.8 percent as builders shift toward lighter and corrosion-resistant structures.
Composite Type: Polymer Matrix Composites hold 38.1 percent share in 2023. Their strength, durability, and resistance to harsh marine conditions sustain their lead across hulls, decks, and superstructures.
Resin Type: Epoxy resin accounts for 36.5 percent share. Its strong adhesion and structural reliability make it the preferred option for high-load areas across performance boats and commercial vessels.
Vessel Type: Cruise ships use the largest volume of marine composites at 34.5 percent share. Shipyards adopt composite panels and structural parts to limit vessel weight and support fuel savings across large fleets.
Driver: Demand for high-speed boats, yachts, and performance craft rises across major coastal regions. Builders reduce component weight and strengthen reliability, which lowers maintenance expenses across the vessel lifecycle.
Restraint: High up-front production cost limits adoption across small and mid-size yards. Repair and recyclability concerns slow the transition toward composite-intensive designs in some regulated markets.
Opportunity: New material systems that blend composite strength with renewable inputs open a path to higher sustainability ratings. Producers targeting epoxy alternatives and bio-resin blends position themselves for faster adoption in performance boats and coastal patrol vessels.
Trend: Automation in resin infusion and filament winding strengthens throughput and limits labor shortages. Owens Corning, Toray Industries, and SGL Group expand R&D to advance fiber reinforcement, improve resin compatibility, and reduce total production cost.
Regional Analysis: Asia Pacific leads with 42.6 percent share in 2023, supported by strong recreational boat production in China and South Korea. Europe and North America follow with steady demand from commercial fleets, naval upgrades, and expanding yacht manufacturing.
Type Analysis
The marine composites market continues to shift toward Polymer Matrix Composites in 2025. These materials hold the largest share due to their balance of structural strength, corrosion resistance, and cost control. You see strong uptake across hulls, decks, and internal structures as builders look for lighter components that support fuel efficiency targets. PMCs remain easier to process than metal or ceramic systems, which helps yards maintain predictable production schedules. Glass fiber stays the dominant reinforcement, accounting for more than half of PMC demand, while polyester resin gains traction because of its price advantage over epoxy and vinyl ester systems.
Ceramic Matrix Composites show the fastest growth outlook through 2030. Their stiffness, heat tolerance, and chemical resistance support broader adoption in performance vessels and specialty components. CMC held more than 30 percent share earlier in the decade and now expands as manufacturers qualify these materials for larger structures. Metal Matrix Composites continue to serve niche applications where higher temperature thresholds are required, though cost pressure limits their scale.
The overall type landscape reflects a clear push toward lighter builds and lower lifecycle costs. PMCs continue to anchor most volume due to their manufacturability and cost structure. CMC growth adds momentum in premium and high-load applications, giving producers a wider range of material options as vessel designs evolve.
Application Analysis
Marine composites gain stronger adoption in hulls, pavers, retaining walls, and structural elements that need corrosion resistance and extended service life. Pavers account for the largest application share as ports and marinas replace concrete blocks with composite units that resist saltwater exposure and require limited maintenance. Retaining walls follow similar adoption patterns as coastal infrastructure projects rise across Asia Pacific and North America.
Applications tied to vessel structures show steady expansion. Composites reduce weight in load-bearing areas and improve handling across fast craft and commercial fleets. Builders apply composite panels in decks, bulkheads, and exterior structures to limit corrosion and strengthen fatigue performance. These gains help you lower operating cost per vessel and meet tightening efficiency targets.
The application mix shifts further toward integrated composite systems by 2030. As resin infusion and automated lay-up methods improve, builders increase the share of composite components in both newbuilds and refurbishments.
End-Use Analysis
Residential and recreational segments continue to drive large portions of composite demand. Growth in personal watercraft and small leisure boats strengthens PMC consumption across hulls, masts, and interior structures. You see stronger activity in coastal markets with rising household spending and wider access to marinas.
Commercial buildings, ports, and marine terminals rely on composites to extend the lifespan of infrastructure exposed to saltwater and high humidity. These facilities adopt composite beams, panels, and structural wraps to reduce maintenance frequency and reinforce aging assets. Industrial end users invest in composites for chemical resistance and predictable performance in harsh environments, supporting steady demand across processing plants located near coastal zones.
Across all end-use sectors, the shift toward lightweight, corrosion-resistant materials accelerates as operators aim to extend service intervals and improve durability.
Regional Analysis
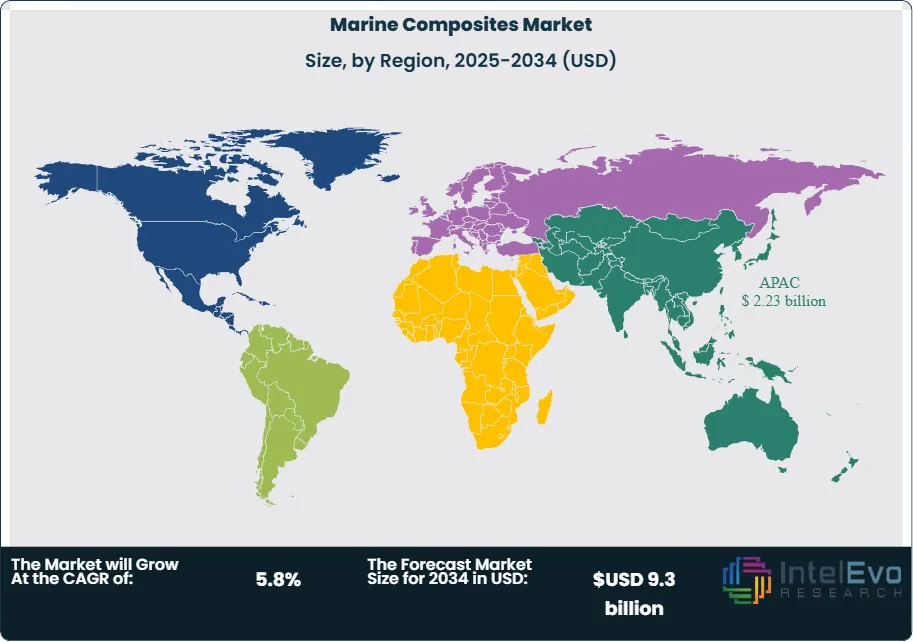
Asia Pacific remains the largest regional market and accounts for more than 42 percent of global revenue in 2025. China, India, and South Korea continue to expand recreational boating access and marina development, which supports stronger demand for composite-intensive hulls and structural components. Shipyards across the region add new capacity to meet rising export orders for small and mid-size vessels.
Europe holds the second position with steady growth near 4 percent CAGR through the forecast period. The region’s shipbuilding base excels in complex vessels, submarines, and technical projects that rely heavily on composites. High manufacturing standards and strong regulatory requirements push builders to adopt materials that enhance structural reliability and reduce long-term cost.
North America follows as a mature but stable market. Spending on powerboats and high-performance craft remains strong due to high income levels and extensive coastal recreation. The region approaches USD 674 million in composite demand by 2025, supported by continued adoption in leisure vessels, refits, and coastal infrastructure upgrades.
By Composites, (Ceramic Matrix Composites, Metal Matrix Composites, Polymer Matrix Composites, Polymer Matrix Composites by Fabric Type, Polymer Matrix Composites by Resin Type), Resin Type, (Epoxy, Polyster, Other Resin Types), By Vessel Type, (Power Boats, Racing Boats, Yachts, Catamarans, Others, Sailboats, Cruise Ships, Other Vessel Types)
Research Methodology
Primary Research- 100 Interviews of Stakeholders
Secondary Research
Desk Research
Regional scope
North America (United States, Canada, Mexico)
Latin America (Brazil, Argentina, Columbia)
East Asia And Pacific (China, Japan, South Korea, Australia, Cambodia, Fiji, Indonesia)
Sea And South Asia (India, Singapore, Thailand, Taiwan, Malaysia)
Eastern Europe (Poland, Russia, Czech Republic, Romania)
Western Europe (Germany, U.K., France, Spain, Itlay)
Middle East & Africa (GCC Countries, Egypt, Nigeria, South Africa, Israel)
Competitive Landscape
Hyosung, Gurit Holding, Toray Industries Inc, 3A Composites, SGL Group, Teijin Limited, Owens Corning, Mitsubishi Rayon Co, Hexcel Corporation, Cytec Industries, E. I. Du Pont Nemours & Co, Others
Customization Scope
Customization for segments, region/country-level will be provided. Moreover, additional customization can be done based on the requirements.
Pricing and Purchase Options
Avail customized purchase options to meet your exact research needs. We have three licenses to opt for: Single User License, Multi-User License (Up to 5 Users), Corporate Use License (Unlimited User and Printable PDF).
TABLE OF CONTENTS
1. EXECUTIVE SUMMARY
1.1. MARKET SNAPSHOT
1.2. KEY FINDINGS & INSIGHTS
1.3. ANALYST RECOMMENDATIONS
1.4. FUTURE OUTLOOK
2. RESEARCH METHODOLOGY
2.1. MARKET DEFINITION & SCOPE
2.2. RESEARCH OBJECTIVES: PRIMARY & SECONDARY DATA SOURCES
2.3. DATA COLLECTION SOURCES
2.3.1. COVERAGE OF 100+ PRIMARY RESEARCH/CONSULTATION CALLS WITH INDUSTRY STAKEHOLDERS
FIGURE 17 NORTH AMERICA MARINE COMPOSITES CURRENT AND FUTURE TYPE ANALYSIS, 2025–2034, (USD MILLION)
FIGURE 18 NORTH AMERICA MARINE COMPOSITES CURRENT AND FUTURE END USER ANALYSIS, 2025–2034, (USD MILLION)
FIGURE 19 MARKET SHARE BY COUNTRY
FIGURE 20 LATIN AMERICA MARINE COMPOSITES CURRENT AND FUTURE TYPE ANALYSIS, 2025–2034, (USD MILLION)
FIGURE 21 LATIN AMERICA MARINE COMPOSITES CURRENT AND FUTURE END USER ANALYSIS, 2025–2034, (USD MILLION)
FIGURE 22 MARKET SHARE BY COUNTRY
FIGURE 23 EASTERN EUROPE MARINE COMPOSITES CURRENT AND FUTURE TYPE ANALYSIS, 2025–2034, (USD MILLION)
FIGURE 24 EASTERN EUROPE MARINE COMPOSITES CURRENT AND FUTURE END USER ANALYSIS, 2025–2034, (USD MILLION)
FIGURE 25 MARKET SHARE BY COUNTRY
FIGURE 26 WESTERN EUROPE MARINE COMPOSITES CURRENT AND FUTURE TYPE ANALYSIS, 2025–2034, (USD MILLION)
FIGURE 27 WESTERN EUROPE MARINE COMPOSITES CURRENT AND FUTURE END USER ANALYSIS, 2025–2034, (USD MILLION)
FIGURE 28 MARKET SHARE BY COUNTRY
FIGURE 29 EAST ASIA AND PACIFIC MARINE COMPOSITES CURRENT AND FUTURE TYPE ANALYSIS, 2025–2034, (USD MILLION)
FIGURE 30 EAST ASIA AND PACIFIC MARINE COMPOSITES CURRENT AND FUTURE END USER ANALYSIS, 2025–2034, (USD MILLION)
FIGURE 31 MARKET SHARE BY COUNTRY
FIGURE 32 SEA AND SOUTH ASIA MARINE COMPOSITES CURRENT AND FUTURE TYPE ANALYSIS, 2025–2034, (USD MILLION)
FIGURE 33 SEA AND SOUTH ASIA MARINE COMPOSITES CURRENT AND FUTURE END USER ANALYSIS, 2025–2034, (USD MILLION)
FIGURE 34 MARKET SHARE BY COUNTRY
FIGURE 35 MIDDLE EAST AND AFRICA MARINE COMPOSITES CURRENT AND FUTURE TYPE ANALYSIS, 2025–2034, (USD MILLION)
FIGURE 36 MIDDLE EAST AND AFRICA MARINE COMPOSITES CURRENT AND FUTURE END USER ANALYSIS, 2025–2034, (USD MILLION)
FIGURE 37 NORTH AMERICA MARINE COMPOSITES CURRENT AND FUTURE MARKET VOLUME SHARE REGIONAL ANALYSIS, 2025–2034, (USD MILLION)
FIGURE 38 U.S. MARINE COMPOSITES CURRENT AND FUTURE TYPE ANALYSIS, 2025–2034, (USD MILLION)
FIGURE 39 U.S. MARINE COMPOSITES CURRENT AND FUTURE END USER ANALYSIS, 2025–2034, (USD MILLION)
FIGURE 40 CANADA MARINE COMPOSITES CURRENT AND FUTURE TYPE ANALYSIS, 2025–2034, (USD MILLION)
FIGURE 41 CANADA MARINE COMPOSITES CURRENT AND FUTURE END USER ANALYSIS, 2025–2034, (USD MILLION)
FIGURE 42 LATIN AMERICA MARINE COMPOSITES CURRENT AND FUTURE MARKET VOLUME SHARE REGIONAL ANALYSIS, 2025–2034, (USD MILLION)
FIGURE 43 MEXICO MARINE COMPOSITES CURRENT AND FUTURE TYPE ANALYSIS, 2025–2034, (USD MILLION)
FIGURE 44 MEXICO MARINE COMPOSITES CURRENT AND FUTURE END USER ANALYSIS, 2025–2034, (USD MILLION)
FIGURE 45 BRAZIL MARINE COMPOSITES CURRENT AND FUTURE TYPE ANALYSIS, 2025–2034, (USD MILLION)
FIGURE 46 BRAZIL MARINE COMPOSITES CURRENT AND FUTURE END USER ANALYSIS, 2025–2034, (USD MILLION)
FIGURE 47 ARGENTINA MARINE COMPOSITES CURRENT AND FUTURE TYPE ANALYSIS, 2025–2034, (USD MILLION)
FIGURE 48 ARGENTINA MARINE COMPOSITES CURRENT AND FUTURE END USER ANALYSIS, 2025–2034, (USD MILLION)
FIGURE 49 COLUMBIA MARINE COMPOSITES CURRENT AND FUTURE TYPE ANALYSIS, 2025–2034, (USD MILLION)
FIGURE 50 COLUMBIA MARINE COMPOSITES CURRENT AND FUTURE END USER ANALYSIS, 2025–2034, (USD MILLION)
FIGURE 51 REST OF LATIN AMERICA MARINE COMPOSITES CURRENT AND FUTURE TYPE ANALYSIS, 2025–2034, (USD MILLION)
FIGURE 52 REST OF LATIN AMERICA MARINE COMPOSITES CURRENT AND FUTURE END USER ANALYSIS, 2025–2034, (USD MILLION)
FIGURE 53 EASTERN EUROPE MARINE COMPOSITES CURRENT AND FUTURE MARKET VOLUME SHARE REGIONAL ANALYSIS, 2025–2034, (USD MILLION)
FIGURE 54 POLAND MARINE COMPOSITES CURRENT AND FUTURE TYPE ANALYSIS, 2025–2034, (USD MILLION)
FIGURE 55 POLAND MARINE COMPOSITES CURRENT AND FUTURE END USER ANALYSIS, 2025–2034, (USD MILLION)
FIGURE 56 RUSSIA MARINE COMPOSITES CURRENT AND FUTURE TYPE ANALYSIS, 2025–2034, (USD MILLION)
FIGURE 57 RUSSIA MARINE COMPOSITES CURRENT AND FUTURE END USER ANALYSIS, 2025–2034, (USD MILLION)
FIGURE 58 CZECH REPUBLIC MARINE COMPOSITES CURRENT AND FUTURE TYPE ANALYSIS, 2025–2034, (USD MILLION)
FIGURE 59 CZECH REPUBLIC MARINE COMPOSITES CURRENT AND FUTURE END USER ANALYSIS, 2025–2034, (USD MILLION)
FIGURE 60 ROMANIA MARINE COMPOSITES CURRENT AND FUTURE TYPE ANALYSIS, 2025–2034, (USD MILLION)
FIGURE 61 ROMANIA MARINE COMPOSITES CURRENT AND FUTURE END USER ANALYSIS, 2025–2034, (USD MILLION)
FIGURE 62 REST OF EASTERN EUROPE MARINE COMPOSITES CURRENT AND FUTURE TYPE ANALYSIS, 2025–2034, (USD MILLION)
FIGURE 63 REST OF EASTERN EUROPE MARINE COMPOSITES CURRENT AND FUTURE END USER ANALYSIS, 2025–2034, (USD MILLION)
FIGURE 64 WESTERN EUROPE MARINE COMPOSITES CURRENT AND FUTURE MARKET VOLUME SHARE REGIONAL ANALYSIS, 2025–2034, (USD MILLION)
FIGURE 65 GERMANY MARINE COMPOSITES CURRENT AND FUTURE TYPE ANALYSIS, 2025–2034, (USD MILLION)
FIGURE 66 GERMANY MARINE COMPOSITES CURRENT AND FUTURE END USER ANALYSIS, 2025–2034, (USD MILLION)
FIGURE 67 FRANCE MARINE COMPOSITES CURRENT AND FUTURE TYPE ANALYSIS, 2025–2034, (USD MILLION)
FIGURE 68 FRANCE MARINE COMPOSITES CURRENT AND FUTURE END USER ANALYSIS, 2025–2034, (USD MILLION)
FIGURE 69 UK MARINE COMPOSITES CURRENT AND FUTURE TYPE ANALYSIS, 2025–2034, (USD MILLION)
FIGURE 70 UK MARINE COMPOSITES CURRENT AND FUTURE END USER ANALYSIS, 2025–2034, (USD MILLION)
FIGURE 71 SPAIN MARINE COMPOSITES CURRENT AND FUTURE TYPE ANALYSIS, 2025–2034, (USD MILLION)
FIGURE 72 SPAIN MARINE COMPOSITES CURRENT AND FUTURE END USER ANALYSIS, 2025–2034, (USD MILLION)
FIGURE 73 ITALY MARINE COMPOSITES CURRENT AND FUTURE TYPE ANALYSIS, 2025–2034, (USD MILLION)
FIGURE 74 ITALY MARINE COMPOSITES CURRENT AND FUTURE END USER ANALYSIS, 2025–2034, (USD MILLION)
FIGURE 75 REST OF WESTERN EUROPE MARINE COMPOSITES CURRENT AND FUTURE TYPE ANALYSIS, 2025–2034, (USD MILLION)
FIGURE 76 REST OF WESTERN EUROPE MARINE COMPOSITES CURRENT AND FUTURE END USER ANALYSIS, 2025–2034, (USD MILLION)
FIGURE 77 EAST ASIA AND PACIFIC MARINE COMPOSITES CURRENT AND FUTURE MARKET VOLUME SHARE REGIONAL ANALYSIS, 2025–2034, (USD MILLION)
FIGURE 78 CHINA MARINE COMPOSITES CURRENT AND FUTURE TYPE ANALYSIS, 2025–2034, (USD MILLION)
FIGURE 79 CHINA MARINE COMPOSITES CURRENT AND FUTURE END USER ANALYSIS, 2025–2034, (USD MILLION)
FIGURE 80 JAPAN MARINE COMPOSITES CURRENT AND FUTURE TYPE ANALYSIS, 2025–2034, (USD MILLION)
FIGURE 81 JAPAN MARINE COMPOSITES CURRENT AND FUTURE END USER ANALYSIS, 2025–2034, (USD MILLION)
FIGURE 82 AUSTRALIA MARINE COMPOSITES CURRENT AND FUTURE TYPE ANALYSIS, 2025–2034, (USD MILLION)
FIGURE 83 AUSTRALIA MARINE COMPOSITES CURRENT AND FUTURE END USER ANALYSIS, 2025–2034, (USD MILLION)
FIGURE 84 CAMBODIA MARINE COMPOSITES CURRENT AND FUTURE TYPE ANALYSIS, 2025–2034, (USD MILLION)
FIGURE 85 CAMBODIA MARINE COMPOSITES CURRENT AND FUTURE END USER ANALYSIS, 2025–2034, (USD MILLION)
FIGURE 86 FIJI MARINE COMPOSITES CURRENT AND FUTURE TYPE ANALYSIS, 2025–2034, (USD MILLION)
FIGURE 87 FIJI MARINE COMPOSITES CURRENT AND FUTURE END USER ANALYSIS, 2025–2034, (USD MILLION)
FIGURE 88 INDONESIA MARINE COMPOSITES CURRENT AND FUTURE TYPE ANALYSIS, 2025–2034, (USD MILLION)
FIGURE 89 INDONESIA MARINE COMPOSITES CURRENT AND FUTURE END USER ANALYSIS, 2025–2034, (USD MILLION)
FIGURE 90 SOUTH KOREA MARINE COMPOSITES CURRENT AND FUTURE TYPE ANALYSIS, 2025–2034, (USD MILLION)
FIGURE 91 SOUTH KOREA MARINE COMPOSITES CURRENT AND FUTURE END USER ANALYSIS, 2025–2034, (USD MILLION)
FIGURE 92 REST OF EAST ASIA AND PACIFIC MARINE COMPOSITES CURRENT AND FUTURE TYPE ANALYSIS, 2025–2034, (USD MILLION)
FIGURE 93 REST OF EAST ASIA AND PACIFIC MARINE COMPOSITES CURRENT AND FUTURE END USER ANALYSIS, 2025–2034, (USD MILLION)
FIGURE 94 SEA AND SOUTH ASIA MARINE COMPOSITES CURRENT AND FUTURE MARKET VOLUME SHARE REGIONAL ANALYSIS, 2025–2034, (USD MILLION)
FIGURE 95 BANGLADESH MARINE COMPOSITES CURRENT AND FUTURE TYPE ANALYSIS, 2025–2034, (USD MILLION)
FIGURE 96 BANGLADESH MARINE COMPOSITES CURRENT AND FUTURE END USER ANALYSIS, 2025–2034, (USD MILLION)
FIGURE 97 NEW ZEALAND MARINE COMPOSITES CURRENT AND FUTURE TYPE ANALYSIS, 2025–2034, (USD MILLION)
FIGURE 98 NEW ZEALAND MARINE COMPOSITES CURRENT AND FUTURE END USER ANALYSIS, 2025–2034, (USD MILLION)
FIGURE 99 INDIA MARINE COMPOSITES CURRENT AND FUTURE TYPE ANALYSIS, 2025–2034, (USD MILLION)
FIGURE 100 INDIA MARINE COMPOSITES CURRENT AND FUTURE END USER ANALYSIS, 2025–2034, (USD MILLION)
FIGURE 101 SINGAPORE MARINE COMPOSITES CURRENT AND FUTURE TYPE ANALYSIS, 2025–2034, (USD MILLION)
FIGURE 102 SINGAPORE MARINE COMPOSITES CURRENT AND FUTURE END USER ANALYSIS, 2025–2034, (USD MILLION)
FIGURE 103 THAILAND MARINE COMPOSITES CURRENT AND FUTURE TYPE ANALYSIS, 2025–2034, (USD MILLION)
FIGURE 104 THAILAND MARINE COMPOSITES CURRENT AND FUTURE END USER ANALYSIS, 2025–2034, (USD MILLION)
FIGURE 105 TAIWAN MARINE COMPOSITES CURRENT AND FUTURE TYPE ANALYSIS, 2025–2034, (USD MILLION)
FIGURE 106 TAIWAN MARINE COMPOSITES CURRENT AND FUTURE END USER ANALYSIS, 2025–2034, (USD MILLION)
FIGURE 107 MALAYSIA MARINE COMPOSITES CURRENT AND FUTURE TYPE ANALYSIS, 2025–2034, (USD MILLION)
FIGURE 108 MALAYSIA MARINE COMPOSITES CURRENT AND FUTURE END USER ANALYSIS, 2025–2034, (USD MILLION)
FIGURE 109 REST OF SEA AND SOUTH ASIA MARINE COMPOSITES CURRENT AND FUTURE TYPE ANALYSIS, 2025–2034, (USD MILLION)
FIGURE 110 REST OF SEA AND SOUTH ASIA MARINE COMPOSITES CURRENT AND FUTURE END USER ANALYSIS, 2025–2034, (USD MILLION)
FIGURE 111 MIDDLE EAST AND AFRICA MARINE COMPOSITES CURRENT AND FUTURE MARKET VOLUME SHARE REGIONAL ANALYSIS, 2025–2034, (USD MILLION)
FIGURE 112 GCC COUNTRIES MARINE COMPOSITES CURRENT AND FUTURE TYPE ANALYSIS, 2025–2034, (USD MILLION)
FIGURE 113 GCC COUNTRIES MARINE COMPOSITES CURRENT AND FUTURE END USER ANALYSIS, 2025–2034, (USD MILLION)
FIGURE 114 SAUDI ARABIA MARINE COMPOSITES CURRENT AND FUTURE TYPE ANALYSIS, 2025–2034, (USD MILLION)
FIGURE 115 SAUDI ARABIA MARINE COMPOSITES CURRENT AND FUTURE END USER ANALYSIS, 2025–2034, (USD MILLION)
FIGURE 116 UAE MARINE COMPOSITES CURRENT AND FUTURE TYPE ANALYSIS, 2025–2034, (USD MILLION)
FIGURE 117 UAE MARINE COMPOSITES CURRENT AND FUTURE END USER ANALYSIS, 2025–2034, (USD MILLION)
FIGURE 118 BAHRAIN MARINE COMPOSITES CURRENT AND FUTURE TYPE ANALYSIS, 2025–2034, (USD MILLION)
FIGURE 119 BAHRAIN MARINE COMPOSITES CURRENT AND FUTURE END USER ANALYSIS, 2025–2034, (USD MILLION)
FIGURE 120 KUWAIT MARINE COMPOSITES CURRENT AND FUTURE TYPE ANALYSIS, 2025–2034, (USD MILLION)
FIGURE 121 KUWAIT MARINE COMPOSITES CURRENT AND FUTURE END USER ANALYSIS, 2025–2034, (USD MILLION)
FIGURE 122 OMAN MARINE COMPOSITES CURRENT AND FUTURE TYPE ANALYSIS, 2025–2034, (USD MILLION)
FIGURE 123 OMAN MARINE COMPOSITES CURRENT AND FUTURE END USER ANALYSIS, 2025–2034, (USD MILLION)
FIGURE 124 QATAR MARINE COMPOSITES CURRENT AND FUTURE TYPE ANALYSIS, 2025–2034, (USD MILLION)
FIGURE 125 QATAR MARINE COMPOSITES CURRENT AND FUTURE END USER ANALYSIS, 2025–2034, (USD MILLION)
FIGURE 126 EGYPT MARINE COMPOSITES CURRENT AND FUTURE TYPE ANALYSIS, 2025–2034, (USD MILLION)
FIGURE 127 EGYPT MARINE COMPOSITES CURRENT AND FUTURE END USER ANALYSIS, 2025–2034, (USD MILLION)
FIGURE 128 NIGERIA MARINE COMPOSITES CURRENT AND FUTURE TYPE ANALYSIS, 2025–2034, (USD MILLION)
FIGURE 129 NIGERIA MARINE COMPOSITES CURRENT AND FUTURE END USER ANALYSIS, 2025–2034, (USD MILLION)
FIGURE 130 SOUTH AFRICA MARINE COMPOSITES CURRENT AND FUTURE TYPE ANALYSIS, 2025–2034, (USD MILLION)
FIGURE 131 SOUTH AFRICA MARINE COMPOSITES CURRENT AND FUTURE END USER ANALYSIS, 2025–2034, (USD MILLION)
FIGURE 132 ISRAEL MARINE COMPOSITES CURRENT AND FUTURE TYPE ANALYSIS, 2025–2034, (USD MILLION)
FIGURE 133 ISRAEL MARINE COMPOSITES CURRENT AND FUTURE END USER ANALYSIS, 2025–2034, (USD MILLION)
FIGURE 134 REST OF MEA MARINE COMPOSITES CURRENT AND FUTURE TYPE ANALYSIS, 2025–2034, (USD MILLION)
FIGURE 135 REST OF MEA MARINE COMPOSITES CURRENT AND FUTURE END USER ANALYSIS, 2025–2034, (USD MILLION)
FIGURE 136 U. S. MARKET SHARE ANALYSIS BY TYPE (2024)
FIGURE 137 U. S. MARKET SHARE ANALYSIS BY END USER (2024)
FIGURE 138 CANADA MARKET SHARE ANALYSIS BY TYPE (2024)
FIGURE 139 CANADA MARKET SHARE ANALYSIS BY END USER (2024)
FIGURE 140 MEXICO MARKET SHARE ANALYSIS BY TYPE (2024)
FIGURE 141 MEXICO MARKET SHARE ANALYSIS BY END USER (2024)
FIGURE 142 CHINA MARKET SHARE ANALYSIS BY TYPE (2024)
FIGURE 143 CHINA MARKET SHARE ANALYSIS BY END USER (2024)
FIGURE 144 JAPAN MARKET SHARE ANALYSIS BY TYPE (2024)
FIGURE 145 JAPAN MARKET SHARE ANALYSIS BY END USER (2024)
FIGURE 146 INDIA MARKET SHARE ANALYSIS BY TYPE (2024)
FIGURE 147 INDIA MARKET SHARE ANALYSIS BY END USER (2024)
FIGURE 148 SOUTH KOREA MARKET SHARE ANALYSIS BY TYPE (2024)
FIGURE 149 SOUTH KOREA MARKET SHARE ANALYSIS BY END USER (2024)
FIGURE 150 SAUDI ARABIA MARKET SHARE ANALYSIS BY TYPE (2024)
FIGURE 151 SAUDI ARABIA MARKET SHARE ANALYSIS BY END USER (2024)
FIGURE 152 UAE MARKET SHARE ANALYSIS BY TYPE (2024)
FIGURE 153 UAE MARKET SHARE ANALYSIS BY END USER (2024)
FIGURE 154 EGYPT MARKET SHARE ANALYSIS BY TYPE (2024)
FIGURE 155 EGYPT MARKET SHARE ANALYSIS BY END USER (2024)
FIGURE 156 NIGERIA MARKET SHARE ANALYSIS BY TYPE (2024)
FIGURE 157 NIGERIA MARKET SHARE ANALYSIS BY END USER (2024)
FIGURE 158 SOUTH AFRICA MARKET SHARE ANALYSIS BY TYPE (2024)
FIGURE 159 SOUTH AFRICA MARKET SHARE ANALYSIS BY END USER (2024)
FIGURE 160 GERMANY MARKET SHARE ANALYSIS BY TYPE (2024)
FIGURE 161 GERMANY MARKET SHARE ANALYSIS BY END USER (2024)
FIGURE 162 FRANCE MARKET SHARE ANALYSIS BY TYPE (2024)
FIGURE 163 FRANCE MARKET SHARE ANALYSIS BY END USER (2024)
FIGURE 164 UK MARKET SHARE ANALYSIS BY TYPE (2024)
FIGURE 165 UK MARKET SHARE ANALYSIS BY END USER (2024)
FIGURE 166 SPAIN MARKET SHARE ANALYSIS BY TYPE (2024)
FIGURE 167 SPAIN MARKET SHARE ANALYSIS BY END USER (2024)
FIGURE 168 ITALY MARKET SHARE ANALYSIS BY TYPE (2024)
FIGURE 169 ITALY MARKET SHARE ANALYSIS BY END USER (2024)
FIGURE 170 BRAZIL MARKET SHARE ANALYSIS BY TYPE (2024)
FIGURE 171 BRAZIL MARKET SHARE ANALYSIS BY END USER (2024)
FIGURE 172 ARGENTINA MARKET SHARE ANALYSIS BY TYPE (2024)
FIGURE 173 ARGENTINA MARKET SHARE ANALYSIS BY END USER (2024)
FIGURE 174 COLUMBIA MARKET SHARE ANALYSIS BY TYPE (2024)
FIGURE 175 COLUMBIA MARKET SHARE ANALYSIS BY END USER (2024)
FIGURE 176 GLOBAL MARINE COMPOSITES CURRENT AND FUTURE MARKET KEY COUNTRY LEVEL ANALYSIS, 2024–2034, (USD MILLION)
FIGURE 177 FINANCIAL OVERVIEW:
Key Player Analysis
Toray Industries Inc: Toray positions itself as a global leader in advanced fibers for marine composites. The company expands its carbon fiber portfolio in 2025 to meet rising demand for lightweight hulls, masts, and propulsion components. You see Toray strengthen its presence in Asia Pacific and Europe through new supply agreements with large shipyards that seek consistent material quality and predictable lead times. The company invests in automated fiber placement and resin infusion tools that reduce waste and support tighter strength tolerances. Toray reports steady mid-single-digit growth in marine composites and adds capacity in Japan and the United States to support future contracts tied to high-speed craft and hybrid propulsion vessels. Its broad material range and strong technical support give shipbuilders a reliable source for both standard and high-modulus fibers.
Cytec Industries: Cytec operates as a strong challenger with specialized resin systems that target structural components in large commercial vessels. The company expands its epoxy and specialty resin lines in 2025 to serve the growing market for composite panels used in decks, bulkheads, and superstructures. You see Cytec invest in R&D focused on faster curing cycles and improved chemical resistance, which lowers production time for yards that build high-volume craft. The company strengthens its position through partnerships with European shipbuilders and composite molding firms. These agreements help Cytec secure stable demand and reinforce its role as a supplier for complex marine structures. Its technology portfolio and long record in aerospace-grade resins give the company a clear differentiator in applications that demand high durability and stable mechanical performance.
SGL Group: SGL Group acts as an innovator in carbon-based materials with a growing presence in marine components for high-speed boats and specialty vessels. The company expands its marine program in 2025 with new intermediate-modulus fibers and carbon fabrics aimed at hulls, masts, and internal reinforcements. You see SGL invest in digital-quality monitoring systems that improve consistency across large composite parts. The company reports increasing adoption in Europe and North America, where builders seek lighter platforms to meet efficiency targets. SGL focuses on long-term supply contracts and joint development programs that integrate its fibers into modular composite systems. Its ability to provide stable supply and custom fiber architectures positions the company as a preferred partner for high-performance vessel projects that require predictable strength and weight profiles.
Маrkеt Кеу Рlауеrѕ
Hyosung
Gurit Holding
Toray Industries Inc
3A Composites
SGL Group
Teijin Limited
Owens Corning
Mitsubishi Rayon Co
Hexcel Corporation
Cytec Industries
E. I. Du Pont Nemours & Co
Others
Driver
Rising Demand for High-Performance and Lightweight Vessels
In 2025, the demand for high-speed boats, performance yachts, and premium recreational vessels is speeding up the use of marine composites. Shipbuilders are increasingly using composite hulls, decks, and superstructures to cut weight by 20 to 30% compared to steel or aluminum options. Lighter designs lead to improved speed, maneuverability, and fuel efficiency, making composites the material of choice for racing craft, patrol vessels, and fast ferries. This advantage in performance is boosting the use of composites in both recreational and commercial marine markets.
Manufacturing Efficiency and Production Scalability
Improvements in automated resin infusion, vacuum-assisted molding, and faster curing technologies are strengthening market growth. In key shipbuilding areas such as Asia Pacific, Europe, and North America, automated composite processing is enabling higher production volumes with better consistency. Shorter build cycles and less dependence on labor help shipyards meet rising order backlogs without significantly increasing costs. These efficiencies make composites a scalable option for builders moving toward faster, lighter, and more cost-effective vessel designs.
Restraint
High Capital Requirements and Material Cost Volatility
High upfront costs remain a major barrier, especially for small and mid-sized shipyards. Prices for carbon fiber and advanced resin systems are still unpredictable. Additionally, large composite structures require specialized tools, climate-controlled environments, and skilled workers. These demands can raise initial project costs by 15 to 25% compared to traditional materials, limiting interest among budget-conscious operators and local builders.
Repair, Recycling, and Regulatory Uncertainty
Concerns about long-term repairability and end-of-life recycling also limit market growth. Composite repairs often need special expertise, making maintenance more complicated for fleet operators who want predictable lifecycle costs. In regulated markets, approval processes and certification times further lengthen project timelines. These uncertainties slow down decision-making and reduce short-term adoption, particularly for operators with tight budgets and compliance risks.
Opportunity
Fuel Efficiency and Emission Reduction Requirements
The growing push for better fuel efficiency offers significant opportunities for marine composites in hulls, decks, propulsion housings, and structural reinforcements. Operators aiming for fuel savings of 8 to 12% in mid-sized fleets increasingly see lightweight composite components as a way to achieve quick returns on investment. Glass and carbon fiber materials provide excellent corrosion resistance, making them ideal for tough marine conditions and long service life.
Sustainability-Aligned Material Innovation
The shift toward hybrid and electric propulsion platforms is creating more opportunities. Lightweight vessel designs are crucial for balancing battery weight and extending operational range. Manufacturers that introduce bio-based resins, recycled fiber inputs, and low-emission composite systems are gaining ground in eco-focused bids. Aligning products with emission regulations and green marine infrastructure projects helps suppliers secure long-term contracts and better prices.
Trend
Automation and Digital Manufacturing Integration
In 2025, automation and digital manufacturing are changing composite production in the marine sector. Robotic fiber placement, automated lay-up systems, and inline quality monitoring are cutting scrap rates by up to 15% while enhancing dimensional accuracy. Simulation tools that predict stress loads and fatigue performance before production enable improved design and lower failure risk, speeding up design and build timelines.
Standardization and Modular Composite Structures
Another key trend is the standardization of composite modules across different vessel types. Suppliers are creating repeatable hull panels, deck sections, and internal structures that can fit various applications. Investments in high-strength fiber systems are supporting larger structural panels with greater load capacity. This move toward modular, data-driven manufacturing strengthens cost control, enhances scalability, and signals a significant change in how marine vessels are designed and constructed using composite materials.
Recent Developments
Dec 2024 – Toray Industries: Announced a USD 120 million expansion of carbon fiber capacity in Japan and the United States, increasing output by roughly 15 percent. This secures upstream supply for high-modulus fibers and supports multi-year contracts with major shipyards in Asia Pacific and Europe.
Feb 2025 – Owens Corning: Formed a strategic partnership with an automation systems provider to deploy robotic lay-up and inline curing at three composite yards; pilot trials cut part cycle times by about 20 percent. This reduces production cost per part and shortens delivery windows, strengthening Owens Corning’s appeal to high-volume builders.
Apr 2025 – SGL Group: Launched a new intermediate-modulus carbon fiber line that delivers near 10 percent higher tensile strength and 12 percent weight savings versus legacy grades; initial orders target racing boats and patrol craft. This product positions SGL to capture premium performance segments and supports longer-term supply agreements with European integrators.
Jul 2025 – Hexcel: Completed acquisition of a specialized composite tooling and molding firm for USD 85 million, adding North American manufacturing capacity and a tooling services business. This expands Hexcel’s end-to-end offering and improves its ability to serve retrofit and small-series programs where rapid tooling is a competitive advantage.
Sep 2025 – Industry Consortium (Toray, DNV, major yards): Launched a composite qualification program to standardize recyclability metrics and certification pathways; program aims to cover roughly 25 percent of newbuild approvals by 2028. This reduces certification uncertainty and lowers a major nontechnical barrier to wider composite adoption in regulated markets.