Global Mattress Market Size, Share & Consumer Lifestyle Analysis By Product Type (Innerspring, Memory Foam, Latex, Hybrid), By Size, By Distribution Channel (Online, Offline), Sleep Health Trends, Regional Demand Patterns, Key Brands & Forecast 2025–2034
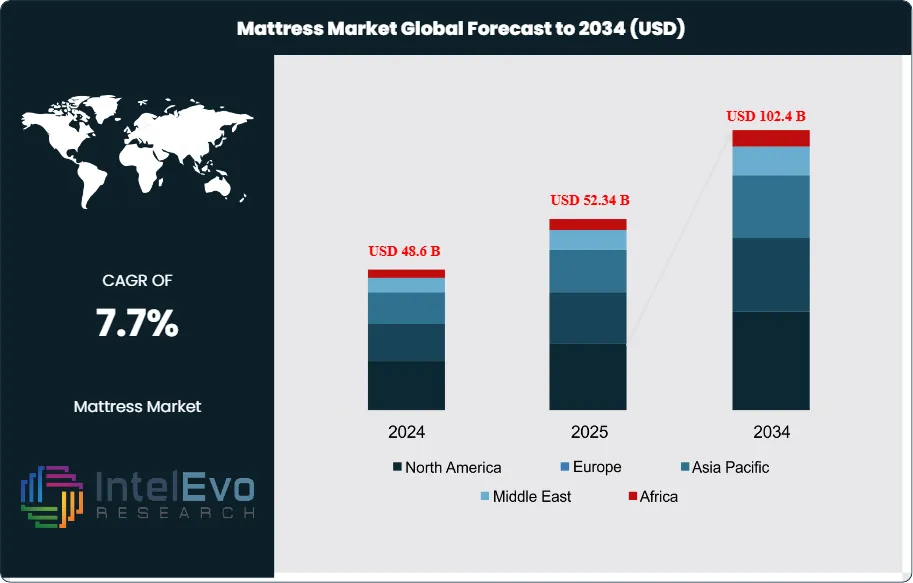
The Mattress Market is estimated at USD 48.6 billion in 2024 and is projected to reach approximately USD 102.4 billion by 2034, registering a CAGR of about 7.7% during 2025–2034. Market growth is being driven by rising consumer focus on sleep health, increasing replacement demand, and rapid expansion of online mattress retail and direct-to-consumer brands. Urbanization, growth in the middle-class population, and premiumization trends—such as hybrid, memory foam, and adjustable mattresses—are further supporting value expansion. In addition, hospitality sector recovery and real estate development in emerging economies are reinforcing long-term demand, positioning the mattress market for sustained, structurally driven growth over the next decade.
The market expanded on the back of rising home spending, steady household formation, and shorter replacement cycles that now range between seven and nine years in key markets. E-commerce reshaped buying behavior. Bed-in-a-box offerings and transparent online comparison lifted penetration to an estimated 25 to 30 percent of unit sales in the United States and Western Europe. Price points remain clear for consumers. The Sleep Foundation cites USD 800 to 2,500 for queen memory foam models and USD 1,200 to 2,000 for hybrids, which draw buyers seeking stronger edge support and temperature control.
Demand ties closely to sleep health. ResMed’s 2023 Global Sleep Survey reports 8 in 10 adults across 12 countries with disrupted sleep symptoms. Mexico and South Korea saw more than 85 percent of respondents report poor sleep quality. Japan reported 60 percent. The economic cost is material. Insufficient sleep is linked to over USD 411 billion in annual losses in the United States. You can position sleep-enhancing features as both wellness and productivity tools for households and employers. Replacement demand remains stable; new household formation and hospitality capex add cyclical upside.
Supply-side risks persist. Polyurethane foam, steel coil, and latex prices affect margins. Freight costs and return logistics pressure online models. Compliance is non-negotiable. U.S. flammability standards such as 16 CFR Part 1633 and EU chemical rules under REACH raise testing and sourcing requirements. Sustainability scrutiny is rising; take-back schemes and recycled content claims face tighter verification.
Technology is reshaping products and operations. Smart mattresses with embedded sensors, adjustable firmness, and app-based sleep tracking are moving from niche to mainstream. Cooling foams, phase-change materials, and zoned coil designs address heat and pressure pain points. Automated roll-packing, CNC foam cutting, and robotics improve throughput and unit costs. AI-driven fit tools guide buyers to the right firmness, which can lower returns.
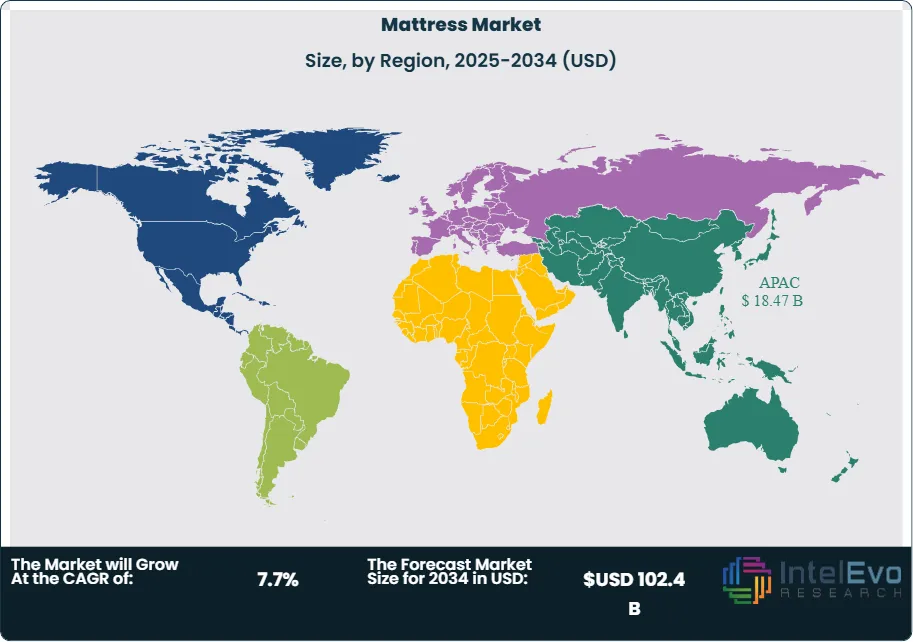
Regional patterns are clear. North America leads on revenue with a premium mix. Asia Pacific will post the fastest growth, driven by urban middle-class households in China, India, and Southeast Asia. Europe shows steady replacement-led demand. Latin America, led by Mexico, offers online growth potential. The Middle East benefits from a healthy hotel pipeline. Watch premium hybrids, cooling systems, smart features, and omnichannel models in the United States, China, and India.
Key Takeaways
Market Growth: The mattress market was valued at USD 48.6 billion in 2024 and is set to reach USD 102.4 billion by 2034, reflecting a 7.7% CAGR on the back of resilient replacement demand and rising spend on sleep quality. The growth outlook benefits from broad consumer focus on sleep health and better product transparency across channels.
Segment Dominance: Foam leads product type with 45% share in 2023 as consumers prioritize contouring support and motion isolation. Price clarity reinforces adoption; a queen memory foam typically ranges from USD 800 to 2,500, while hybrids run USD 1,200 to 2,000.
Segment Dominance: Offline distribution commanded 68% of sales in 2023 because many buyers still prefer in-store testing before purchase. Online continues to expand but remains a minority channel relative to brick-and-mortar points of sale.
Driver: The sleep health gap fuels demand; 8 in 10 adults across 12 countries report at least one symptom of disrupted sleep, indicating persistent unmet need. Insufficient sleep costs the U.S. economy about USD 411 billion annually, sharpening the value case for sleep-enhancing products in homes and hospitality.
Restraint: Compliance requirements add testing, documentation, and time-to-market friction, with all mattress sets needing to meet the U.S. open-flame standard 16 CFR Part 1633 before sale. Federal guidance specifies flammability performance and testing protocols, increasing regulatory overhead for manufacturers and importers.
Opportunity: Asia Pacific offers the strongest upside, already at 38% share and USD 16.68 billion in 2023, with structural tailwinds from urbanization and middle-class expansion. Regional revenue is projected to grow at about 6.9% CAGR through 2030, with India expected to post the highest country-level growth.
Trend: Hybrids are gaining traction as buyers seek cooling, stronger edge support, and balanced responsiveness at mid-tier price points of roughly USD 1,200 to 2,000 for a queen. Sustainability is rising in purchase criteria, with brands expanding eco-friendly lines and certifications, signaling a broader shift to safer and lower-impact materials.
Regional Analysis: Asia Pacific leads on unit volumes and growth, while North America remains a high-value market anchored by established brands such as Tempur Sealy and Serta Simmons. Europe shows steady replacement-led demand, and APAC outpaces other regions on CAGR, positioning China and India as priority investment corridors.
Type Analysis
Foam remains the largest product class, accounting for about 45% of global sales in 2024 as buyers favor contouring support and motion isolation in memory foam and related formulations. Hybrid models continue to gain share as consumers seek stronger edge support and better temperature control at mid-tier price points of roughly USD 1,200 to 2,000 for a queen, compared with USD 800 to 2,500 for memory foam alternatives. Innerspring retains a sizable installed base, but its relative share trails foam as preferences shift toward pressure relief and quieter construction in mature and developing markets alike.
You should expect the hybrid mix to rise further as brands refine coil zoning, cooling foams, and breathable covers to address heat and spinal alignment concerns at competitive price bands. Product development focuses on clear performance attributes that translate in-store and online, including firmness matching and motion transfer tests that reduce returns and improve satisfaction. The overall type mix will track wellness-led upgrades and replacement cycles, with foam and hybrid models best positioned to capture premium and upper mid-market demand in 2025 and beyond.
Distribution Channel Analysis
Offline retail remains the majority channel as shoppers prefer to test firmness, pressure relief, and edge support before purchase, reinforcing the role of specialty chains and furniture stores in guiding higher-priced decisions. In-store consultations, immediate service, and bundled financing continue to support average selling prices, even as online content shapes pre-visit research and shortlists.
Online penetration keeps rising as direct-to-consumer brands scale trials, free shipping, and simplified assortments that lower decision friction for you. Return rates for boxed beds average about 7% in industry tracking, signaling better fit tools and expectation setting compared with earlier cycles of the category. Transparent pricing and clear comparisons of foam and hybrid constructions improve conversion, while detailed education around temperature regulation and edge performance reduces post-purchase dissatisfaction.
End-Use Analysis
Household purchases account for roughly 78% of demand, supported by health-driven upgrades, shorter replacement cycles, and price transparency across foam and hybrid offerings. Sleep disruption remains prevalent, with 8 in 10 adults reporting at least one symptom of poor sleep, which elevates willingness to invest in comfort and support features that address heat and pressure points. The economic cost of insufficient sleep in the United States alone is estimated at about USD 411 billion annually, underscoring the productivity case for household investments in better sleep surfaces.
Commercial demand is steady, led by hospitality refresh cycles and brand standards that prioritize durability, hygiene, and guest satisfaction metrics in the upper midscale and upscale tiers. Healthcare settings add specialized needs for pressure redistribution and cleanability, which sustains premium specifications and recurring replacements in institutional channels. As travel activity normalizes and renovation pipelines progress, commercial volumes should provide a stable floor under total market growth through the forecast period.
Regional Analysis
Asia Pacific holds the largest share at about 38% in 2024, supported by rising disposable incomes, urban household formation, and broad manufacturing capacity across China, India, and Southeast Asia. The region’s large addressable base and ongoing upgrades in comfort and materials point to sustained gains in 2025 and beyond, with local and global brands expanding foam and hybrid lines for middle-income buyers. E-commerce adoption further widens access in second- and third-tier cities, while modern retail formats lift conversion in major metros.
North America represents roughly one third of global revenue and remains a high-value market anchored by established brands and a robust specialty retail footprint. Product mix skews toward premium foam and hybrids, aided by clear pricing, standardized sizes, and mature logistics for home delivery and returns. Europe continues to contribute meaningful replacement-led demand within a developed retail ecosystem, while producers align materials and testing with safety and quality standards across markets.
Product Type Analysis (Foam Mattresses, Hybrid Mattresses, Innerspring Mattresses, Latex and Specialty Mattresses, Product Mix Evolution and Outlook), Distribution Channel Analysis (Offline Retail (Specialty Stores, Furniture Chains), Online & Direct-to-Consumer Channels, Omnichannel Buying Behavior, Channel-Wise Growth Outlook), End-Use Analysis (Household / Residential, Commercial (Hospitality, Healthcare, Institutional), Replacement vs New Installation Demand)
Research Methodology
Primary Research- 100 Interviews of Stakeholders
Secondary Research
Desk Research
Regional scope
North America (United States, Canada, Mexico)
Latin America (Brazil, Argentina, Columbia)
East Asia And Pacific (China, Japan, South Korea, Australia, Cambodia, Fiji, Indonesia)
Sea And South Asia (India, Singapore, Thailand, Taiwan, Malaysia)
Eastern Europe (Poland, Russia, Czech Republic, Romania)
Western Europe (Germany, U.K., France, Spain, Itlay)
Middle East & Africa (GCC Countries, Egypt, Nigeria, South Africa, Israel)
Competitive Landscape
Tempur Sealy International, Serta Simmons Bedding, Sleep Number, Kingsdown, Spring Air International, Hilding Anders, Sleepwell, Casper, Purple Innovation, Emma Sleep, Sheela Foam, Derucci
Customization Scope
Customization for segments, region/country-level will be provided. Moreover, additional customization can be done based on the requirements.
Pricing and Purchase Options
Avail customized purchase options to meet your exact research needs. We have three licenses to opt for: Single User License, Multi-User License (Up to 5 Users), Corporate Use License (Unlimited User and Printable PDF).
TABLE OF CONTENTS
1. EXECUTIVE SUMMARY
1.1. MARKET SNAPSHOT
1.2. KEY FINDINGS & INSIGHTS
1.3. ANALYST RECOMMENDATIONS
1.4. FUTURE OUTLOOK
2. RESEARCH METHODOLOGY
2.1. MARKET DEFINITION & SCOPE
2.2. RESEARCH OBJECTIVES: PRIMARY & SECONDARY DATA SOURCES
2.3. DATA COLLECTION SOURCES
2.3.1. COVERAGE OF 100+ PRIMARY RESEARCH/CONSULTATION CALLS WITH INDUSTRY STAKEHOLDERS
FIGURE 17 NORTH AMERICA MATTRESS CURRENT AND FUTURE TYPE ANALYSIS, 2025–2034, (USD MILLION)
FIGURE 18 NORTH AMERICA MATTRESS CURRENT AND FUTURE END USER ANALYSIS, 2025–2034, (USD MILLION)
FIGURE 19 MARKET SHARE BY COUNTRY
FIGURE 20 LATIN AMERICA MATTRESS CURRENT AND FUTURE TYPE ANALYSIS, 2025–2034, (USD MILLION)
FIGURE 21 LATIN AMERICA MATTRESS CURRENT AND FUTURE END USER ANALYSIS, 2025–2034, (USD MILLION)
FIGURE 22 MARKET SHARE BY COUNTRY
FIGURE 23 EASTERN EUROPE MATTRESS CURRENT AND FUTURE TYPE ANALYSIS, 2025–2034, (USD MILLION)
FIGURE 24 EASTERN EUROPE MATTRESS CURRENT AND FUTURE END USER ANALYSIS, 2025–2034, (USD MILLION)
FIGURE 25 MARKET SHARE BY COUNTRY
FIGURE 26 WESTERN EUROPE MATTRESS CURRENT AND FUTURE TYPE ANALYSIS, 2025–2034, (USD MILLION)
FIGURE 27 WESTERN EUROPE MATTRESS CURRENT AND FUTURE END USER ANALYSIS, 2025–2034, (USD MILLION)
FIGURE 28 MARKET SHARE BY COUNTRY
FIGURE 29 EAST ASIA AND PACIFIC MATTRESS CURRENT AND FUTURE TYPE ANALYSIS, 2025–2034, (USD MILLION)
FIGURE 30 EAST ASIA AND PACIFIC MATTRESS CURRENT AND FUTURE END USER ANALYSIS, 2025–2034, (USD MILLION)
FIGURE 31 MARKET SHARE BY COUNTRY
FIGURE 32 SEA AND SOUTH ASIA MATTRESS CURRENT AND FUTURE TYPE ANALYSIS, 2025–2034, (USD MILLION)
FIGURE 33 SEA AND SOUTH ASIA MATTRESS CURRENT AND FUTURE END USER ANALYSIS, 2025–2034, (USD MILLION)
FIGURE 34 MARKET SHARE BY COUNTRY
FIGURE 35 MIDDLE EAST AND AFRICA MATTRESS CURRENT AND FUTURE TYPE ANALYSIS, 2025–2034, (USD MILLION)
FIGURE 36 MIDDLE EAST AND AFRICA MATTRESS CURRENT AND FUTURE END USER ANALYSIS, 2025–2034, (USD MILLION)
FIGURE 37 NORTH AMERICA MATTRESS CURRENT AND FUTURE MARKET VOLUME SHARE REGIONAL ANALYSIS, 2025–2034, (USD MILLION)
FIGURE 38 U.S. MATTRESS CURRENT AND FUTURE TYPE ANALYSIS, 2025–2034, (USD MILLION)
FIGURE 39 U.S. MATTRESS CURRENT AND FUTURE END USER ANALYSIS, 2025–2034, (USD MILLION)
FIGURE 40 CANADA MATTRESS CURRENT AND FUTURE TYPE ANALYSIS, 2025–2034, (USD MILLION)
FIGURE 41 CANADA MATTRESS CURRENT AND FUTURE END USER ANALYSIS, 2025–2034, (USD MILLION)
FIGURE 42 LATIN AMERICA MATTRESS CURRENT AND FUTURE MARKET VOLUME SHARE REGIONAL ANALYSIS, 2025–2034, (USD MILLION)
FIGURE 43 MEXICO MATTRESS CURRENT AND FUTURE TYPE ANALYSIS, 2025–2034, (USD MILLION)
FIGURE 44 MEXICO MATTRESS CURRENT AND FUTURE END USER ANALYSIS, 2025–2034, (USD MILLION)
FIGURE 45 BRAZIL MATTRESS CURRENT AND FUTURE TYPE ANALYSIS, 2025–2034, (USD MILLION)
FIGURE 46 BRAZIL MATTRESS CURRENT AND FUTURE END USER ANALYSIS, 2025–2034, (USD MILLION)
FIGURE 47 ARGENTINA MATTRESS CURRENT AND FUTURE TYPE ANALYSIS, 2025–2034, (USD MILLION)
FIGURE 48 ARGENTINA MATTRESS CURRENT AND FUTURE END USER ANALYSIS, 2025–2034, (USD MILLION)
FIGURE 49 COLUMBIA MATTRESS CURRENT AND FUTURE TYPE ANALYSIS, 2025–2034, (USD MILLION)
FIGURE 50 COLUMBIA MATTRESS CURRENT AND FUTURE END USER ANALYSIS, 2025–2034, (USD MILLION)
FIGURE 51 REST OF LATIN AMERICA MATTRESS CURRENT AND FUTURE TYPE ANALYSIS, 2025–2034, (USD MILLION)
FIGURE 52 REST OF LATIN AMERICA MATTRESS CURRENT AND FUTURE END USER ANALYSIS, 2025–2034, (USD MILLION)
FIGURE 53 EASTERN EUROPE MATTRESS CURRENT AND FUTURE MARKET VOLUME SHARE REGIONAL ANALYSIS, 2025–2034, (USD MILLION)
FIGURE 54 POLAND MATTRESS CURRENT AND FUTURE TYPE ANALYSIS, 2025–2034, (USD MILLION)
FIGURE 55 POLAND MATTRESS CURRENT AND FUTURE END USER ANALYSIS, 2025–2034, (USD MILLION)
FIGURE 56 RUSSIA MATTRESS CURRENT AND FUTURE TYPE ANALYSIS, 2025–2034, (USD MILLION)
FIGURE 57 RUSSIA MATTRESS CURRENT AND FUTURE END USER ANALYSIS, 2025–2034, (USD MILLION)
FIGURE 58 CZECH REPUBLIC MATTRESS CURRENT AND FUTURE TYPE ANALYSIS, 2025–2034, (USD MILLION)
FIGURE 59 CZECH REPUBLIC MATTRESS CURRENT AND FUTURE END USER ANALYSIS, 2025–2034, (USD MILLION)
FIGURE 60 ROMANIA MATTRESS CURRENT AND FUTURE TYPE ANALYSIS, 2025–2034, (USD MILLION)
FIGURE 61 ROMANIA MATTRESS CURRENT AND FUTURE END USER ANALYSIS, 2025–2034, (USD MILLION)
FIGURE 62 REST OF EASTERN EUROPE MATTRESS CURRENT AND FUTURE TYPE ANALYSIS, 2025–2034, (USD MILLION)
FIGURE 63 REST OF EASTERN EUROPE MATTRESS CURRENT AND FUTURE END USER ANALYSIS, 2025–2034, (USD MILLION)
FIGURE 64 WESTERN EUROPE MATTRESS CURRENT AND FUTURE MARKET VOLUME SHARE REGIONAL ANALYSIS, 2025–2034, (USD MILLION)
FIGURE 65 GERMANY MATTRESS CURRENT AND FUTURE TYPE ANALYSIS, 2025–2034, (USD MILLION)
FIGURE 66 GERMANY MATTRESS CURRENT AND FUTURE END USER ANALYSIS, 2025–2034, (USD MILLION)
FIGURE 67 FRANCE MATTRESS CURRENT AND FUTURE TYPE ANALYSIS, 2025–2034, (USD MILLION)
FIGURE 68 FRANCE MATTRESS CURRENT AND FUTURE END USER ANALYSIS, 2025–2034, (USD MILLION)
FIGURE 69 UK MATTRESS CURRENT AND FUTURE TYPE ANALYSIS, 2025–2034, (USD MILLION)
FIGURE 70 UK MATTRESS CURRENT AND FUTURE END USER ANALYSIS, 2025–2034, (USD MILLION)
FIGURE 71 SPAIN MATTRESS CURRENT AND FUTURE TYPE ANALYSIS, 2025–2034, (USD MILLION)
FIGURE 72 SPAIN MATTRESS CURRENT AND FUTURE END USER ANALYSIS, 2025–2034, (USD MILLION)
FIGURE 73 ITALY MATTRESS CURRENT AND FUTURE TYPE ANALYSIS, 2025–2034, (USD MILLION)
FIGURE 74 ITALY MATTRESS CURRENT AND FUTURE END USER ANALYSIS, 2025–2034, (USD MILLION)
FIGURE 75 REST OF WESTERN EUROPE MATTRESS CURRENT AND FUTURE TYPE ANALYSIS, 2025–2034, (USD MILLION)
FIGURE 76 REST OF WESTERN EUROPE MATTRESS CURRENT AND FUTURE END USER ANALYSIS, 2025–2034, (USD MILLION)
FIGURE 77 EAST ASIA AND PACIFIC MATTRESS CURRENT AND FUTURE MARKET VOLUME SHARE REGIONAL ANALYSIS, 2025–2034, (USD MILLION)
FIGURE 78 CHINA MATTRESS CURRENT AND FUTURE TYPE ANALYSIS, 2025–2034, (USD MILLION)
FIGURE 79 CHINA MATTRESS CURRENT AND FUTURE END USER ANALYSIS, 2025–2034, (USD MILLION)
FIGURE 80 JAPAN MATTRESS CURRENT AND FUTURE TYPE ANALYSIS, 2025–2034, (USD MILLION)
FIGURE 81 JAPAN MATTRESS CURRENT AND FUTURE END USER ANALYSIS, 2025–2034, (USD MILLION)
FIGURE 82 AUSTRALIA MATTRESS CURRENT AND FUTURE TYPE ANALYSIS, 2025–2034, (USD MILLION)
FIGURE 83 AUSTRALIA MATTRESS CURRENT AND FUTURE END USER ANALYSIS, 2025–2034, (USD MILLION)
FIGURE 84 CAMBODIA MATTRESS CURRENT AND FUTURE TYPE ANALYSIS, 2025–2034, (USD MILLION)
FIGURE 85 CAMBODIA MATTRESS CURRENT AND FUTURE END USER ANALYSIS, 2025–2034, (USD MILLION)
FIGURE 86 FIJI MATTRESS CURRENT AND FUTURE TYPE ANALYSIS, 2025–2034, (USD MILLION)
FIGURE 87 FIJI MATTRESS CURRENT AND FUTURE END USER ANALYSIS, 2025–2034, (USD MILLION)
FIGURE 88 INDONESIA MATTRESS CURRENT AND FUTURE TYPE ANALYSIS, 2025–2034, (USD MILLION)
FIGURE 89 INDONESIA MATTRESS CURRENT AND FUTURE END USER ANALYSIS, 2025–2034, (USD MILLION)
FIGURE 90 SOUTH KOREA MATTRESS CURRENT AND FUTURE TYPE ANALYSIS, 2025–2034, (USD MILLION)
FIGURE 91 SOUTH KOREA MATTRESS CURRENT AND FUTURE END USER ANALYSIS, 2025–2034, (USD MILLION)
FIGURE 92 REST OF EAST ASIA AND PACIFIC MATTRESS CURRENT AND FUTURE TYPE ANALYSIS, 2025–2034, (USD MILLION)
FIGURE 93 REST OF EAST ASIA AND PACIFIC MATTRESS CURRENT AND FUTURE END USER ANALYSIS, 2025–2034, (USD MILLION)
FIGURE 94 SEA AND SOUTH ASIA MATTRESS CURRENT AND FUTURE MARKET VOLUME SHARE REGIONAL ANALYSIS, 2025–2034, (USD MILLION)
FIGURE 95 BANGLADESH MATTRESS CURRENT AND FUTURE TYPE ANALYSIS, 2025–2034, (USD MILLION)
FIGURE 96 BANGLADESH MATTRESS CURRENT AND FUTURE END USER ANALYSIS, 2025–2034, (USD MILLION)
FIGURE 97 NEW ZEALAND MATTRESS CURRENT AND FUTURE TYPE ANALYSIS, 2025–2034, (USD MILLION)
FIGURE 98 NEW ZEALAND MATTRESS CURRENT AND FUTURE END USER ANALYSIS, 2025–2034, (USD MILLION)
FIGURE 99 INDIA MATTRESS CURRENT AND FUTURE TYPE ANALYSIS, 2025–2034, (USD MILLION)
FIGURE 100 INDIA MATTRESS CURRENT AND FUTURE END USER ANALYSIS, 2025–2034, (USD MILLION)
FIGURE 101 SINGAPORE MATTRESS CURRENT AND FUTURE TYPE ANALYSIS, 2025–2034, (USD MILLION)
FIGURE 102 SINGAPORE MATTRESS CURRENT AND FUTURE END USER ANALYSIS, 2025–2034, (USD MILLION)
FIGURE 103 THAILAND MATTRESS CURRENT AND FUTURE TYPE ANALYSIS, 2025–2034, (USD MILLION)
FIGURE 104 THAILAND MATTRESS CURRENT AND FUTURE END USER ANALYSIS, 2025–2034, (USD MILLION)
FIGURE 105 TAIWAN MATTRESS CURRENT AND FUTURE TYPE ANALYSIS, 2025–2034, (USD MILLION)
FIGURE 106 TAIWAN MATTRESS CURRENT AND FUTURE END USER ANALYSIS, 2025–2034, (USD MILLION)
FIGURE 107 MALAYSIA MATTRESS CURRENT AND FUTURE TYPE ANALYSIS, 2025–2034, (USD MILLION)
FIGURE 108 MALAYSIA MATTRESS CURRENT AND FUTURE END USER ANALYSIS, 2025–2034, (USD MILLION)
FIGURE 109 REST OF SEA AND SOUTH ASIA MATTRESS CURRENT AND FUTURE TYPE ANALYSIS, 2025–2034, (USD MILLION)
FIGURE 110 REST OF SEA AND SOUTH ASIA MATTRESS CURRENT AND FUTURE END USER ANALYSIS, 2025–2034, (USD MILLION)
FIGURE 111 MIDDLE EAST AND AFRICA MATTRESS CURRENT AND FUTURE MARKET VOLUME SHARE REGIONAL ANALYSIS, 2025–2034, (USD MILLION)
FIGURE 112 GCC COUNTRIES MATTRESS CURRENT AND FUTURE TYPE ANALYSIS, 2025–2034, (USD MILLION)
FIGURE 113 GCC COUNTRIES MATTRESS CURRENT AND FUTURE END USER ANALYSIS, 2025–2034, (USD MILLION)
FIGURE 114 SAUDI ARABIA MATTRESS CURRENT AND FUTURE TYPE ANALYSIS, 2025–2034, (USD MILLION)
FIGURE 115 SAUDI ARABIA MATTRESS CURRENT AND FUTURE END USER ANALYSIS, 2025–2034, (USD MILLION)
FIGURE 116 UAE MATTRESS CURRENT AND FUTURE TYPE ANALYSIS, 2025–2034, (USD MILLION)
FIGURE 117 UAE MATTRESS CURRENT AND FUTURE END USER ANALYSIS, 2025–2034, (USD MILLION)
FIGURE 118 BAHRAIN MATTRESS CURRENT AND FUTURE TYPE ANALYSIS, 2025–2034, (USD MILLION)
FIGURE 119 BAHRAIN MATTRESS CURRENT AND FUTURE END USER ANALYSIS, 2025–2034, (USD MILLION)
FIGURE 120 KUWAIT MATTRESS CURRENT AND FUTURE TYPE ANALYSIS, 2025–2034, (USD MILLION)
FIGURE 121 KUWAIT MATTRESS CURRENT AND FUTURE END USER ANALYSIS, 2025–2034, (USD MILLION)
FIGURE 122 OMAN MATTRESS CURRENT AND FUTURE TYPE ANALYSIS, 2025–2034, (USD MILLION)
FIGURE 123 OMAN MATTRESS CURRENT AND FUTURE END USER ANALYSIS, 2025–2034, (USD MILLION)
FIGURE 124 QATAR MATTRESS CURRENT AND FUTURE TYPE ANALYSIS, 2025–2034, (USD MILLION)
FIGURE 125 QATAR MATTRESS CURRENT AND FUTURE END USER ANALYSIS, 2025–2034, (USD MILLION)
FIGURE 126 EGYPT MATTRESS CURRENT AND FUTURE TYPE ANALYSIS, 2025–2034, (USD MILLION)
FIGURE 127 EGYPT MATTRESS CURRENT AND FUTURE END USER ANALYSIS, 2025–2034, (USD MILLION)
FIGURE 128 NIGERIA MATTRESS CURRENT AND FUTURE TYPE ANALYSIS, 2025–2034, (USD MILLION)
FIGURE 129 NIGERIA MATTRESS CURRENT AND FUTURE END USER ANALYSIS, 2025–2034, (USD MILLION)
FIGURE 130 SOUTH AFRICA MATTRESS CURRENT AND FUTURE TYPE ANALYSIS, 2025–2034, (USD MILLION)
FIGURE 131 SOUTH AFRICA MATTRESS CURRENT AND FUTURE END USER ANALYSIS, 2025–2034, (USD MILLION)
FIGURE 132 ISRAEL MATTRESS CURRENT AND FUTURE TYPE ANALYSIS, 2025–2034, (USD MILLION)
FIGURE 133 ISRAEL MATTRESS CURRENT AND FUTURE END USER ANALYSIS, 2025–2034, (USD MILLION)
FIGURE 134 REST OF MEA MATTRESS CURRENT AND FUTURE TYPE ANALYSIS, 2025–2034, (USD MILLION)
FIGURE 135 REST OF MEA MATTRESS CURRENT AND FUTURE END USER ANALYSIS, 2025–2034, (USD MILLION)
FIGURE 136 U. S. MARKET SHARE ANALYSIS BY TYPE (2024)
FIGURE 137 U. S. MARKET SHARE ANALYSIS BY END USER (2024)
FIGURE 138 CANADA MARKET SHARE ANALYSIS BY TYPE (2024)
FIGURE 139 CANADA MARKET SHARE ANALYSIS BY END USER (2024)
FIGURE 140 MEXICO MARKET SHARE ANALYSIS BY TYPE (2024)
FIGURE 141 MEXICO MARKET SHARE ANALYSIS BY END USER (2024)
FIGURE 142 CHINA MARKET SHARE ANALYSIS BY TYPE (2024)
FIGURE 143 CHINA MARKET SHARE ANALYSIS BY END USER (2024)
FIGURE 144 JAPAN MARKET SHARE ANALYSIS BY TYPE (2024)
FIGURE 145 JAPAN MARKET SHARE ANALYSIS BY END USER (2024)
FIGURE 146 INDIA MARKET SHARE ANALYSIS BY TYPE (2024)
FIGURE 147 INDIA MARKET SHARE ANALYSIS BY END USER (2024)
FIGURE 148 SOUTH KOREA MARKET SHARE ANALYSIS BY TYPE (2024)
FIGURE 149 SOUTH KOREA MARKET SHARE ANALYSIS BY END USER (2024)
FIGURE 150 SAUDI ARABIA MARKET SHARE ANALYSIS BY TYPE (2024)
FIGURE 151 SAUDI ARABIA MARKET SHARE ANALYSIS BY END USER (2024)
FIGURE 152 UAE MARKET SHARE ANALYSIS BY TYPE (2024)
FIGURE 153 UAE MARKET SHARE ANALYSIS BY END USER (2024)
FIGURE 154 EGYPT MARKET SHARE ANALYSIS BY TYPE (2024)
FIGURE 155 EGYPT MARKET SHARE ANALYSIS BY END USER (2024)
FIGURE 156 NIGERIA MARKET SHARE ANALYSIS BY TYPE (2024)
FIGURE 157 NIGERIA MARKET SHARE ANALYSIS BY END USER (2024)
FIGURE 158 SOUTH AFRICA MARKET SHARE ANALYSIS BY TYPE (2024)
FIGURE 159 SOUTH AFRICA MARKET SHARE ANALYSIS BY END USER (2024)
FIGURE 160 GERMANY MARKET SHARE ANALYSIS BY TYPE (2024)
FIGURE 161 GERMANY MARKET SHARE ANALYSIS BY END USER (2024)
FIGURE 162 FRANCE MARKET SHARE ANALYSIS BY TYPE (2024)
FIGURE 163 FRANCE MARKET SHARE ANALYSIS BY END USER (2024)
FIGURE 164 UK MARKET SHARE ANALYSIS BY TYPE (2024)
FIGURE 165 UK MARKET SHARE ANALYSIS BY END USER (2024)
FIGURE 166 SPAIN MARKET SHARE ANALYSIS BY TYPE (2024)
FIGURE 167 SPAIN MARKET SHARE ANALYSIS BY END USER (2024)
FIGURE 168 ITALY MARKET SHARE ANALYSIS BY TYPE (2024)
FIGURE 169 ITALY MARKET SHARE ANALYSIS BY END USER (2024)
FIGURE 170 BRAZIL MARKET SHARE ANALYSIS BY TYPE (2024)
FIGURE 171 BRAZIL MARKET SHARE ANALYSIS BY END USER (2024)
FIGURE 172 ARGENTINA MARKET SHARE ANALYSIS BY TYPE (2024)
FIGURE 173 ARGENTINA MARKET SHARE ANALYSIS BY END USER (2024)
FIGURE 174 COLUMBIA MARKET SHARE ANALYSIS BY TYPE (2024)
FIGURE 175 COLUMBIA MARKET SHARE ANALYSIS BY END USER (2024)
FIGURE 176 GLOBAL MATTRESS CURRENT AND FUTURE MARKET KEY COUNTRY LEVEL ANALYSIS, 2024–2034, (USD MILLION)
FIGURE 177 FINANCIAL OVERVIEW:
Key Player Analysis
Tempur Sealy International Inc.: Tempur Sealy is positioned as a global leader with a premium mix across foam, hybrid, and innerspring categories, aligned to higher average selling prices in developed markets and broad distribution across North America, Europe, and Asia Pacific. The portfolio targets comfort and temperature regulation outcomes that drive willingness to pay in 2025, where hybrids typically price around USD 1,200 to 2,000 for a queen and memory foam models range from USD 800 to 2,500. Strategically, the company benefits from strong offline retail exposure where in‑store testing sustains conversion, while digital channels shape pre‑purchase research and support direct‑to‑consumer sales. You should expect continued emphasis on foam and hybrid feature sets that address motion isolation, edge support, and heat management to defend share and margins.
Serta Simmons Bedding LLC: Serta Simmons operates as a top‑tier competitor in North America and selected international markets, with a full assortment spanning foam, hybrid, and innerspring for both household and commercial buyers. The company’s channel mix aligns to the category reality that offline remains the primary path to purchase for higher‑ticket mattresses, while online education and trials improve conversion and expand reach. Strategic priorities in 2025 center on mid to premium price bands where hybrid adoption is rising due to stronger edge performance and better temperature control, which supports average selling prices and return reduction. Hospitality standards and refresh cycles add steady commercial volumes that can smooth consumer cyclicality for your planning.
Spring Air International: Spring Air is a licensing‑led player that expands through long‑term agreements to scale local manufacturing and market entry across the Middle East and Asia. In 2025 the group extended its Sleep Copper collection into six Middle Eastern countries with a Saudi partner, signaling deeper regional penetration and faster product rollout. The network spans domestic factories and international licensees operating across dozens of countries, enabling regional assortment and service levels that support wholesale partners and retailers. Renewed licenses in Malaysia and extended Gulf partnerships underpin a stable footprint and predictable royalty streams that can fund product updates and marketing in your priority geographies.
Sleep Number Corp.: Sleep Number is positioned as an innovator in connected sleep, integrating sensor‑enabled smart beds with software that captures biosignals and adjusts firmness for measurable sleep outcomes. The company executed a business reset through 2024–2025, delivering margin expansion and significant operating cost reductions to stabilize cash flow amid softer demand. Q2 2025 net sales reached USD 328 million, down 19.7% year over year, while gross margin held at 59.1%, reflecting mix and cost actions that supported unit economics. Management expects to remove over USD 130 million in operating expenses in 2025, building on USD 173 million eliminated over the prior two years, while average revenue per smart bed unit edged higher in recent reporting to support profitability in your planning horizon.
Market Key Players
Tempur Sealy International
Serta Simmons Bedding
Sleep Number
Kingsdown
Spring Air International
Hilding Anders
Sleepwell
Casper
Purple Innovation
Emma Sleep
Sheela Foam
Derucci
Driver
Rising Sleep Health Awareness Drives Replacement and Upgrade Cycles
Growing consumer interest in sleep quality is a main driver of mattress demand in 2025. Global surveys show that nearly 80% of adults experience disrupted sleep, leading to a willingness to invest in mattresses that improve comfort, temperature control, and spinal alignment. As replacement cycles shorten to about seven to nine years in key markets, households increasingly see mattresses as wellness investments instead of luxury furniture. This change supports steady demand across foam and hybrid mattress categories.
E-Commerce Expansion and Premiumization Support Market Growth
The rapid growth of online mattress sales and direct-to-consumer brands is driving further expansion. Bed-in-a-box models and clear online comparisons now account for about 25% to 30% of unit sales in the U.S. and Western Europe. This improves access and price clarity for buyers. At the same time, premiumization, led by hybrids, memory foam, and adjustable mattresses, continues to raise average selling prices. These factors together support the market’s expected 7.7% compound annual growth rate through 2034.
Fluctuations in raw material prices are a major challenge for the mattress market. Polyurethane foam, steel coils, latex, and fabric inputs make up a significant portion of production costs, leaving manufacturers vulnerable to changes in petrochemical and metal prices. Shipping costs and returns related to online sales further squeeze margins, especially for direct-to-consumer brands offering free trials and returns.
Regulatory and Compliance Requirements Increase Time-to-Market
Meeting flammability and chemical safety regulations adds operational challenges. In the U.S., all mattress sets must meet the open-flame standard under 16 CFR Part 1633, while European manufacturers deal with strict REACH chemical compliance. These regulations increase testing, paperwork, and sourcing costs, delaying product launches and raising entry barriers for smaller or newer companies, particularly in premium and sustainable product lines.
Opportunity
Asia Pacific Urbanization Creates Strong Volume and Value Upside
Asia Pacific offers the greatest growth potential, fueled by rapid urbanization, middle-class growth, and rising disposable incomes in China, India, and Southeast Asia. The region already makes up about 38% of the global market value and continues to benefit from significant household formation and an increased focus on sleep health. Local foam and hybrid products aimed at middle-income buyers are gaining popularity in both online and modern retail settings.
Hospitality and Commercial Refresh Cycles Offer Stable Demand
The commercial sector provides a complementary growth opportunity. Hotels, resorts, and healthcare facilities focus on durability, cleanliness, and guest satisfaction, supporting ongoing replacement demand even during slowdowns in consumer spending. As global travel stabilizes and renovation projects progress, hospitality refresh cycles are likely to deliver consistent additional volumes, offering security for overall market growth during the forecast period.
Trend
Hybrid Mattresses Gain Traction at Mid-Premium Price Points
Hybrid mattresses are becoming the fastest-growing product type as consumers look for a mix of comfort, cooling, and edge support. Usually priced between USD 1,200 and 2,000 for a queen size, hybrids attract buyers upgrading from traditional innerspring or basic foam mattresses. Advances in zoned coils, breathable covers, and cooling foams are enhancing the value proposition and lowering return rates across different sales channels.
Smart Features and Sustainability Reshape Product Differentiation
Technology and sustainability are increasingly influencing competitive positioning. Smart mattresses with built-in sensors, adjustable firmness, and app-based sleep tracking are becoming more mainstream. Meanwhile, sustainability is becoming a key factor in purchasing decisions, with brands incorporating recycled materials, eco-certifications, and take-back programs. Together, these connected sleep features and confirmed sustainability claims are reshaping product differences and impacting buying choices in both household and hospitality markets.
Recent Developments
Dec 2024 – Spring Air International: Extended its licensing agreement with a UAE-based partner to strengthen manufacturing and distribution across the Gulf, supporting broader rollout of premium lines including cooling and latex constructions. The move consolidates regional service levels and improves speed to shelf for key retailers. Strategic impact: Enhances GCC coverage and accelerates growth through localized capacity and an asset-light model.
Feb 2025 – Tempur Sealy International: Closed the USD 5 billion acquisition of Mattress Firm, integrating manufacturing with the largest specialty mattress retailer in the U.S. to control merchandising, promotions, and in-store execution. A federal court denied the FTC’s request for a preliminary injunction, clearing the path to closing and integration milestones. Strategic impact: Creates a scaled platform with stronger pricing power, shopper data access, and multi-brand retail reach.
Mar 2025 – Sleep Number Corp.: Announced fourth quarter and full-year 2024 results and detailed a business reset focused on expense reductions, selective store rationalization, and higher-margin smart bed mix. The company filed its 2024 Form 10‑K outlining connected sleep priorities and operational changes entering 2025. Strategic impact: Rebalances cost structure and focuses resources on differentiated, sensor-enabled beds to support profitability.
Jul 2025 – Sleep Number Corp.: Reported Q2 2025 net sales of USD 328 million, down 19.7% year over year, with gross margin at 59.1% on improved mix and cost controls. Management targeted more than USD 130 million in 2025 operating expense reductions to stabilize profitability and cash flow. Strategic impact: Protects unit economics while demand normalizes and supports investment in software features and attachments.
Sep 2025 – Serta Simmons Bedding: Expanded its partnership with ACB to boost dealer marketing, digital media, and program intelligence aimed at higher conversion and improved return on ad spend across North American retailers. The initiative supports category education around hybrids and premium foam at key price bands. Strategic impact: Reinforces offline leadership and improves sell-through with data-driven retail activation.
Oct 2025 – Spring Air International: Rolled out the Sleep Copper line across six Middle Eastern countries via a Saudi partner, adding heat management and antimicrobial positioning tailored to hot climates. The expansion leverages licensing to scale quickly across multi-country retail networks. Strategic impact: Accelerates international growth with climate-relevant claims and localized manufacturing without heavy capex.