Medical Device Outsourcing Market Size 2025–2034 | CAGR 13.1%
Global Medical Device Outsourcing Market Size, Share, Growth & Analysis By Service (Contract Manufacturing, Component & Device Manufacturing, Design & Development, Quality Assurance, Regulatory Affairs, Clinical Trials Support), By Application (Cardiology, Diagnostic Imaging, Drug Delivery, IVD, Surgical Devices), By Class (Class I, Class II, Class III), By Region & Key Players – Industry Overview, Market Dynamics, Competitive Strategies, Emerging Trends & Forecast 2025–2034
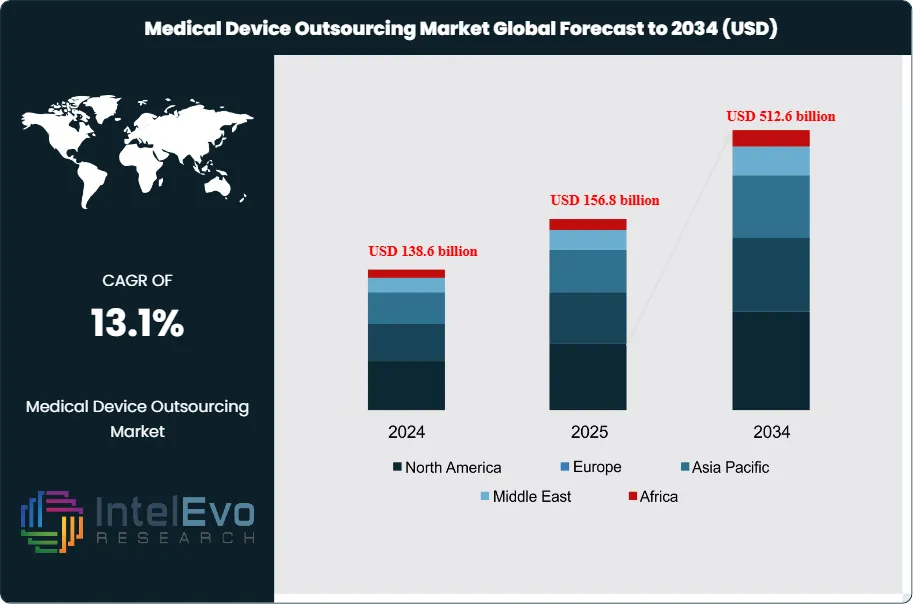
The Medical Device Outsourcing Market is estimated to reach approximately US$ 156.8 billion in 2025 and is projected to expand to around US$ 512.6 billion by 2034, registering a strong compound annual growth rate (CAGR) of about 13.1% during the forecast period from 2026 to 2034. Market growth is driven by rising demand for cost-efficient manufacturing, increasing regulatory complexity, and accelerating innovation in high-value medical devices such as implantables, diagnostics, and minimally invasive systems. OEMs are increasingly outsourcing design, prototyping, testing, and regulatory services to reduce time-to-market and improve scalability. Additionally, growing adoption of contract manufacturing and development services across emerging economies continues to reshape global supply chains, reinforcing long-term market momentum and platform visibility.
Growing regulatory complexity, higher compliance costs, and pressure on margins are pushing medical device manufacturers to rely more on external partners for design, production, and regulatory support. Outsourcing allows original equipment manufacturers to release capital tied up in facilities, redirect spending toward innovation, and shorten time-to-market for advanced devices.
Regulation remains a central force in shaping demand. Tighter approval standards from agencies such as the U.S. Food and Drug Administration and European authorities raise the cost and risk of in-house development. Specialist contract manufacturers spread this burden across multiple clients, maintain dedicated regulatory teams, and operate standardized quality systems. This shift strengthens large, full-service providers but increases dependence on a narrower supplier base and heightens exposure to disruption.
Technology trends accelerate outsourcing further. AI-enabled design tools, automated inspection, and digital production platforms reduce defect rates and support miniaturized components for wearables, home-based diagnostics, and minimally invasive devices. Many manufacturers do not hold these capabilities at scale, so they engage partners with advanced robotics and data-rich manufacturing environments. Partnerships such as the supply and services agreement between Avantor and Catalent show how integrated material supply, laboratory support, and manufacturing services create end-to-end ecosystems around leading contract providers.
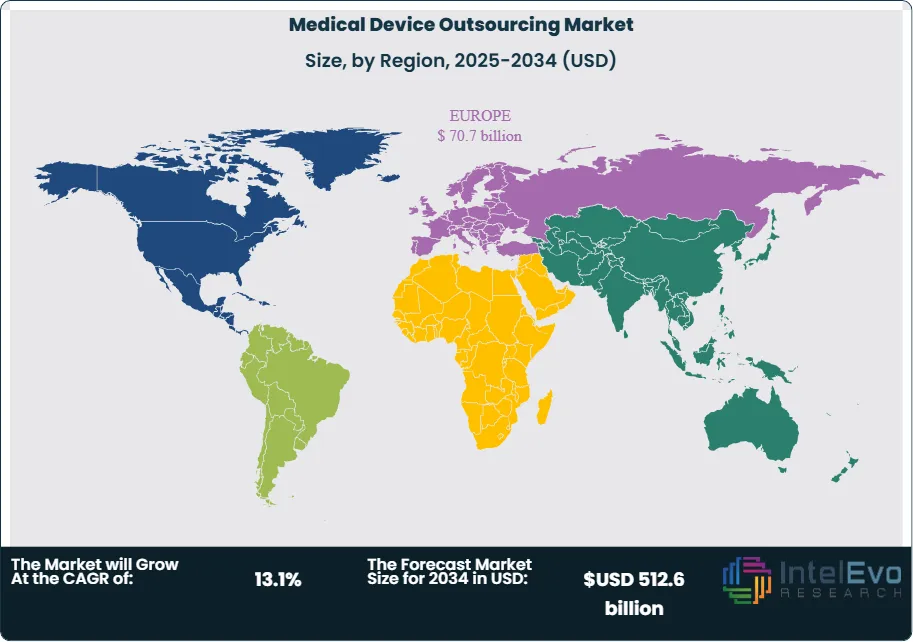
Regional dynamics guide capital allocation. North America accounted for about 42.4% of global revenue in 2024, or roughly US$ 60.4 Billion, supported by a large base of OEMs, regulatory consulting capacity, and high adoption of complex implants and diagnostic systems. Asia Pacific is emerging as the fastest-growing hub, with estimated low-teens annual growth driven by expanding manufacturing clusters in China and India and rising demand for specialized care. Europe maintains a substantial share, backed by a medtech innovation base but tempered by reimbursement pressure and cost-containment policies.
Strategic partnerships and outsourcing agreements, including the collaboration between NAMSA and InspireMD to accelerate device development and commercialization, show how external partners shape the product life cycle. Providers that combine regulatory insight, digital manufacturing, and global supply coverage are positioned to capture value as manufacturers consolidate their vendor base and move toward long-term, integrated outsourcing models.
Market Growth: The market generated revenue of US$ 156.8 billion in 2025 and is projected to reach US$ 512.6 billion by 2034, delivering a CAGR of 13.1%, 2026-2034.
Segment Dominance: Contract manufacturing leads the service segment with a 51.7% share, 2023, as OEMs consolidate production with large-scale partners. This leadership likely translates into estimated: 75.0 billion USD, 2024 in outsourced manufacturing value as volumes shift from in-house lines.
Segment Dominance: In applications, cardiology devices capture the largest share at 42.3%, 2023, reflecting high demand for interventional, monitoring, and implantable solutions. Class II devices also command the highest regulatory class share at 49.4%, 2023, concentrating outsourced activity in mid-risk categories.
Driver: Rising complexity and cost of in-house production motivate OEMs to outsource, with estimated: 15.0% operating cost reduction per program, 2024 when they shift to specialized partners. Stricter regulatory expectations further push manufacturers toward partners with scaled quality systems and compliance expertise, 2024.
Restraint: Dependence on a concentrated vendor base raises supply continuity risk, with estimated: 20.0% of OEMs, 2024 reporting moderate-to-high exposure to single-source contract manufacturers. Regulatory lapses or quality issues at an outsourced facility can trigger recalls and revenue loss above estimated: 1.0 billion USD, 2024 across the industry.
Opportunity: Growing adoption of complex minimally invasive and home-care devices opens new outsourcing demand pools, supporting estimated: 14.0% CAGR in high-value device outsourcing, 2024-2034. Vendors that add design, testing, and regulatory services to manufacturing can raise wallet share per client by estimated: 25.0%, 2024.
Trend: AI-enabled design, automated inspection, and digital manufacturing dashboards increasingly shape outsourcing contracts, with estimated: 35.0% of new agreements, 2024 including explicit digital or analytics components. Vendors that invest in data-driven process control can cut defect rates by estimated: 30.0%, 2024, strengthening their competitive position.
Regional Analysis: North America leads the market with a 42.4% share, 2023, anchored by a large OEM base, strong regulatory expertise, and high adoption of complex devices. Asia Pacific emerges as the fastest-growing hub at estimated: 15.0% CAGR, 2024-2034, while Europe maintains an estimated: 25.0% share, 2023 under cost-containment pressure.
Type Analysis
High-performance concrete and self-consolidating concrete account for a growing share of material use in structural and architectural applications. Demand continues to rise in 2025 as builders pursue consistent strength, improved placement efficiency, and reduced maintenance costs. Global construction projects in transport, utilities, and high-density housing are increasing the need for materials that provide predictable performance under load. High-performance formulations have gained particular traction in large infrastructure programs across North America, Europe, and Asia, where long service life and controlled curing conditions are key procurement requirements.
Self-consolidating concrete shows steady expansion as contractors place emphasis on productivity and uniform finishes. The ability to reduce labor hours and achieve better formwork results is driving interest from commercial and industrial developers. Other specialty concrete types retain relevance in smaller or mixed-use projects where customized mixes are necessary. Suppliers that provide consistent batching, digital monitoring, and material traceability are gaining preference among large contractors who must meet strict quality norms.
Growth through 2030 is supported by rising urban development budgets across major economies and stronger adoption of mechanized placement equipment. Global spending on concrete materials is projected to increase at an annual rate near 6 to 7 percent, supported by expansion in transport corridors, renewable energy installations, and mid-rise residential buildings.
Application Analysis
Pavers represent a major share of consumption across municipal and private development projects. Rising investment in walkways, transit terminals, and urban landscaping is lifting demand through 2025. Cities are prioritizing low-maintenance pavements to reduce lifecycle costs, which positions engineered concrete pavers as a strategic material choice. Retaining walls hold a solid portion of overall volume as land development, hillside construction, and flood-management systems rely on reinforced structures for stability.
Other applications include utility corridors, industrial yards, and logistics hubs. These segments benefit from materials that deliver predictable strength and controlled shrinkage. Increased spending on warehousing and distribution networks in North America and Asia contributes to higher demand for heavy-load concrete applications. As supply chains expand and regional manufacturing footprints increase, concrete usage in load-bearing pavements and site-development structures continues to rise.
Manufacturers and contractors are adopting digital mix-design tools and automated monitoring to improve consistency and compliance with regional building codes. This shift helps reduce rework rates and enhances overall project reliability.
End-Use Analysis
Residential buildings account for a meaningful share of global concrete consumption, supported by steady homebuilding activity and public housing programs. Rising urban populations in Asia and Africa continue to widen the need for multi-unit dwellings. Commercial buildings follow closely, driven by steady investment in offices, healthcare facilities, and education infrastructure. Many of these projects require controlled-performance mixes for foundations, slabs, and façade elements.
Industrial buildings are expanding as global manufacturing shifts to more automated production lines and larger distribution centers. These facilities require durable structures capable of supporting heavy machinery and vehicle movement. Demand for high-strength and self-consolidating mixes is increasing due to tighter construction schedules and the need for reliable finishes. By 2030, industrial construction spending is expected to grow at an annual rate above 5 percent, supported by increased investment in energy, automotive, and electronics sectors.
The broader market benefits from modernization of building codes, higher safety expectations, and consistent investment from public and private sectors. Builders are adopting standardized mixes to reduce delays and improve quality verification.
Regional Analysis
North America maintains a strong position in the concrete materials market, supported by stable construction spending and federal investment in transport and utilities. The United States is expected to remain a core consumption base through 2030 due to ongoing projects in bridges, highways, and renewable energy infrastructure. Canada’s urban development programs also contribute to sustained regional demand. Material suppliers with broad distribution networks and certified batching facilities hold a competitive edge in procurement cycles.
Europe shows steady activity, driven by renovation programs and low-carbon building requirements. The region continues to emphasize materials with lower embodied emissions, which encourages use of advanced concrete mixes. Germany, France, and the United Kingdom remain central markets as public infrastructure budgets expand and commercial developers prioritize energy-efficient structures.
Asia Pacific is the fastest-growing region, supported by rapid urbanization, industrial expansion, and strong public infrastructure pipelines in China, India, Indonesia, and Vietnam. Large-scale rail, airport, and housing projects are increasing the need for high-volume concrete supply. Latin America and the Middle East & Africa show gradual improvement, backed by selective investment in transport corridors, industrial parks, and urban development programs. Growth rates in these regions remain tied to economic conditions and public-sector funding stability.
By Service (Contract Manufacturing, Accessories Manufacturing, Assembly Manufacturing, Component Manufacturing, Device Manufacturing, Quality Assurance, Design and Development Services, Machining, Molding, Designing & Engineering, Packaging, Maintenance Services, Regulatory Affairs Services, Clinical Trials Applications And Product Registrations, Regulatory Writing And Publishing, Legal Representation, Others), By Application (Cardiology, General and Plastic Surgery, Diagnostic Imaging, Drug Delivery, IVD, Others), By Class (Class I, Class II, Class III)
Research Methodology
Primary Research- 100 Interviews of Stakeholders
Secondary Research
Desk Research
Regional scope
North America (United States, Canada, Mexico)
Latin America (Brazil, Argentina, Columbia)
East Asia And Pacific (China, Japan, South Korea, Australia, Cambodia, Fiji, Indonesia)
Sea And South Asia (India, Singapore, Thailand, Taiwan, Malaysia)
Eastern Europe (Poland, Russia, Czech Republic, Romania)
Western Europe (Germany, U.K., France, Spain, Itlay)
Middle East & Africa (GCC Countries, Egypt, Nigeria, South Africa, Israel)
Competitive Landscape
Mandala International, SGS SA, North American Science Associates, LLC, Euro fins Scientific, Pace Analytical Services, Inc, Freyr, Laboratory Corporation of America Holdings, Intertek Group plc, PAREXEL International Corporation, Global Regulatory Partners, WuXiAppTec, Medical Device Testing Services, Charles River Laboratories
Customization Scope
Customization for segments, region/country-level will be provided. Moreover, additional customization can be done based on the requirements.
Pricing and Purchase Options
Avail customized purchase options to meet your exact research needs. We have three licenses to opt for: Single User License, Multi-User License (Up to 5 Users), Corporate Use License (Unlimited User and Printable PDF).
TABLE OF CONTENTS
1. EXECUTIVE SUMMARY
1.1. MARKET SNAPSHOT
1.2. KEY FINDINGS & INSIGHTS
1.3. ANALYST RECOMMENDATIONS
1.4. FUTURE OUTLOOK
2. RESEARCH METHODOLOGY
2.1. MARKET DEFINITION & SCOPE
2.2. RESEARCH OBJECTIVES: PRIMARY & SECONDARY DATA SOURCES
2.3. DATA COLLECTION SOURCES
2.3.1. COVERAGE OF 100+ PRIMARY RESEARCH/CONSULTATION CALLS WITH INDUSTRY STAKEHOLDERS
FIGURE 17 NORTH AMERICA MEDICAL DEVICE OUTSOURCING CURRENT AND FUTURE TYPE ANALYSIS, 2025–2034, (USD MILLION)
FIGURE 18 NORTH AMERICA MEDICAL DEVICE OUTSOURCING CURRENT AND FUTURE END USER ANALYSIS, 2025–2034, (USD MILLION)
FIGURE 19 MARKET SHARE BY COUNTRY
FIGURE 20 LATIN AMERICA MEDICAL DEVICE OUTSOURCING CURRENT AND FUTURE TYPE ANALYSIS, 2025–2034, (USD MILLION)
FIGURE 21 LATIN AMERICA MEDICAL DEVICE OUTSOURCING CURRENT AND FUTURE END USER ANALYSIS, 2025–2034, (USD MILLION)
FIGURE 22 MARKET SHARE BY COUNTRY
FIGURE 23 EASTERN EUROPE MEDICAL DEVICE OUTSOURCING CURRENT AND FUTURE TYPE ANALYSIS, 2025–2034, (USD MILLION)
FIGURE 24 EASTERN EUROPE MEDICAL DEVICE OUTSOURCING CURRENT AND FUTURE END USER ANALYSIS, 2025–2034, (USD MILLION)
FIGURE 25 MARKET SHARE BY COUNTRY
FIGURE 26 WESTERN EUROPE MEDICAL DEVICE OUTSOURCING CURRENT AND FUTURE TYPE ANALYSIS, 2025–2034, (USD MILLION)
FIGURE 27 WESTERN EUROPE MEDICAL DEVICE OUTSOURCING CURRENT AND FUTURE END USER ANALYSIS, 2025–2034, (USD MILLION)
FIGURE 28 MARKET SHARE BY COUNTRY
FIGURE 29 EAST ASIA AND PACIFIC MEDICAL DEVICE OUTSOURCING CURRENT AND FUTURE TYPE ANALYSIS, 2025–2034, (USD MILLION)
FIGURE 30 EAST ASIA AND PACIFIC MEDICAL DEVICE OUTSOURCING CURRENT AND FUTURE END USER ANALYSIS, 2025–2034, (USD MILLION)
FIGURE 31 MARKET SHARE BY COUNTRY
FIGURE 32 SEA AND SOUTH ASIA MEDICAL DEVICE OUTSOURCING CURRENT AND FUTURE TYPE ANALYSIS, 2025–2034, (USD MILLION)
FIGURE 33 SEA AND SOUTH ASIA MEDICAL DEVICE OUTSOURCING CURRENT AND FUTURE END USER ANALYSIS, 2025–2034, (USD MILLION)
FIGURE 34 MARKET SHARE BY COUNTRY
FIGURE 35 MIDDLE EAST AND AFRICA MEDICAL DEVICE OUTSOURCING CURRENT AND FUTURE TYPE ANALYSIS, 2025–2034, (USD MILLION)
FIGURE 36 MIDDLE EAST AND AFRICA MEDICAL DEVICE OUTSOURCING CURRENT AND FUTURE END USER ANALYSIS, 2025–2034, (USD MILLION)
FIGURE 37 NORTH AMERICA MEDICAL DEVICE OUTSOURCING CURRENT AND FUTURE MARKET VOLUME SHARE REGIONAL ANALYSIS, 2025–2034, (USD MILLION)
FIGURE 38 U.S. MEDICAL DEVICE OUTSOURCING CURRENT AND FUTURE TYPE ANALYSIS, 2025–2034, (USD MILLION)
FIGURE 39 U.S. MEDICAL DEVICE OUTSOURCING CURRENT AND FUTURE END USER ANALYSIS, 2025–2034, (USD MILLION)
FIGURE 40 CANADA MEDICAL DEVICE OUTSOURCING CURRENT AND FUTURE TYPE ANALYSIS, 2025–2034, (USD MILLION)
FIGURE 41 CANADA MEDICAL DEVICE OUTSOURCING CURRENT AND FUTURE END USER ANALYSIS, 2025–2034, (USD MILLION)
FIGURE 42 LATIN AMERICA MEDICAL DEVICE OUTSOURCING CURRENT AND FUTURE MARKET VOLUME SHARE REGIONAL ANALYSIS, 2025–2034, (USD MILLION)
FIGURE 43 MEXICO MEDICAL DEVICE OUTSOURCING CURRENT AND FUTURE TYPE ANALYSIS, 2025–2034, (USD MILLION)
FIGURE 44 MEXICO MEDICAL DEVICE OUTSOURCING CURRENT AND FUTURE END USER ANALYSIS, 2025–2034, (USD MILLION)
FIGURE 45 BRAZIL MEDICAL DEVICE OUTSOURCING CURRENT AND FUTURE TYPE ANALYSIS, 2025–2034, (USD MILLION)
FIGURE 46 BRAZIL MEDICAL DEVICE OUTSOURCING CURRENT AND FUTURE END USER ANALYSIS, 2025–2034, (USD MILLION)
FIGURE 47 ARGENTINA MEDICAL DEVICE OUTSOURCING CURRENT AND FUTURE TYPE ANALYSIS, 2025–2034, (USD MILLION)
FIGURE 48 ARGENTINA MEDICAL DEVICE OUTSOURCING CURRENT AND FUTURE END USER ANALYSIS, 2025–2034, (USD MILLION)
FIGURE 49 COLUMBIA MEDICAL DEVICE OUTSOURCING CURRENT AND FUTURE TYPE ANALYSIS, 2025–2034, (USD MILLION)
FIGURE 50 COLUMBIA MEDICAL DEVICE OUTSOURCING CURRENT AND FUTURE END USER ANALYSIS, 2025–2034, (USD MILLION)
FIGURE 51 REST OF LATIN AMERICA MEDICAL DEVICE OUTSOURCING CURRENT AND FUTURE TYPE ANALYSIS, 2025–2034, (USD MILLION)
FIGURE 52 REST OF LATIN AMERICA MEDICAL DEVICE OUTSOURCING CURRENT AND FUTURE END USER ANALYSIS, 2025–2034, (USD MILLION)
FIGURE 53 EASTERN EUROPE MEDICAL DEVICE OUTSOURCING CURRENT AND FUTURE MARKET VOLUME SHARE REGIONAL ANALYSIS, 2025–2034, (USD MILLION)
FIGURE 54 POLAND MEDICAL DEVICE OUTSOURCING CURRENT AND FUTURE TYPE ANALYSIS, 2025–2034, (USD MILLION)
FIGURE 55 POLAND MEDICAL DEVICE OUTSOURCING CURRENT AND FUTURE END USER ANALYSIS, 2025–2034, (USD MILLION)
FIGURE 56 RUSSIA MEDICAL DEVICE OUTSOURCING CURRENT AND FUTURE TYPE ANALYSIS, 2025–2034, (USD MILLION)
FIGURE 57 RUSSIA MEDICAL DEVICE OUTSOURCING CURRENT AND FUTURE END USER ANALYSIS, 2025–2034, (USD MILLION)
FIGURE 58 CZECH REPUBLIC MEDICAL DEVICE OUTSOURCING CURRENT AND FUTURE TYPE ANALYSIS, 2025–2034, (USD MILLION)
FIGURE 59 CZECH REPUBLIC MEDICAL DEVICE OUTSOURCING CURRENT AND FUTURE END USER ANALYSIS, 2025–2034, (USD MILLION)
FIGURE 60 ROMANIA MEDICAL DEVICE OUTSOURCING CURRENT AND FUTURE TYPE ANALYSIS, 2025–2034, (USD MILLION)
FIGURE 61 ROMANIA MEDICAL DEVICE OUTSOURCING CURRENT AND FUTURE END USER ANALYSIS, 2025–2034, (USD MILLION)
FIGURE 62 REST OF EASTERN EUROPE MEDICAL DEVICE OUTSOURCING CURRENT AND FUTURE TYPE ANALYSIS, 2025–2034, (USD MILLION)
FIGURE 63 REST OF EASTERN EUROPE MEDICAL DEVICE OUTSOURCING CURRENT AND FUTURE END USER ANALYSIS, 2025–2034, (USD MILLION)
FIGURE 64 WESTERN EUROPE MEDICAL DEVICE OUTSOURCING CURRENT AND FUTURE MARKET VOLUME SHARE REGIONAL ANALYSIS, 2025–2034, (USD MILLION)
FIGURE 65 GERMANY MEDICAL DEVICE OUTSOURCING CURRENT AND FUTURE TYPE ANALYSIS, 2025–2034, (USD MILLION)
FIGURE 66 GERMANY MEDICAL DEVICE OUTSOURCING CURRENT AND FUTURE END USER ANALYSIS, 2025–2034, (USD MILLION)
FIGURE 67 FRANCE MEDICAL DEVICE OUTSOURCING CURRENT AND FUTURE TYPE ANALYSIS, 2025–2034, (USD MILLION)
FIGURE 68 FRANCE MEDICAL DEVICE OUTSOURCING CURRENT AND FUTURE END USER ANALYSIS, 2025–2034, (USD MILLION)
FIGURE 69 UK MEDICAL DEVICE OUTSOURCING CURRENT AND FUTURE TYPE ANALYSIS, 2025–2034, (USD MILLION)
FIGURE 70 UK MEDICAL DEVICE OUTSOURCING CURRENT AND FUTURE END USER ANALYSIS, 2025–2034, (USD MILLION)
FIGURE 71 SPAIN MEDICAL DEVICE OUTSOURCING CURRENT AND FUTURE TYPE ANALYSIS, 2025–2034, (USD MILLION)
FIGURE 72 SPAIN MEDICAL DEVICE OUTSOURCING CURRENT AND FUTURE END USER ANALYSIS, 2025–2034, (USD MILLION)
FIGURE 73 ITALY MEDICAL DEVICE OUTSOURCING CURRENT AND FUTURE TYPE ANALYSIS, 2025–2034, (USD MILLION)
FIGURE 74 ITALY MEDICAL DEVICE OUTSOURCING CURRENT AND FUTURE END USER ANALYSIS, 2025–2034, (USD MILLION)
FIGURE 75 REST OF WESTERN EUROPE MEDICAL DEVICE OUTSOURCING CURRENT AND FUTURE TYPE ANALYSIS, 2025–2034, (USD MILLION)
FIGURE 76 REST OF WESTERN EUROPE MEDICAL DEVICE OUTSOURCING CURRENT AND FUTURE END USER ANALYSIS, 2025–2034, (USD MILLION)
FIGURE 77 EAST ASIA AND PACIFIC MEDICAL DEVICE OUTSOURCING CURRENT AND FUTURE MARKET VOLUME SHARE REGIONAL ANALYSIS, 2025–2034, (USD MILLION)
FIGURE 78 CHINA MEDICAL DEVICE OUTSOURCING CURRENT AND FUTURE TYPE ANALYSIS, 2025–2034, (USD MILLION)
FIGURE 79 CHINA MEDICAL DEVICE OUTSOURCING CURRENT AND FUTURE END USER ANALYSIS, 2025–2034, (USD MILLION)
FIGURE 80 JAPAN MEDICAL DEVICE OUTSOURCING CURRENT AND FUTURE TYPE ANALYSIS, 2025–2034, (USD MILLION)
FIGURE 81 JAPAN MEDICAL DEVICE OUTSOURCING CURRENT AND FUTURE END USER ANALYSIS, 2025–2034, (USD MILLION)
FIGURE 82 AUSTRALIA MEDICAL DEVICE OUTSOURCING CURRENT AND FUTURE TYPE ANALYSIS, 2025–2034, (USD MILLION)
FIGURE 83 AUSTRALIA MEDICAL DEVICE OUTSOURCING CURRENT AND FUTURE END USER ANALYSIS, 2025–2034, (USD MILLION)
FIGURE 84 CAMBODIA MEDICAL DEVICE OUTSOURCING CURRENT AND FUTURE TYPE ANALYSIS, 2025–2034, (USD MILLION)
FIGURE 85 CAMBODIA MEDICAL DEVICE OUTSOURCING CURRENT AND FUTURE END USER ANALYSIS, 2025–2034, (USD MILLION)
FIGURE 86 FIJI MEDICAL DEVICE OUTSOURCING CURRENT AND FUTURE TYPE ANALYSIS, 2025–2034, (USD MILLION)
FIGURE 87 FIJI MEDICAL DEVICE OUTSOURCING CURRENT AND FUTURE END USER ANALYSIS, 2025–2034, (USD MILLION)
FIGURE 88 INDONESIA MEDICAL DEVICE OUTSOURCING CURRENT AND FUTURE TYPE ANALYSIS, 2025–2034, (USD MILLION)
FIGURE 89 INDONESIA MEDICAL DEVICE OUTSOURCING CURRENT AND FUTURE END USER ANALYSIS, 2025–2034, (USD MILLION)
FIGURE 90 SOUTH KOREA MEDICAL DEVICE OUTSOURCING CURRENT AND FUTURE TYPE ANALYSIS, 2025–2034, (USD MILLION)
FIGURE 91 SOUTH KOREA MEDICAL DEVICE OUTSOURCING CURRENT AND FUTURE END USER ANALYSIS, 2025–2034, (USD MILLION)
FIGURE 92 REST OF EAST ASIA AND PACIFIC MEDICAL DEVICE OUTSOURCING CURRENT AND FUTURE TYPE ANALYSIS, 2025–2034, (USD MILLION)
FIGURE 93 REST OF EAST ASIA AND PACIFIC MEDICAL DEVICE OUTSOURCING CURRENT AND FUTURE END USER ANALYSIS, 2025–2034, (USD MILLION)
FIGURE 94 SEA AND SOUTH ASIA MEDICAL DEVICE OUTSOURCING CURRENT AND FUTURE MARKET VOLUME SHARE REGIONAL ANALYSIS, 2025–2034, (USD MILLION)
FIGURE 95 BANGLADESH MEDICAL DEVICE OUTSOURCING CURRENT AND FUTURE TYPE ANALYSIS, 2025–2034, (USD MILLION)
FIGURE 96 BANGLADESH MEDICAL DEVICE OUTSOURCING CURRENT AND FUTURE END USER ANALYSIS, 2025–2034, (USD MILLION)
FIGURE 97 NEW ZEALAND MEDICAL DEVICE OUTSOURCING CURRENT AND FUTURE TYPE ANALYSIS, 2025–2034, (USD MILLION)
FIGURE 98 NEW ZEALAND MEDICAL DEVICE OUTSOURCING CURRENT AND FUTURE END USER ANALYSIS, 2025–2034, (USD MILLION)
FIGURE 99 INDIA MEDICAL DEVICE OUTSOURCING CURRENT AND FUTURE TYPE ANALYSIS, 2025–2034, (USD MILLION)
FIGURE 100 INDIA MEDICAL DEVICE OUTSOURCING CURRENT AND FUTURE END USER ANALYSIS, 2025–2034, (USD MILLION)
FIGURE 101 SINGAPORE MEDICAL DEVICE OUTSOURCING CURRENT AND FUTURE TYPE ANALYSIS, 2025–2034, (USD MILLION)
FIGURE 102 SINGAPORE MEDICAL DEVICE OUTSOURCING CURRENT AND FUTURE END USER ANALYSIS, 2025–2034, (USD MILLION)
FIGURE 103 THAILAND MEDICAL DEVICE OUTSOURCING CURRENT AND FUTURE TYPE ANALYSIS, 2025–2034, (USD MILLION)
FIGURE 104 THAILAND MEDICAL DEVICE OUTSOURCING CURRENT AND FUTURE END USER ANALYSIS, 2025–2034, (USD MILLION)
FIGURE 105 TAIWAN MEDICAL DEVICE OUTSOURCING CURRENT AND FUTURE TYPE ANALYSIS, 2025–2034, (USD MILLION)
FIGURE 106 TAIWAN MEDICAL DEVICE OUTSOURCING CURRENT AND FUTURE END USER ANALYSIS, 2025–2034, (USD MILLION)
FIGURE 107 MALAYSIA MEDICAL DEVICE OUTSOURCING CURRENT AND FUTURE TYPE ANALYSIS, 2025–2034, (USD MILLION)
FIGURE 108 MALAYSIA MEDICAL DEVICE OUTSOURCING CURRENT AND FUTURE END USER ANALYSIS, 2025–2034, (USD MILLION)
FIGURE 109 REST OF SEA AND SOUTH ASIA MEDICAL DEVICE OUTSOURCING CURRENT AND FUTURE TYPE ANALYSIS, 2025–2034, (USD MILLION)
FIGURE 110 REST OF SEA AND SOUTH ASIA MEDICAL DEVICE OUTSOURCING CURRENT AND FUTURE END USER ANALYSIS, 2025–2034, (USD MILLION)
FIGURE 111 MIDDLE EAST AND AFRICA MEDICAL DEVICE OUTSOURCING CURRENT AND FUTURE MARKET VOLUME SHARE REGIONAL ANALYSIS, 2025–2034, (USD MILLION)
FIGURE 112 GCC COUNTRIES MEDICAL DEVICE OUTSOURCING CURRENT AND FUTURE TYPE ANALYSIS, 2025–2034, (USD MILLION)
FIGURE 113 GCC COUNTRIES MEDICAL DEVICE OUTSOURCING CURRENT AND FUTURE END USER ANALYSIS, 2025–2034, (USD MILLION)
FIGURE 114 SAUDI ARABIA MEDICAL DEVICE OUTSOURCING CURRENT AND FUTURE TYPE ANALYSIS, 2025–2034, (USD MILLION)
FIGURE 115 SAUDI ARABIA MEDICAL DEVICE OUTSOURCING CURRENT AND FUTURE END USER ANALYSIS, 2025–2034, (USD MILLION)
FIGURE 116 UAE MEDICAL DEVICE OUTSOURCING CURRENT AND FUTURE TYPE ANALYSIS, 2025–2034, (USD MILLION)
FIGURE 117 UAE MEDICAL DEVICE OUTSOURCING CURRENT AND FUTURE END USER ANALYSIS, 2025–2034, (USD MILLION)
FIGURE 118 BAHRAIN MEDICAL DEVICE OUTSOURCING CURRENT AND FUTURE TYPE ANALYSIS, 2025–2034, (USD MILLION)
FIGURE 119 BAHRAIN MEDICAL DEVICE OUTSOURCING CURRENT AND FUTURE END USER ANALYSIS, 2025–2034, (USD MILLION)
FIGURE 120 KUWAIT MEDICAL DEVICE OUTSOURCING CURRENT AND FUTURE TYPE ANALYSIS, 2025–2034, (USD MILLION)
FIGURE 121 KUWAIT MEDICAL DEVICE OUTSOURCING CURRENT AND FUTURE END USER ANALYSIS, 2025–2034, (USD MILLION)
FIGURE 122 OMAN MEDICAL DEVICE OUTSOURCING CURRENT AND FUTURE TYPE ANALYSIS, 2025–2034, (USD MILLION)
FIGURE 123 OMAN MEDICAL DEVICE OUTSOURCING CURRENT AND FUTURE END USER ANALYSIS, 2025–2034, (USD MILLION)
FIGURE 124 QATAR MEDICAL DEVICE OUTSOURCING CURRENT AND FUTURE TYPE ANALYSIS, 2025–2034, (USD MILLION)
FIGURE 125 QATAR MEDICAL DEVICE OUTSOURCING CURRENT AND FUTURE END USER ANALYSIS, 2025–2034, (USD MILLION)
FIGURE 126 EGYPT MEDICAL DEVICE OUTSOURCING CURRENT AND FUTURE TYPE ANALYSIS, 2025–2034, (USD MILLION)
FIGURE 127 EGYPT MEDICAL DEVICE OUTSOURCING CURRENT AND FUTURE END USER ANALYSIS, 2025–2034, (USD MILLION)
FIGURE 128 NIGERIA MEDICAL DEVICE OUTSOURCING CURRENT AND FUTURE TYPE ANALYSIS, 2025–2034, (USD MILLION)
FIGURE 129 NIGERIA MEDICAL DEVICE OUTSOURCING CURRENT AND FUTURE END USER ANALYSIS, 2025–2034, (USD MILLION)
FIGURE 130 SOUTH AFRICA MEDICAL DEVICE OUTSOURCING CURRENT AND FUTURE TYPE ANALYSIS, 2025–2034, (USD MILLION)
FIGURE 131 SOUTH AFRICA MEDICAL DEVICE OUTSOURCING CURRENT AND FUTURE END USER ANALYSIS, 2025–2034, (USD MILLION)
FIGURE 132 ISRAEL MEDICAL DEVICE OUTSOURCING CURRENT AND FUTURE TYPE ANALYSIS, 2025–2034, (USD MILLION)
FIGURE 133 ISRAEL MEDICAL DEVICE OUTSOURCING CURRENT AND FUTURE END USER ANALYSIS, 2025–2034, (USD MILLION)
FIGURE 134 REST OF MEA MEDICAL DEVICE OUTSOURCING CURRENT AND FUTURE TYPE ANALYSIS, 2025–2034, (USD MILLION)
FIGURE 135 REST OF MEA MEDICAL DEVICE OUTSOURCING CURRENT AND FUTURE END USER ANALYSIS, 2025–2034, (USD MILLION)
FIGURE 136 U. S. MARKET SHARE ANALYSIS BY TYPE (2024)
FIGURE 137 U. S. MARKET SHARE ANALYSIS BY END USER (2024)
FIGURE 138 CANADA MARKET SHARE ANALYSIS BY TYPE (2024)
FIGURE 139 CANADA MARKET SHARE ANALYSIS BY END USER (2024)
FIGURE 140 MEXICO MARKET SHARE ANALYSIS BY TYPE (2024)
FIGURE 141 MEXICO MARKET SHARE ANALYSIS BY END USER (2024)
FIGURE 142 CHINA MARKET SHARE ANALYSIS BY TYPE (2024)
FIGURE 143 CHINA MARKET SHARE ANALYSIS BY END USER (2024)
FIGURE 144 JAPAN MARKET SHARE ANALYSIS BY TYPE (2024)
FIGURE 145 JAPAN MARKET SHARE ANALYSIS BY END USER (2024)
FIGURE 146 INDIA MARKET SHARE ANALYSIS BY TYPE (2024)
FIGURE 147 INDIA MARKET SHARE ANALYSIS BY END USER (2024)
FIGURE 148 SOUTH KOREA MARKET SHARE ANALYSIS BY TYPE (2024)
FIGURE 149 SOUTH KOREA MARKET SHARE ANALYSIS BY END USER (2024)
FIGURE 150 SAUDI ARABIA MARKET SHARE ANALYSIS BY TYPE (2024)
FIGURE 151 SAUDI ARABIA MARKET SHARE ANALYSIS BY END USER (2024)
FIGURE 152 UAE MARKET SHARE ANALYSIS BY TYPE (2024)
FIGURE 153 UAE MARKET SHARE ANALYSIS BY END USER (2024)
FIGURE 154 EGYPT MARKET SHARE ANALYSIS BY TYPE (2024)
FIGURE 155 EGYPT MARKET SHARE ANALYSIS BY END USER (2024)
FIGURE 156 NIGERIA MARKET SHARE ANALYSIS BY TYPE (2024)
FIGURE 157 NIGERIA MARKET SHARE ANALYSIS BY END USER (2024)
FIGURE 158 SOUTH AFRICA MARKET SHARE ANALYSIS BY TYPE (2024)
FIGURE 159 SOUTH AFRICA MARKET SHARE ANALYSIS BY END USER (2024)
FIGURE 160 GERMANY MARKET SHARE ANALYSIS BY TYPE (2024)
FIGURE 161 GERMANY MARKET SHARE ANALYSIS BY END USER (2024)
FIGURE 162 FRANCE MARKET SHARE ANALYSIS BY TYPE (2024)
FIGURE 163 FRANCE MARKET SHARE ANALYSIS BY END USER (2024)
FIGURE 164 UK MARKET SHARE ANALYSIS BY TYPE (2024)
FIGURE 165 UK MARKET SHARE ANALYSIS BY END USER (2024)
FIGURE 166 SPAIN MARKET SHARE ANALYSIS BY TYPE (2024)
FIGURE 167 SPAIN MARKET SHARE ANALYSIS BY END USER (2024)
FIGURE 168 ITALY MARKET SHARE ANALYSIS BY TYPE (2024)
FIGURE 169 ITALY MARKET SHARE ANALYSIS BY END USER (2024)
FIGURE 170 BRAZIL MARKET SHARE ANALYSIS BY TYPE (2024)
FIGURE 171 BRAZIL MARKET SHARE ANALYSIS BY END USER (2024)
FIGURE 172 ARGENTINA MARKET SHARE ANALYSIS BY TYPE (2024)
FIGURE 173 ARGENTINA MARKET SHARE ANALYSIS BY END USER (2024)
FIGURE 174 COLUMBIA MARKET SHARE ANALYSIS BY TYPE (2024)
FIGURE 175 COLUMBIA MARKET SHARE ANALYSIS BY END USER (2024)
FIGURE 176 GLOBAL MEDICAL DEVICE OUTSOURCING CURRENT AND FUTURE MARKET KEY COUNTRY LEVEL ANALYSIS, 2024–2034, (USD MILLION)
FIGURE 177 FINANCIAL OVERVIEW:
Key Player Analysis
Pace Analytical Services, Inc: Pace Analytical Services, Inc operates as a leader in specialized testing and regulatory support for medical device manufacturers. The company maintains a broad portfolio that includes biocompatibility testing, chemical analysis, sterilization validation, and packaging integrity assessment. Its facilities support FDA, ISO, and global regulatory requirements, which positions the company as a preferred partner for OEMs that must meet strict compliance standards. Pace continues to expand its accredited laboratory network across the US and Europe, giving you access to faster turnaround times and broader service coverage. The company is investing in automation and digital reporting systems as OEM expectations for process transparency increase. Pace reports steady growth in medical device testing demand, driven by rising volumes of Class II and Class III devices entering clinical and commercial phases. The firm also enters strategic partnerships with contract manufacturers and research institutions to extend its service pipeline. This combination of wide regulatory depth and geographic reach strengthens its competitive position in 2025.
North American Science Associates, LLC (NAMSA): NAMSA operates as a global leader in medical device testing, clinical research, and regulatory consulting. The company holds a strong position due to its integrated service model that spans preclinical evaluation, clinical trials, and post-market surveillance. NAMSA continues to support OEMs navigating MDR requirements in Europe and FDA submissions in the US. Its customer base includes established device brands and emerging firms that rely on NAMSA for rapid regulatory guidance and efficient trial execution. The company has expanded its global footprint with new laboratory capacity in Asia and Europe to support rising outsourcing demand. NAMSA reports increasing client activity in connected health, cardiovascular devices, and minimally invasive systems. Investments in digital clinical monitoring tools and expanded biocompatibility testing platforms help NAMSA maintain a leading position as OEMs seek partners with comprehensive regulatory and clinical expertise.
Medical Device Testing Services: Medical Device Testing Services functions as a niche player with strong capabilities in materials testing, device durability studies, and microbiology evaluations. The company supports a wide range of OEMs that require consistent performance verification, sterilization studies, and shelf-life validation across consumer health and clinical device categories. Its strength lies in its technical specialization and ability to deliver customized testing programs for small and mid-sized manufacturers. The firm is expanding capacity in fatigue testing, polymer analysis, and particulate characterization to support rising demand for minimally invasive devices and implantables. It is also adopting digital documentation systems and automated testing equipment to meet global audit requirements. As regulatory agencies intensify scrutiny of device safety and manufacturing consistency, Medical Device Testing Services is positioned to capture steady demand from OEMs seeking reliable third-party verification and compliance support.
Market Key Players:
Mandala International
SGS SA
North American Science Associates, LLC
Euro fins Scientific
Pace Analytical Services, Inc
Freyr
Laboratory Corporation of America Holdings
Intertek Group plc
PAREXEL International Corporation
Global Regulatory Partners
WuXiAppTec
Medical Device Testing Services
Charles River Laboratories
Driver
Rising Complexity of Medical Devices Accelerates Outsourcing
In 2025, the market continues to grow as medical device manufacturers encounter increasing demand for complex systems in cardiology, diagnostics, neurology, and surgical robotics. These products require skilled engineering, specialized materials, and precise assembly, which are tough to scale internally. As a result, OEMs are turning to contract partners that have validated facilities and specialized skills, leading to faster design-to-market cycles and better cost efficiency.
Regulatory changes back this outsourcing trend, especially for high-risk and digitally enabled devices. FDA approvals for advanced systems keep rising, with over 30 complex devices approved in the first half of 2024 alone. This regulatory growth boosts the need for specialized production capacity and compliant manufacturing partners, making outsourcing a key driver for OEMs in high-value, innovation-focused product segments.
Restraint
Intellectual Property and Data Security Risks Limit Adoption
Concerns about protecting intellectual property and data security are a major concern in 2025. Medical device companies must share sensitive design files, embedded software, and validation data with outside partners, which increases the risk of breaches. Any compromise can lead to operational disruptions, regulatory investigations, and significant financial losses, making security a crucial issue in outsourcing choices.
Cybersecurity risks grow due to an increase in breaches across the healthcare field. Public data from the HHS Office for Civil Rights indicates cyber incidents affected more than 130 million individuals in one year, many tied to third-party contractors. These events increase caution among OEMs and raise the importance of security compliance, vendor audits, and long-term risk management in outsourcing strategies.
Opportunity
Specialized Services Unlock Growth in Advanced Device Categories
There is a significant opportunity to expand specialized outsourcing services in high-growth areas like robotic surgery, AI-enabled diagnostics, and connected home-care devices. OEMs are increasingly looking for partners who can provide full-lifecycle services, including design, regulatory submissions, verification testing, and post-market surveillance. Picking partners with broad technical skills helps you gain more strategic value from outsourcing relationships.
Innovation signals show strong growth potential. USPTO data from 2024 indicates continued rises in patent filings related to robotics, AI-assisted diagnostics, and automated delivery systems. Contract manufacturers that blend advanced engineering with regulatory knowledge are well-positioned to capture a growing share of outsourcing spending, especially as OEMs prioritize speed, compliance, and scalability through 2030.
Trend
Automation and Smart Manufacturing Redefine Outsourcing Models
Automation and smart manufacturing are changing outsourcing strategies in 2025. Suppliers are increasingly using automated assembly, digital inspection systems, and robotics-assisted quality control to enhance consistency, cut down on rework, and meet strict compliance requirements. These investments improve operational efficiency while shortening production timelines for complex medical devices.
Robotics Adoption Becomes a Key Supplier Differentiator
Industry data shows the extent of this change. The International Federation of Robotics reports that the number of industrial robots in the United States grew by over 10 percent year over year, with notable use in medical and electronics manufacturing. As you assess suppliers or plan to expand capacity, automation capability is emerging as an essential factor for performance reliability and long-term competitiveness.
Recent Developments
Dec 2024 – ClinChoice and Medidata: ClinChoice announced the continuation and expansion of its partnership with Medidata to deploy the Clinical Data Studio platform across a broader set of medical device trials, targeting significant gains in data quality and cycle time. This move strengthens ClinChoice’s position as a preferred CRO for device sponsors that want tighter digital control of outsourced clinical programs.
Feb 2025 – NAMSA: NAMSA completed the acquisition of WuXi AppTec’s US medical device testing operations, including laboratories in Minnesota and Georgia, creating one of the largest integrated device testing footprints in North America. The deal expands capacity, adds specialized scientists, and gives you a broader menu of outsourced testing, regulatory, and consulting services within a single platform.
Mar 2025 – Zydus Lifesciences: Zydus Lifesciences agreed to acquire an 85.6 percent stake in French orthopedics device maker Amplitude Surgical for about EUR 256.8 million, adding a business with roughly EUR 106 million in annual sales and presence in more than 30 countries. The transaction signals rising interest from pharmaceutical players in device assets and will likely increase future outsourcing demand for orthopedic implants and related components as Zydus scales production.
Apr 2025 – Flex and Stryker: Flex entered a strategic manufacturing partnership with Stryker to produce and distribute Stryker’s neuro and spine product portfolio, with the deal aimed at improving operational efficiency and reducing unit costs across key product lines. The agreement deepens Flex’s role as a contract manufacturer for high-complexity devices and gives Stryker a more flexible outsourced capacity base for neurosurgical growth segments.
Oct 2025 – YEIDA and Medical Excellence Japan / BRIT: The Yamuna Expressway Industrial Development Authority (YEIDA) moved ahead with a memorandum of understanding with Medical Excellence Japan to support a 350-acre medical device park in Noida and confirmed plans with BRIT for a gamma radiation centre and shared scientific facilities, backed by a Rs 125 crore plug-and-play factory complex with 240 units. These initiatives will create a new outsourcing hub in North India, giving device OEMs and contract manufacturers access to sterilization, 3D design, prototyping, and IoMT resources in a single ecosystem.