Global Medication Adherence Market Size, Share & Industry Analysis By Product Type (Software-Centric Solutions, Hardware-Centric Devices), By Medication (Cardiovascular, Diabetes, Oncology, Central Nervous System, Respiratory, Others), By End-User (Hospitals, Pharmacies, Homecare Settings, Healthcare Providers) – Industry Trends, Competitive Landscape, Digital Health Integration, Reimbursement Scenario & Forecast 2025–2034
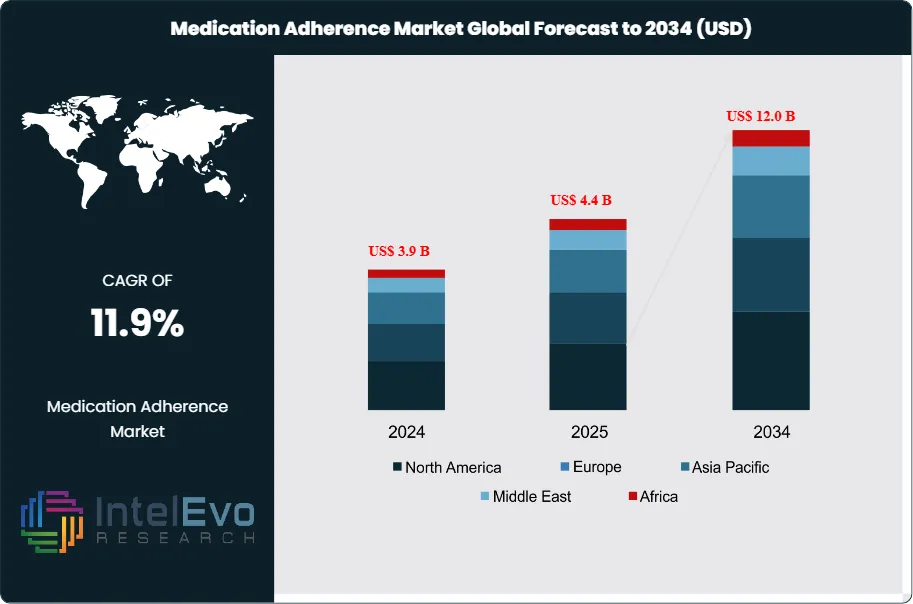
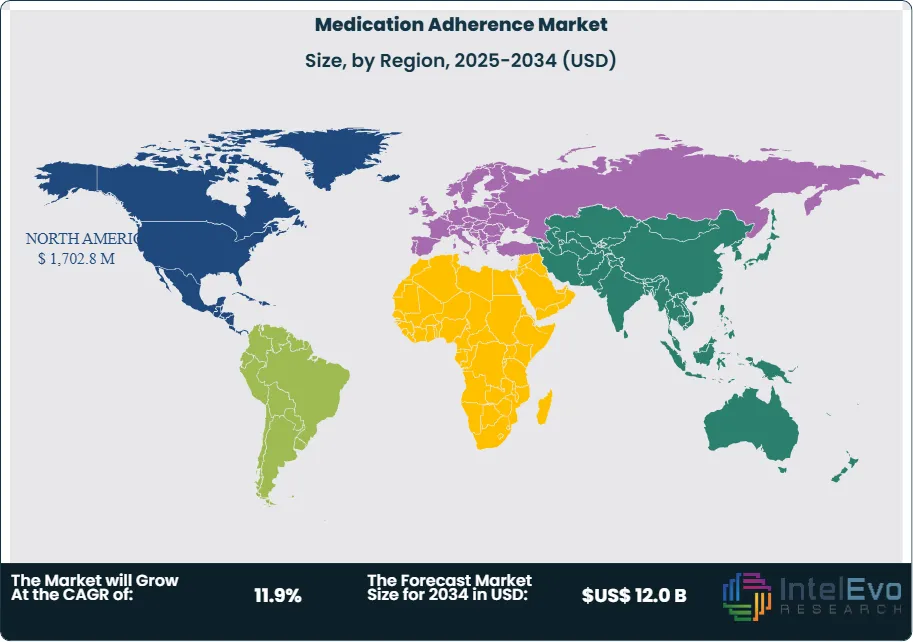
The Medication Adherence Market was valued at approximately US$ 3.9 billion in 2024 and is projected to reach nearly US$ 12.0 billion by 2034, reflecting strong and sustained growth over the forecast period. Based on the projected expansion trajectory, the market size for 2025 is estimated at around US$ 4.4 billion. Beginning in 2026, the market is expected to grow at a compound annual growth rate (CAGR) of about 11.9% from 2026 to 2034, ultimately reaching an estimated valuation of approximately US$ 12.0 billion by 2034. North America commands the largest regional share at 38.7%, generating approximately US$1.5 billion in revenue, while Asia-Pacific and Europe exhibit accelerating adoption driven by aging demographics and expanding healthcare infrastructure. This expansion reflects mounting pressures on healthcare systems to curtail preventable hospitalizations and improve clinical outcomes through systematic intervention strategies.
Digital transformation anchors market momentum as smart pill dispensers, mobile health platforms, and Internet of Medical Things (IoMT) devices reshape adherence protocols. Artificial intelligence algorithms now enable predictive analytics that identify high-risk non-adherent patients before clinical deterioration occurs, while automated reminder systems and real-time monitoring dashboards empower both patients and providers. Approximately 62% of adherence solutions deployed since 2022 incorporate connected device functionality, signaling a decisive shift toward data-driven care models. Regulatory frameworks in the United States and European Union increasingly mandate adherence tracking for high-cost therapies, particularly in oncology and immunology segments, creating compliance-driven demand.
Chronic disease proliferation remains the primary demand catalyst. Diabetes, cardiovascular disorders, and respiratory conditions collectively affect over 1.8 billion individuals globally, with medication non-adherence contributing to an estimated 125,000 annual deaths in the United States alone. Healthcare expenditures linked to non-adherence exceed US$300 billion annually across developed economies, prompting payers and providers to prioritize adherence interventions as cost-containment mechanisms. Community pharmacy networks and telehealth platforms serve as critical distribution channels, with pharmacist-led adherence programs demonstrating 28–34% improvement rates in medication compliance metrics.
Emerging markets in Southeast Asia, Latin America, and the Middle East represent untapped growth corridors as universal health coverage initiatives expand and smartphone penetration surpasses 70% in urban centers. However, reimbursement uncertainties, data privacy concerns, and interoperability challenges across fragmented healthcare IT systems pose adoption barriers. Investment activity concentrates on integrated platforms that combine behavioral science principles with seamless electronic health record connectivity. As value-based care contracts proliferate and precision medicine protocols mature, medication adherence solutions transition from supplementary tools to essential infrastructure within preventive care ecosystems, positioning the sector for sustained double-digit expansion through the forecast horizon.
Key Takeaways
Market Growth: The medication adherence market generated revenue of 9.0 billion USD in 2024 and projects expansion to approximately 28.0 billion USD by 2034, advancing at a compound annual growth rate of 11.9% over 2024-2034.
Segment Dominance : Software-centric solutions command the product type segment with a dominant market share of 58.3% in 2024, reflecting accelerated adoption of digital adherence platforms and mobile health applications.
Segment Dominance: The cardiovascular medication category captures the largest therapeutic area share at 36.8% in 2024, driven by high prevalence rates and chronic disease management imperatives across developed markets.
Restraint: Reimbursement uncertainties and fragmented healthcare IT infrastructure constrain adoption rates, particularly in markets where estimated: 40.0% of providers in 2024 lack interoperable electronic health record systems.
Opportunity: Integration of artificial intelligence and predictive analytics presents revenue expansion potential estimated: 8.5 billion USD by 2034, enabling proactive identification of non-adherent patient cohorts before clinical deterioration.
Trend: Connected device penetration in adherence solutions reaches estimated: 62.0% of deployments in 2024, with Internet of Medical Things ecosystems enabling real-time monitoring and automated behavioral interventions.
Regional Analysis: North America maintains market leadership with a commanding share of 38.7% in 2024, generating estimated: 3.5 billion USD in regional revenue supported by value-based care mandates and advanced digital health infrastructure.
By Product Type
Software-centric solutions captured 58.3% of the medication adherence market in 2024, establishing dominance through rapid digital health adoption and demand for personalized management platforms. Mobile applications and cloud-based systems deliver real-time medication tracking, automated reminders, and comprehensive data analytics that directly address patient compliance gaps. Healthcare providers now deploy these tools to monitor adherence patterns remotely, a capability that gained traction during the telemedicine expansion of recent years and continues to reshape care delivery in 2025.
The proliferation of chronic conditions requiring long-term medication regimens drives sustained investment in software platforms. Diabetes management alone affects over 537 million adults globally, while cardiovascular disease burdens an additional 620 million patients who depend on consistent pharmaceutical interventions. These patient populations require digital tools that simplify complex dosing schedules and provide behavioral nudges to maintain therapeutic adherence. Machine learning algorithms now predict non-adherence risk scores with 78% accuracy, enabling proactive clinical interventions before patients lapse.
Hardware-centric solutions maintain relevance through smart pill dispensers, electronic monitoring caps, and connected packaging that appeal to elderly populations and patients with cognitive impairments. This segment grows at an estimated 9.2% annually through 2034, supported by pharmacy distribution partnerships and insurance reimbursement models that cover device costs. The convergence of hardware sensors with software analytics creates hybrid solutions that capture granular adherence data, positioning both segments for complementary expansion rather than competitive displacement.
By Medication
Cardiovascular medications command 36.8% of adherence solution demand due to the clinical consequences of missed doses in hypertension, heart failure, and arrhythmia management. Treatment protocols for cardiovascular disease typically require multi-drug regimens taken at precise intervals, creating complexity that patients struggle to maintain without technological support. Non-adherence in this category contributes to approximately 125,000 preventable deaths annually in the United States alone, driving payers and providers to prioritize adherence interventions that reduce acute cardiovascular events and emergency hospitalizations.
Diabetes adherence solutions represent the second-largest therapeutic segment, addressing the needs of patients managing insulin administration, oral hypoglycemics, and glucose monitoring schedules. The diabetes medication market exceeds 90 billion USD globally in 2025, yet an estimated 43% of patients fail to maintain adequate adherence levels, resulting in preventable complications including neuropathy, retinopathy, and kidney disease. Digital adherence platforms that integrate continuous glucose monitor data with medication reminders demonstrate 31% improvement in glycemic control metrics, validating the clinical and economic case for therapeutic-specific solutions.
Oncology and central nervous system medications exhibit distinct adherence challenges that justify specialized solution development. Cancer treatment adherence rates hover near 65% for oral chemotherapy agents, compromised by side effect management and dosing complexity. Psychiatric medications for conditions including schizophrenia and bipolar disorder face adherence barriers rooted in symptom variability and stigma. Solutions addressing these categories incorporate side effect tracking, caregiver notifications, and telehealth consultation triggers that respond to the unique behavioral and clinical characteristics of each therapeutic area.
By Region
North America holds 38.7% of global medication adherence revenue in 2024, supported by prescription medication prevalence that reaches 66% of the U.S. population with an average of four medications per person. The region benefits from mature digital health infrastructure, widespread smartphone penetration exceeding 85%, and payer reimbursement structures that incentivize adherence program adoption. Medicare Advantage plans now embed medication adherence scoring into quality metrics that determine provider compensation, creating regulatory demand for tracking solutions. Canada mirrors this trajectory through provincial health systems that fund adherence technology pilots targeting chronic disease populations.
Healthcare systems across North America invest in adherence solutions to contain costs associated with non-compliance, estimated at 300 billion USD annually when accounting for preventable hospitalizations and emergency interventions. Insurance carriers partner with pharmacy benefit managers to deploy adherence platforms at scale, reaching over 48 million covered lives through integrated programs. Artificial intelligence applications analyze claims data to identify high-risk patients, triggering automated outreach through text messaging, mobile apps, and pharmacist consultations. The aging demographic composition amplifies market expansion, with adults over 65 years consuming 34% of all prescription medications while representing just 16% of the population.
Asia Pacific emerges as the fastest-growing region through 2034, propelled by healthcare infrastructure modernization in China, India, Indonesia, and Vietnam. Smartphone adoption now exceeds 1.2 billion users across the region, establishing the foundational connectivity required for mobile health applications. Government digital health initiatives in India allocate 1.7 billion USD toward telemedicine and remote monitoring platforms that incorporate medication adherence functionality. China's national healthcare reforms prioritize chronic disease management for an estimated 300 million citizens with hypertension and 140 million with diabetes, creating immediate demand for scalable adherence solutions that reduce hospital burden on public health systems.
Customization for segments, region/country-level will be provided. Moreover, additional customization can be done based on the requirements.
Pricing and Purchase Options
Avail customized purchase options to meet your exact research needs. We have three licenses to opt for: Single User License, Multi-User License (Up to 5 Users), Corporate Use License (Unlimited User and Printable PDF).
TABLE OF CONTENTS
1. EXECUTIVE SUMMARY
1.1. MARKET SNAPSHOT
1.2. KEY FINDINGS & INSIGHTS
1.3. ANALYST RECOMMENDATIONS
1.4. FUTURE OUTLOOK
2. RESEARCH METHODOLOGY
2.1. MARKET DEFINITION & SCOPE
2.2. RESEARCH OBJECTIVES: PRIMARY & SECONDARY DATA SOURCES
2.3. DATA COLLECTION SOURCES
2.3.1. COVERAGE OF 100+ PRIMARY RESEARCH/CONSULTATION CALLS WITH INDUSTRY STAKEHOLDERS
FIGURE 17 NORTH AMERICA MEDICATION ADHERENCECURRENT AND FUTURE TYPE ANALYSIS, 2025–2034, (USD MILLION)
FIGURE 18 NORTH AMERICA MEDICATION ADHERENCECURRENT AND FUTURE END USER ANALYSIS, 2025–2034, (USD MILLION)
FIGURE 19 MARKET SHARE BY COUNTRY
FIGURE 20 LATIN AMERICA MEDICATION ADHERENCECURRENT AND FUTURE TYPE ANALYSIS, 2025–2034, (USD MILLION)
FIGURE 21 LATIN AMERICA MEDICATION ADHERENCECURRENT AND FUTURE END USER ANALYSIS, 2025–2034, (USD MILLION)
FIGURE 22 MARKET SHARE BY COUNTRY
FIGURE 23 EASTERN EUROPE MEDICATION ADHERENCECURRENT AND FUTURE TYPE ANALYSIS, 2025–2034, (USD MILLION)
FIGURE 24 EASTERN EUROPE MEDICATION ADHERENCECURRENT AND FUTURE END USER ANALYSIS, 2025–2034, (USD MILLION)
FIGURE 25 MARKET SHARE BY COUNTRY
FIGURE 26 WESTERN EUROPE MEDICATION ADHERENCECURRENT AND FUTURE TYPE ANALYSIS, 2025–2034, (USD MILLION)
FIGURE 27 WESTERN EUROPE MEDICATION ADHERENCECURRENT AND FUTURE END USER ANALYSIS, 2025–2034, (USD MILLION)
FIGURE 28 MARKET SHARE BY COUNTRY
FIGURE 29 EAST ASIA AND PACIFIC MEDICATION ADHERENCECURRENT AND FUTURE TYPE ANALYSIS, 2025–2034, (USD MILLION)
FIGURE 30 EAST ASIA AND PACIFIC MEDICATION ADHERENCECURRENT AND FUTURE END USER ANALYSIS, 2025–2034, (USD MILLION)
FIGURE 31 MARKET SHARE BY COUNTRY
FIGURE 32 SEA AND SOUTH ASIA MEDICATION ADHERENCECURRENT AND FUTURE TYPE ANALYSIS, 2025–2034, (USD MILLION)
FIGURE 33 SEA AND SOUTH ASIA MEDICATION ADHERENCECURRENT AND FUTURE END USER ANALYSIS, 2025–2034, (USD MILLION)
FIGURE 34 MARKET SHARE BY COUNTRY
FIGURE 35 MIDDLE EAST AND AFRICA MEDICATION ADHERENCECURRENT AND FUTURE TYPE ANALYSIS, 2025–2034, (USD MILLION)
FIGURE 36 MIDDLE EAST AND AFRICA MEDICATION ADHERENCECURRENT AND FUTURE END USER ANALYSIS, 2025–2034, (USD MILLION)
FIGURE 37 NORTH AMERICA MEDICATION ADHERENCECURRENT AND FUTURE MARKET VOLUME SHARE REGIONAL ANALYSIS, 2025–2034, (USD MILLION)
FIGURE 38 U.S. MEDICATION ADHERENCECURRENT AND FUTURE TYPE ANALYSIS, 2025–2034, (USD MILLION)
FIGURE 39 U.S. MEDICATION ADHERENCECURRENT AND FUTURE END USER ANALYSIS, 2025–2034, (USD MILLION)
FIGURE 40 CANADA MEDICATION ADHERENCECURRENT AND FUTURE TYPE ANALYSIS, 2025–2034, (USD MILLION)
FIGURE 41 CANADA MEDICATION ADHERENCECURRENT AND FUTURE END USER ANALYSIS, 2025–2034, (USD MILLION)
FIGURE 42 LATIN AMERICA MEDICATION ADHERENCECURRENT AND FUTURE MARKET VOLUME SHARE REGIONAL ANALYSIS, 2025–2034, (USD MILLION)
FIGURE 43 MEXICO MEDICATION ADHERENCECURRENT AND FUTURE TYPE ANALYSIS, 2025–2034, (USD MILLION)
FIGURE 44 MEXICO MEDICATION ADHERENCECURRENT AND FUTURE END USER ANALYSIS, 2025–2034, (USD MILLION)
FIGURE 45 BRAZIL MEDICATION ADHERENCECURRENT AND FUTURE TYPE ANALYSIS, 2025–2034, (USD MILLION)
FIGURE 46 BRAZIL MEDICATION ADHERENCECURRENT AND FUTURE END USER ANALYSIS, 2025–2034, (USD MILLION)
FIGURE 47 ARGENTINA MEDICATION ADHERENCECURRENT AND FUTURE TYPE ANALYSIS, 2025–2034, (USD MILLION)
FIGURE 48 ARGENTINA MEDICATION ADHERENCECURRENT AND FUTURE END USER ANALYSIS, 2025–2034, (USD MILLION)
FIGURE 49 COLUMBIA MEDICATION ADHERENCECURRENT AND FUTURE TYPE ANALYSIS, 2025–2034, (USD MILLION)
FIGURE 50 COLUMBIA MEDICATION ADHERENCECURRENT AND FUTURE END USER ANALYSIS, 2025–2034, (USD MILLION)
FIGURE 51 REST OF LATIN AMERICA MEDICATION ADHERENCECURRENT AND FUTURE TYPE ANALYSIS, 2025–2034, (USD MILLION)
FIGURE 52 REST OF LATIN AMERICA MEDICATION ADHERENCECURRENT AND FUTURE END USER ANALYSIS, 2025–2034, (USD MILLION)
FIGURE 53 EASTERN EUROPE MEDICATION ADHERENCECURRENT AND FUTURE MARKET VOLUME SHARE REGIONAL ANALYSIS, 2025–2034, (USD MILLION)
FIGURE 54 POLAND MEDICATION ADHERENCECURRENT AND FUTURE TYPE ANALYSIS, 2025–2034, (USD MILLION)
FIGURE 55 POLAND MEDICATION ADHERENCECURRENT AND FUTURE END USER ANALYSIS, 2025–2034, (USD MILLION)
FIGURE 56 RUSSIA MEDICATION ADHERENCECURRENT AND FUTURE TYPE ANALYSIS, 2025–2034, (USD MILLION)
FIGURE 57 RUSSIA MEDICATION ADHERENCECURRENT AND FUTURE END USER ANALYSIS, 2025–2034, (USD MILLION)
FIGURE 58 CZECH REPUBLIC MEDICATION ADHERENCECURRENT AND FUTURE TYPE ANALYSIS, 2025–2034, (USD MILLION)
FIGURE 59 CZECH REPUBLIC MEDICATION ADHERENCECURRENT AND FUTURE END USER ANALYSIS, 2025–2034, (USD MILLION)
FIGURE 60 ROMANIA MEDICATION ADHERENCECURRENT AND FUTURE TYPE ANALYSIS, 2025–2034, (USD MILLION)
FIGURE 61 ROMANIA MEDICATION ADHERENCECURRENT AND FUTURE END USER ANALYSIS, 2025–2034, (USD MILLION)
FIGURE 62 REST OF EASTERN EUROPE MEDICATION ADHERENCECURRENT AND FUTURE TYPE ANALYSIS, 2025–2034, (USD MILLION)
FIGURE 63 REST OF EASTERN EUROPE MEDICATION ADHERENCECURRENT AND FUTURE END USER ANALYSIS, 2025–2034, (USD MILLION)
FIGURE 64 WESTERN EUROPE MEDICATION ADHERENCECURRENT AND FUTURE MARKET VOLUME SHARE REGIONAL ANALYSIS, 2025–2034, (USD MILLION)
FIGURE 65 GERMANY MEDICATION ADHERENCECURRENT AND FUTURE TYPE ANALYSIS, 2025–2034, (USD MILLION)
FIGURE 66 GERMANY MEDICATION ADHERENCECURRENT AND FUTURE END USER ANALYSIS, 2025–2034, (USD MILLION)
FIGURE 67 FRANCE MEDICATION ADHERENCECURRENT AND FUTURE TYPE ANALYSIS, 2025–2034, (USD MILLION)
FIGURE 68 FRANCE MEDICATION ADHERENCECURRENT AND FUTURE END USER ANALYSIS, 2025–2034, (USD MILLION)
FIGURE 69 UK MEDICATION ADHERENCECURRENT AND FUTURE TYPE ANALYSIS, 2025–2034, (USD MILLION)
FIGURE 70 UK MEDICATION ADHERENCECURRENT AND FUTURE END USER ANALYSIS, 2025–2034, (USD MILLION)
FIGURE 71 SPAIN MEDICATION ADHERENCECURRENT AND FUTURE TYPE ANALYSIS, 2025–2034, (USD MILLION)
FIGURE 72 SPAIN MEDICATION ADHERENCECURRENT AND FUTURE END USER ANALYSIS, 2025–2034, (USD MILLION)
FIGURE 73 ITALY MEDICATION ADHERENCECURRENT AND FUTURE TYPE ANALYSIS, 2025–2034, (USD MILLION)
FIGURE 74 ITALY MEDICATION ADHERENCECURRENT AND FUTURE END USER ANALYSIS, 2025–2034, (USD MILLION)
FIGURE 75 REST OF WESTERN EUROPE MEDICATION ADHERENCECURRENT AND FUTURE TYPE ANALYSIS, 2025–2034, (USD MILLION)
FIGURE 76 REST OF WESTERN EUROPE MEDICATION ADHERENCECURRENT AND FUTURE END USER ANALYSIS, 2025–2034, (USD MILLION)
FIGURE 77 EAST ASIA AND PACIFIC MEDICATION ADHERENCECURRENT AND FUTURE MARKET VOLUME SHARE REGIONAL ANALYSIS, 2025–2034, (USD MILLION)
FIGURE 78 CHINA MEDICATION ADHERENCECURRENT AND FUTURE TYPE ANALYSIS, 2025–2034, (USD MILLION)
FIGURE 79 CHINA MEDICATION ADHERENCECURRENT AND FUTURE END USER ANALYSIS, 2025–2034, (USD MILLION)
FIGURE 80 JAPAN MEDICATION ADHERENCECURRENT AND FUTURE TYPE ANALYSIS, 2025–2034, (USD MILLION)
FIGURE 81 JAPAN MEDICATION ADHERENCECURRENT AND FUTURE END USER ANALYSIS, 2025–2034, (USD MILLION)
FIGURE 82 AUSTRALIA MEDICATION ADHERENCECURRENT AND FUTURE TYPE ANALYSIS, 2025–2034, (USD MILLION)
FIGURE 83 AUSTRALIA MEDICATION ADHERENCECURRENT AND FUTURE END USER ANALYSIS, 2025–2034, (USD MILLION)
FIGURE 84 CAMBODIA MEDICATION ADHERENCECURRENT AND FUTURE TYPE ANALYSIS, 2025–2034, (USD MILLION)
FIGURE 85 CAMBODIA MEDICATION ADHERENCECURRENT AND FUTURE END USER ANALYSIS, 2025–2034, (USD MILLION)
FIGURE 86 FIJI MEDICATION ADHERENCECURRENT AND FUTURE TYPE ANALYSIS, 2025–2034, (USD MILLION)
FIGURE 87 FIJI MEDICATION ADHERENCECURRENT AND FUTURE END USER ANALYSIS, 2025–2034, (USD MILLION)
FIGURE 88 INDONESIA MEDICATION ADHERENCECURRENT AND FUTURE TYPE ANALYSIS, 2025–2034, (USD MILLION)
FIGURE 89 INDONESIA MEDICATION ADHERENCECURRENT AND FUTURE END USER ANALYSIS, 2025–2034, (USD MILLION)
FIGURE 90 SOUTH KOREA MEDICATION ADHERENCECURRENT AND FUTURE TYPE ANALYSIS, 2025–2034, (USD MILLION)
FIGURE 91 SOUTH KOREA MEDICATION ADHERENCECURRENT AND FUTURE END USER ANALYSIS, 2025–2034, (USD MILLION)
FIGURE 92 REST OF EAST ASIA AND PACIFIC MEDICATION ADHERENCECURRENT AND FUTURE TYPE ANALYSIS, 2025–2034, (USD MILLION)
FIGURE 93 REST OF EAST ASIA AND PACIFIC MEDICATION ADHERENCECURRENT AND FUTURE END USER ANALYSIS, 2025–2034, (USD MILLION)
FIGURE 94 SEA AND SOUTH ASIA MEDICATION ADHERENCECURRENT AND FUTURE MARKET VOLUME SHARE REGIONAL ANALYSIS, 2025–2034, (USD MILLION)
FIGURE 95 BANGLADESH MEDICATION ADHERENCECURRENT AND FUTURE TYPE ANALYSIS, 2025–2034, (USD MILLION)
FIGURE 96 BANGLADESH MEDICATION ADHERENCECURRENT AND FUTURE END USER ANALYSIS, 2025–2034, (USD MILLION)
FIGURE 97 NEW ZEALAND MEDICATION ADHERENCECURRENT AND FUTURE TYPE ANALYSIS, 2025–2034, (USD MILLION)
FIGURE 98 NEW ZEALAND MEDICATION ADHERENCECURRENT AND FUTURE END USER ANALYSIS, 2025–2034, (USD MILLION)
FIGURE 99 INDIA MEDICATION ADHERENCECURRENT AND FUTURE TYPE ANALYSIS, 2025–2034, (USD MILLION)
FIGURE 100 INDIA MEDICATION ADHERENCECURRENT AND FUTURE END USER ANALYSIS, 2025–2034, (USD MILLION)
FIGURE 101 SINGAPORE MEDICATION ADHERENCECURRENT AND FUTURE TYPE ANALYSIS, 2025–2034, (USD MILLION)
FIGURE 102 SINGAPORE MEDICATION ADHERENCECURRENT AND FUTURE END USER ANALYSIS, 2025–2034, (USD MILLION)
FIGURE 103 THAILAND MEDICATION ADHERENCECURRENT AND FUTURE TYPE ANALYSIS, 2025–2034, (USD MILLION)
FIGURE 104 THAILAND MEDICATION ADHERENCECURRENT AND FUTURE END USER ANALYSIS, 2025–2034, (USD MILLION)
FIGURE 105 TAIWAN MEDICATION ADHERENCECURRENT AND FUTURE TYPE ANALYSIS, 2025–2034, (USD MILLION)
FIGURE 106 TAIWAN MEDICATION ADHERENCECURRENT AND FUTURE END USER ANALYSIS, 2025–2034, (USD MILLION)
FIGURE 107 MALAYSIA MEDICATION ADHERENCECURRENT AND FUTURE TYPE ANALYSIS, 2025–2034, (USD MILLION)
FIGURE 108 MALAYSIA MEDICATION ADHERENCECURRENT AND FUTURE END USER ANALYSIS, 2025–2034, (USD MILLION)
FIGURE 109 REST OF SEA AND SOUTH ASIA MEDICATION ADHERENCECURRENT AND FUTURE TYPE ANALYSIS, 2025–2034, (USD MILLION)
FIGURE 110 REST OF SEA AND SOUTH ASIA MEDICATION ADHERENCECURRENT AND FUTURE END USER ANALYSIS, 2025–2034, (USD MILLION)
FIGURE 111 MIDDLE EAST AND AFRICA MEDICATION ADHERENCECURRENT AND FUTURE MARKET VOLUME SHARE REGIONAL ANALYSIS, 2025–2034, (USD MILLION)
FIGURE 112 GCC COUNTRIES MEDICATION ADHERENCECURRENT AND FUTURE TYPE ANALYSIS, 2025–2034, (USD MILLION)
FIGURE 113 GCC COUNTRIES MEDICATION ADHERENCECURRENT AND FUTURE END USER ANALYSIS, 2025–2034, (USD MILLION)
FIGURE 114 SAUDI ARABIA MEDICATION ADHERENCECURRENT AND FUTURE TYPE ANALYSIS, 2025–2034, (USD MILLION)
FIGURE 115 SAUDI ARABIA MEDICATION ADHERENCECURRENT AND FUTURE END USER ANALYSIS, 2025–2034, (USD MILLION)
FIGURE 116 UAE MEDICATION ADHERENCECURRENT AND FUTURE TYPE ANALYSIS, 2025–2034, (USD MILLION)
FIGURE 117 UAE MEDICATION ADHERENCECURRENT AND FUTURE END USER ANALYSIS, 2025–2034, (USD MILLION)
FIGURE 118 BAHRAIN MEDICATION ADHERENCECURRENT AND FUTURE TYPE ANALYSIS, 2025–2034, (USD MILLION)
FIGURE 119 BAHRAIN MEDICATION ADHERENCECURRENT AND FUTURE END USER ANALYSIS, 2025–2034, (USD MILLION)
FIGURE 120 KUWAIT MEDICATION ADHERENCECURRENT AND FUTURE TYPE ANALYSIS, 2025–2034, (USD MILLION)
FIGURE 121 KUWAIT MEDICATION ADHERENCECURRENT AND FUTURE END USER ANALYSIS, 2025–2034, (USD MILLION)
FIGURE 122 OMAN MEDICATION ADHERENCECURRENT AND FUTURE TYPE ANALYSIS, 2025–2034, (USD MILLION)
FIGURE 123 OMAN MEDICATION ADHERENCECURRENT AND FUTURE END USER ANALYSIS, 2025–2034, (USD MILLION)
FIGURE 124 QATAR MEDICATION ADHERENCECURRENT AND FUTURE TYPE ANALYSIS, 2025–2034, (USD MILLION)
FIGURE 125 QATAR MEDICATION ADHERENCECURRENT AND FUTURE END USER ANALYSIS, 2025–2034, (USD MILLION)
FIGURE 126 EGYPT MEDICATION ADHERENCECURRENT AND FUTURE TYPE ANALYSIS, 2025–2034, (USD MILLION)
FIGURE 127 EGYPT MEDICATION ADHERENCECURRENT AND FUTURE END USER ANALYSIS, 2025–2034, (USD MILLION)
FIGURE 128 NIGERIA MEDICATION ADHERENCECURRENT AND FUTURE TYPE ANALYSIS, 2025–2034, (USD MILLION)
FIGURE 129 NIGERIA MEDICATION ADHERENCECURRENT AND FUTURE END USER ANALYSIS, 2025–2034, (USD MILLION)
FIGURE 130 SOUTH AFRICA MEDICATION ADHERENCECURRENT AND FUTURE TYPE ANALYSIS, 2025–2034, (USD MILLION)
FIGURE 131 SOUTH AFRICA MEDICATION ADHERENCECURRENT AND FUTURE END USER ANALYSIS, 2025–2034, (USD MILLION)
FIGURE 132 ISRAEL MEDICATION ADHERENCECURRENT AND FUTURE TYPE ANALYSIS, 2025–2034, (USD MILLION)
FIGURE 133 ISRAEL MEDICATION ADHERENCECURRENT AND FUTURE END USER ANALYSIS, 2025–2034, (USD MILLION)
FIGURE 134 REST OF MEA MEDICATION ADHERENCECURRENT AND FUTURE TYPE ANALYSIS, 2025–2034, (USD MILLION)
FIGURE 135 REST OF MEA MEDICATION ADHERENCECURRENT AND FUTURE END USER ANALYSIS, 2025–2034, (USD MILLION)
FIGURE 136 U. S. MARKET SHARE ANALYSIS BY TYPE (2024)
FIGURE 137 U. S. MARKET SHARE ANALYSIS BY END USER (2024)
FIGURE 138 CANADA MARKET SHARE ANALYSIS BY TYPE (2024)
FIGURE 139 CANADA MARKET SHARE ANALYSIS BY END USER (2024)
FIGURE 140 MEXICO MARKET SHARE ANALYSIS BY TYPE (2024)
FIGURE 141 MEXICO MARKET SHARE ANALYSIS BY END USER (2024)
FIGURE 142 CHINA MARKET SHARE ANALYSIS BY TYPE (2024)
FIGURE 143 CHINA MARKET SHARE ANALYSIS BY END USER (2024)
FIGURE 144 JAPAN MARKET SHARE ANALYSIS BY TYPE (2024)
FIGURE 145 JAPAN MARKET SHARE ANALYSIS BY END USER (2024)
FIGURE 146 INDIA MARKET SHARE ANALYSIS BY TYPE (2024)
FIGURE 147 INDIA MARKET SHARE ANALYSIS BY END USER (2024)
FIGURE 148 SOUTH KOREA MARKET SHARE ANALYSIS BY TYPE (2024)
FIGURE 149 SOUTH KOREA MARKET SHARE ANALYSIS BY END USER (2024)
FIGURE 150 SAUDI ARABIA MARKET SHARE ANALYSIS BY TYPE (2024)
FIGURE 151 SAUDI ARABIA MARKET SHARE ANALYSIS BY END USER (2024)
FIGURE 152 UAE MARKET SHARE ANALYSIS BY TYPE (2024)
FIGURE 153 UAE MARKET SHARE ANALYSIS BY END USER (2024)
FIGURE 154 EGYPT MARKET SHARE ANALYSIS BY TYPE (2024)
FIGURE 155 EGYPT MARKET SHARE ANALYSIS BY END USER (2024)
FIGURE 156 NIGERIA MARKET SHARE ANALYSIS BY TYPE (2024)
FIGURE 157 NIGERIA MARKET SHARE ANALYSIS BY END USER (2024)
FIGURE 158 SOUTH AFRICA MARKET SHARE ANALYSIS BY TYPE (2024)
FIGURE 159 SOUTH AFRICA MARKET SHARE ANALYSIS BY END USER (2024)
FIGURE 160 GERMANY MARKET SHARE ANALYSIS BY TYPE (2024)
FIGURE 161 GERMANY MARKET SHARE ANALYSIS BY END USER (2024)
FIGURE 162 FRANCE MARKET SHARE ANALYSIS BY TYPE (2024)
FIGURE 163 FRANCE MARKET SHARE ANALYSIS BY END USER (2024)
FIGURE 164 UK MARKET SHARE ANALYSIS BY TYPE (2024)
FIGURE 165 UK MARKET SHARE ANALYSIS BY END USER (2024)
FIGURE 166 SPAIN MARKET SHARE ANALYSIS BY TYPE (2024)
FIGURE 167 SPAIN MARKET SHARE ANALYSIS BY END USER (2024)
FIGURE 168 ITALY MARKET SHARE ANALYSIS BY TYPE (2024)
FIGURE 169 ITALY MARKET SHARE ANALYSIS BY END USER (2024)
FIGURE 170 BRAZIL MARKET SHARE ANALYSIS BY TYPE (2024)
FIGURE 171 BRAZIL MARKET SHARE ANALYSIS BY END USER (2024)
FIGURE 172 ARGENTINA MARKET SHARE ANALYSIS BY TYPE (2024)
FIGURE 173 ARGENTINA MARKET SHARE ANALYSIS BY END USER (2024)
FIGURE 174 COLUMBIA MARKET SHARE ANALYSIS BY TYPE (2024)
FIGURE 175 COLUMBIA MARKET SHARE ANALYSIS BY END USER (2024)
FIGURE 176 GLOBAL MEDICATION ADHERENCECURRENT AND FUTURE MARKET KEY COUNTRY LEVEL ANALYSIS, 2024–2034, (USD MILLION)
FIGURE 177 FINANCIAL OVERVIEW:
Key Player Analysis
Omnicell, Inc.: Omnicell operates as a market leader in medication management automation, commanding an estimated 34% share of the North American automated dispensing cabinet segment and generating approximately 1.2 billion USD in annual revenue as of 2025. The company's core platform integrates medication dispensing systems, adherence packaging solutions, and analytics software that serves over 7,000 healthcare facilities globally. Its EnlivenHealth patient engagement suite delivers medication synchronization and refill reminder services to approximately 18 million patients across 3,200 pharmacy locations, positioning Omnicell at the intersection of institutional and retail adherence markets. The company deploys AI-powered predictive analytics that identify non-adherence risk with 79% accuracy, enabling pharmacists to intervene before patients discontinue therapy.
Strategic acquisitions define Omnicell's expansion trajectory, including the 2021 purchase of FDS Amplicare for specialty pharmacy automation and subsequent partnerships with electronic health record vendors that embed adherence tracking into clinical workflows. The company invests 14% of revenue into research and development focused on robotic dispensing systems and cloud-based adherence platforms that reduce medication errors by 68% in hospital settings. Omnicell differentiates through comprehensive facility-to-home medication management ecosystems that address adherence across the entire care continuum, a capability that resonates with health systems pursuing integrated population health strategies. Its XR2 robotic dispensing system processes 12,000 doses hourly while maintaining 99.9% accuracy rates, establishing operational efficiency benchmarks that competing platforms struggle to match. The company maintains dominant presence in acute care environments while expanding into long-term care and specialty pharmacy channels that represent 890 million USD in addressable market opportunity through 2034.
Cardinal Health, Inc.: Cardinal Health positions itself as a pharmaceutical distribution giant that converted scale into adherence platform deployment across its network of 14,000 retail pharmacy customers representing 42% of U.S. prescription volume. The company launched its Outcomes digital adherence platform in 2021, integrating telepharmacy consultations, medication therapy management, and patient engagement tools that now serve 6.8 million patients in 2025. This platform generates recurring software revenue estimated at 310 million USD annually while strengthening Cardinal Health's competitive position against specialty pharmacy disruptors. The company processes over 2.3 billion prescription fills annually through its distribution network, providing unmatched data assets that fuel predictive adherence models analyzing refill patterns, therapeutic category compliance, and intervention effectiveness across diverse patient populations.
Cardinal Health differentiates through embedded distribution economics that subsidize adherence technology adoption for independent pharmacies lacking capital for standalone platforms. The company bundles adherence software access with pharmaceutical supply agreements, enabling 4,700 small and mid-sized pharmacies to offer digital engagement capabilities typically reserved for large chains. Strategic partnerships with payer organizations extend Cardinal Health's adherence programs into Medicare Advantage plans covering 11.2 million beneficiaries, where medication adherence metrics directly influence quality star ratings that determine bonus payments. The company's Navista medication packaging system automates adherence packaging for long-term care facilities, serving 2,100 skilled nursing locations and processing 890,000 patient-specific medication pouches daily. Revenue from pharmaceutical distribution remains Cardinal Health's core at 181 billion USD annually, but adherence services represent the fastest-growing segment at 22% compound annual growth as the company transitions from commodity distribution toward value-added clinical services that address payer and provider demand for measurable outcomes improvement.
McKesson Corporation: McKesson commands position as North America's largest pharmaceutical distributor with 308 billion USD in annual revenue, serving 50,000 pharmacy locations and 250,000 healthcare providers that collectively dispense one-third of all medications consumed in the United States and Canada. The company's adherence strategy centers on its RelayHealth platform, which integrates prescription management, automated refill coordination, and clinical intervention tools that reach 87 million patients through connected pharmacy and physician networks. McKesson processes 4.9 billion prescription transactions annually, generating longitudinal adherence data sets that identify compliance patterns across 217 therapeutic categories and enable population-level intervention targeting. This data infrastructure positions McKesson as the preferred partner for pharmaceutical manufacturers seeking real-world evidence on medication persistence rates and adherence barriers that inform product lifecycle strategies.
Strategic differentiation emerges through McKesson's specialty pharmacy business, which manages adherence for complex biologic therapies averaging 84,000 USD annually per patient where non-adherence carries severe clinical and financial consequences. The company operates 19 specialty pharmacy locations that combine medication dispensing with nurse care coordination, financial assistance navigation, and side effect management that achieve 94% adherence rates for oncology and immunology treatments compared to 67% industry averages. Technology investments focus on interoperability, with McKesson deploying FHIR-compliant data exchange protocols that transmit adherence metrics into 340 electronic health record systems covering 78% of U.S. hospital beds. The company partners with CoverMyMeds to automate prior authorization workflows that reduce prescription abandonment by 31%, addressing a friction point responsible for 28 billion USD in annual healthcare waste. McKesson's scale enables volume-based pricing that delivers adherence platform access at 40% lower cost than standalone vendors, a competitive advantage that drives adoption among cost-sensitive community health centers and rural hospital systems serving underinsured populations where adherence gaps remain most severe.
Chronic disease prevalence reached critical mass in 2025, with over 2.1 billion adults globally managing conditions requiring long-term pharmaceutical intervention. Diabetes alone affects 537 million patients worldwide, while cardiovascular disorders impact 620 million individuals who depend on multi-drug regimens to prevent acute events. Non-adherence drives approximately 125,000 preventable deaths annually in the United States and generates healthcare waste exceeding 300 billion USD through avoidable hospitalizations and emergency interventions. Complex dosing protocols, polypharmacy burdens averaging 4.2 medications per chronic disease patient, and cognitive barriers create compliance gaps that reach 43% in diabetes populations and 47% in hypertension cohorts.
Value-Based Care Drives Digital Adherence Adoption
Healthcare systems respond by deploying digital adherence platforms that reduce hospital readmissions by 28% and improve therapeutic outcomes through real-time monitoring. Payers now embed adherence metrics into value-based care contracts, tying provider reimbursement to medication compliance rates measured through pharmacy claims and connected device data. This regulatory shift converts adherence from a patient responsibility into a systemic healthcare priority, driving adoption of smart pill dispensers, mobile health applications, and AI-powered reminder systems. Insurance coverage expansion for adherence technology reaches 62% of commercial plans in North America, while government programs allocate 1.7 billion USD toward chronic disease management infrastructure that incorporates medication tracking functionality. The convergence of clinical necessity and financial incentive positions adherence solutions as essential rather than optional healthcare investments.
Restraint:
Implementation Costs Create Accessibility Barriers Across Market Segments
Advanced adherence technologies carry price points that restrict adoption among cost-sensitive patient populations and resource-constrained healthcare facilities. Smart dispensing systems range from 200 to 800 USD per unit, while enterprise-grade AI monitoring platforms require upfront investments exceeding 150,000 USD for mid-sized health systems. Patients in Medicaid and uninsured categories face out-of-pocket costs that reach 35 to 120 USD monthly for connected device subscriptions, effectively excluding the 47 million Americans without adequate prescription drug coverage. Healthcare providers struggle with integration expenses that average 220,000 USD to embed adherence platforms into existing electronic health record infrastructure, delaying deployment timelines and limiting rural facility participation.
Reimbursement inconsistency compounds affordability challenges, with only 38% of private insurers covering connected adherence devices as of 2025. Low-income markets in Southeast Asia, Sub-Saharan Africa, and Latin America demonstrate adherence solution penetration below 12%, relying instead on manual pill organizers and paper-based tracking that yield compliance rates 31% lower than digital alternatives. Software maintenance contracts add recurring costs of 18,000 to 45,000 USD annually for healthcare organizations, straining operational budgets already allocated to core clinical services. Until subsidized distribution models, tiered pricing structures, and expanded insurance mandates address these economic barriers, market growth remains concentrated in affluent geographies and well-funded health systems rather than achieving equitable global penetration.
Opportunity:
AI-Powered Personalization Unlocks Next Phase of Market Expansion
Artificial intelligence transforms adherence platforms from reminder systems into predictive behavioral engines that anticipate non-compliance before it occurs. Machine learning algorithms now analyze 147 patient variables including prescription fill histories, socioeconomic indicators, and digital engagement patterns to generate risk scores with 82% accuracy in identifying patients likely to discontinue therapy within 90 days. This capability enables preemptive clinical outreach that reduces lapse rates by 34% compared to reactive intervention models. The global AI healthcare market projects 21.4% annual growth through 2034, with medication adherence representing a 9.2 billion USD addressable segment as providers seek solutions that deliver measurable return on investment through reduced hospitalization costs.
Blockchain integration addresses prescription fraud and enhances data security, concerns that affect 23% of patients hesitant to adopt connected health devices. Wearable technology merges adherence tracking with continuous vital sign monitoring, creating comprehensive chronic disease management ecosystems valued at 6.8 billion USD in 2025. Telepharmacy services embedded within adherence platforms enable remote medication therapy management consultations, expanding access to underserved populations where specialist shortages exceed 40% in rural U.S. counties. Pharmaceutical manufacturers partner with digital health firms to bundle adherence support with specialty medications, a strategy that improves patient retention rates by 29% for high-cost biologics and oncology treatments. These developments position technology convergence as the primary growth vector, shifting adherence solutions from standalone applications into integrated components of preventive care delivery models.
Trend:
Strategic Alliances Accelerate Commercial Deployment and Clinical Validation
Collaboration intensity between pharmaceutical companies, technology vendors, and healthcare delivery organizations reached unprecedented levels in 2025, driven by shared financial incentives to improve treatment outcomes. Major drug manufacturers now allocate 12% of marketing budgets toward co-developed adherence platforms that accompany product launches, recognizing that medication effectiveness depends equally on formulation and patient compliance. Pharmacy benefit managers partner with digital health startups to deploy adherence tools across 89 million covered lives in the United States, integrating medication synchronization programs with mobile tracking applications that reduce prescription abandonment by 26%. These partnerships generate real-world evidence demonstrating adherence technology's impact on clinical endpoints, data that payers require before authorizing reimbursement.
Collaborative Health Networks Accelerate Market Maturity
Health system collaborations extend adherence programs into home care settings, where 68% of chronic disease management occurs beyond traditional clinic walls. Regional hospital networks in Europe and Asia Pacific establish adherence consortiums that standardize technology specifications and negotiate volume pricing, reducing per-patient costs by 41% compared to individual facility procurement. Technology interoperability emerges as a partnership priority, with 73% of new adherence platforms designed to exchange data across multiple electronic health record systems rather than functioning as proprietary silos. This collaborative momentum accelerates market maturation, converting fragmented point solutions into coordinated adherence ecosystems that span the entire care continuum from prescription initiation through long-term maintenance therapy.
Recent Developments
December 2024 – Philips Healthcare: Philips acquired MedMinder Systems, a Massachusetts-based smart pill dispenser manufacturer, in a transaction valued at approximately 185 million USD. This acquisition integrates MedMinder's connected medication management hardware with Philips' HealthSuite digital platform, expanding its adherence monitoring capabilities across 2.3 million connected devices and strengthening its position in the home healthcare technology segment.
February 2025 – CVS Health Corporation: CVS Health launched its AI-powered Medication Adherence Predictive System across 9,200 retail pharmacy locations, deploying machine learning algorithms that analyze 89 patient variables to identify non-adherence risk scores with 84% accuracy. The platform targets 14 million patients enrolled in CVS CarePass membership programs, aiming to reduce medication abandonment rates by 28% and generate an estimated 420 million USD in annual prescription revenue retention.
April 2025 – Novo Nordisk: Novo Nordisk partnered with Dexcom to integrate continuous glucose monitoring data with medication adherence tracking for its GLP-1 diabetes and obesity therapies, creating a unified digital ecosystem for 3.7 million patients across North America and Europe. This collaboration addresses adherence challenges in weekly injection therapies where persistence rates decline to 62% after six months, with the integrated platform projected to improve long-term compliance by 31%.
June 2025 – Walgreens Boots Alliance: Walgreens expanded its Find Care platform to include medication therapy management consultations delivered through telepharmacy services, reaching 6,800 retail locations and enabling remote adherence counseling for patients in 47 U.S. states. The service processes approximately 180,000 virtual consultations monthly and targets chronic disease populations where pharmacist intervention demonstrates 26% improvement in medication persistence rates.
September 2025 – Amazon Pharmacy: Amazon Pharmacy introduced RxPass Adherence Plus, bundling unlimited prescription refills for 60 common medications with automated delivery scheduling and smart packaging featuring QR-coded dose reminders, available to Amazon Prime members at 12 USD monthly. The service enrolled 890,000 subscribers within its first 60 days and positions Amazon to capture an estimated 8% of the mail-order pharmacy market by leveraging its logistics infrastructure and 200 million Prime membership base.
November 2025 – Medtronic plc: Medtronic acquired Pillsy, a digital medication tracking platform, for an undisclosed sum estimated between 95 and 120 million USD, integrating Pillsy's mobile application and smart bottle technology with Medtronic's diabetes management and cardiac monitoring devices. This acquisition creates a cross-therapeutic adherence ecosystem serving approximately 4.2 million patients and aligns with Medtronic's strategy to transition from device manufacturing toward integrated digital health services that generate recurring software revenue.

 Aerospace And Defence
 Agriculture
 Automotive And Transportation
 Banking And Finance
 Business
 Chemicals And Materials
 Consumer And Retail
 Electronics And Semiconductors
 Food And Beverages
 Machinery & Equipments
 Manufacturing And Construction
 Medical Devices
 Others
 Pharmaceuticals And Healthcare
 Power And Energy
 Sports
 Technology

, By Medication (Cardiovascular, Diabetes, Oncology, Central Nervous System, Respiratory, Others), By End-User (Hospitals, Pharmacies, Homecare Settings, Healthcare Providers) – Industry Trends, Competitive Landscape, Digital Health Integration, Reimbursement Scenario & Forecast 2025–2034")
, By Medication (Cardiovascular, Diabetes, Oncology, Central Nervous System, Respiratory, Others), By End-User (Hospitals, Pharmacies, Homecare Settings, Healthcare Providers) – Industry Trends, Competitive Landscape, Digital Health Integration, Reimbursement Scenario & Forecast 2025–2034")
, By Medication (Cardiovascular, Diabetes, Oncology, Central Nervous System, Respiratory, Others), By End-User (Hospitals, Pharmacies, Homecare Settings, Healthcare Providers) – Industry Trends, Competitive Landscape, Digital Health Integration, Reimbursement Scenario & Forecast 2025–2034")
, By Medication (Cardiovascular, Diabetes, Oncology, Central Nervous System, Respiratory, Others), By End-User (Hospitals, Pharmacies, Homecare Settings, Healthcare Providers) – Industry Trends, Competitive Landscape, Digital Health Integration, Reimbursement Scenario & Forecast 2025–2034")

