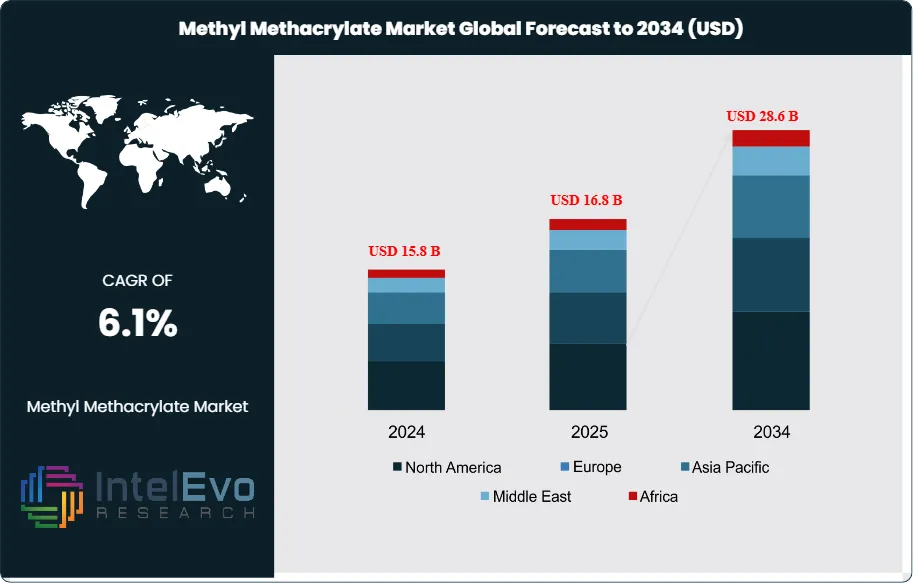
The Methyl Methacrylate (MMA) market is estimated at USD 15.8 billion in 2024 and is projected to reach approximately USD 28.6 billion by 2034, registering a compound annual growth rate (CAGR) of about 6.1% during 2025–2034. This steady expansion is driven by rising demand for PMMA in construction, automotive, electronics, and signage applications, where lightweight, transparency, and durability are critical performance attributes. Ongoing infrastructure development, growth in electric vehicles, and increased use of acrylic sheets as glass substitutes are further supporting market momentum, while capacity additions and bio-based MMA innovations are shaping long-term industry competitiveness.
This growth reflects the expanding role of MMA as a critical feedstock for polymethyl methacrylate (PMMA) resins and plastics, which are widely used in automotive, construction, electronics, and medical applications. Demand has steadily increased over the past decade, supported by rising consumption of lightweight and durable materials, and the market is expected to maintain a strong upward trajectory as industries prioritize performance, safety, and sustainability.
On the demand side, the automotive and construction sectors remain the largest consumers, accounting for more than 55% of global MMA usage in 2023. The shift toward lightweight vehicles and energy-efficient buildings is accelerating adoption of PMMA-based products. Supply-side dynamics are shaped by capacity expansions and integration strategies among leading producers. However, volatility in raw material prices, particularly acetone and hydrogen cyanide, continues to pose risks to margins. Regulatory pressures are also reshaping the industry. In Europe, the MMAtwo project aims to recycle 27,000 tons of PMMA waste annually into 12,250 tons of recycled MMA, signaling a clear move toward circular production models.
Technological advances are influencing production methods. The acetone cyanohydrin (ACH) process remains dominant, but alternative routes with lower environmental impact are gaining traction. Companies are investing in process efficiency, digital monitoring, and automation to reduce costs and emissions. These developments align with broader sustainability targets and are expected to influence investment decisions across the value chain.
Regionally, Asia-Pacific leads the global market, accounting for over 45% of total consumption in 2023. China and South Korea dominate both production and exports, supported by large-scale manufacturing bases and access to raw materials. North America and Europe remain significant markets, driven by demand in automotive coatings, medical devices, and construction materials, while emerging economies in Southeast Asia and the Middle East are becoming attractive investment destinations due to rapid industrialization and infrastructure growth.
For investors, the MMA market presents opportunities in recycling technologies, capacity expansions in Asia-Pacific, and specialty-grade applications in healthcare and electronics. The combination of regulatory momentum, technological progress, and expanding end-use industries positions the market for sustained growth through 2034.
Key Takeaways
Market Growth: The global Methyl Methacrylate (MMA) market is valued at USD 15.8 billion in 2024 and is projected to reach USD 28.6 billion by 2034, expanding at a CAGR of 6.1%. Growth is driven by rising demand for lightweight materials in automotive, construction, and electronics.
By Raw Material: Acetone-based production accounts for 45.6% of the market in 2023, supported by the cost efficiency of the acetone cyanohydrin (ACH) process and its established supply chain.
By Application: Chemical intermediates represent 34.5% of global demand, reflecting MMA’s critical role in producing coatings, adhesives, and specialty resins.
By End Use: The buildings and construction sector holds 43.3% of consumption, with PMMA products favored for weather resistance, durability, and architectural aesthetics.
By Distribution Channel: Indirect sales channels, including distributors and online platforms, account for 55.3% of total sales, highlighting the importance of established networks in reaching industrial buyers.
Driver: Expanding automotive production, particularly in Asia-Pacific, is accelerating demand for PMMA-based coatings and glazing. Lightweight plastics contribute to fuel efficiency, with automotive applications expected to grow at over 7% CAGR through 2033.
Restraint: Volatility in raw material prices, especially acetone and hydrogen cyanide, continues to pressure producer margins. Feedstock fluctuations have historically impacted profitability by up to 10–15% annually.
Opportunity: Recycling initiatives, such as Europe’s MMAtwo project, are creating new revenue streams. The program targets recovery of 12,250 tons of recycled MMA annually, positioning circular production as a high-growth segment.
Trend: Producers are investing in sustainable production technologies. Alternative processes with lower emissions are gaining traction, with leading companies piloting bio-based MMA routes to align with regulatory and ESG requirements.
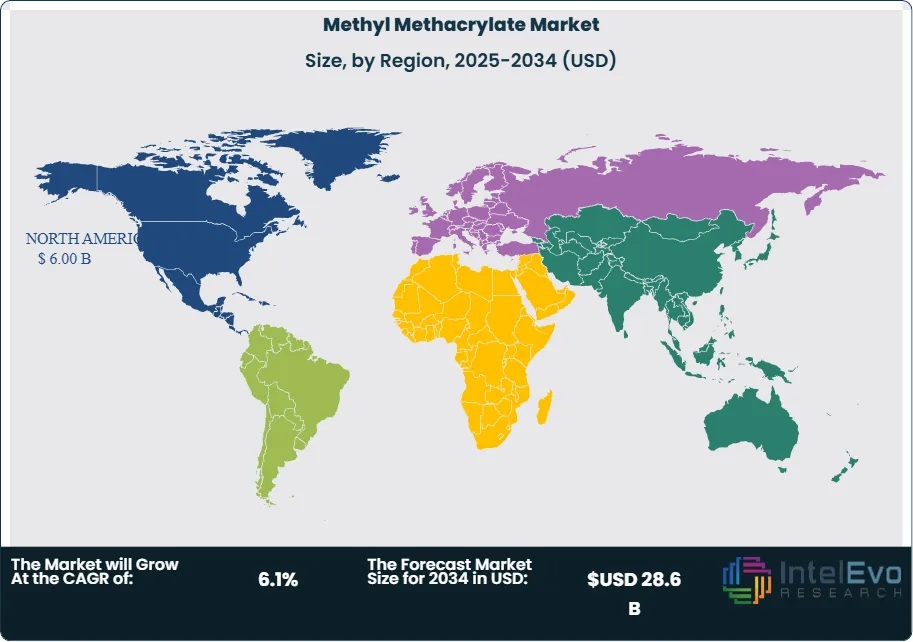
Regional Analysis: North America leads with a 40.6% share in 2023, supported by strong demand in automotive and construction. Asia-Pacific is the fastest-growing region, projected to expand above 7% CAGR, driven by industrialization in China, India, and Southeast Asia. Europe remains a key hub for recycling and sustainability-focused investments.
Type Analysis
By 2025, the Methyl Methacrylate (MMA) market continues to show clear preferences across feedstock types, with acetone maintaining its dominant role. Acetone-based production, primarily through the acetone cyanohydrin (ACH) process, accounts for more than 45% of global supply. Its cost efficiency and widespread availability make it the preferred route in regions with strong acetone production capacity, particularly in Asia-Pacific and North America. This pathway remains central to large-scale MMA output, despite rising interest in alternative methods.
Ethylene-based production is gaining traction due to its ability to deliver high-purity MMA, which is critical for advanced applications such as optical-grade plastics and specialty coatings. Although it represents a smaller share compared to acetone, demand for ethylene-derived MMA is expected to grow at a CAGR above 6% through 2030, supported by investments in high-performance materials. Methanol also plays a supporting role in the ACH process, offering flexibility in raw material sourcing and helping producers mitigate feedstock price volatility.
Isobutylene-based production remains a niche but strategically important segment. Facilities with access to isobutylene as a byproduct of petrochemical operations are increasingly adopting this route to reduce costs and improve integration. While its market share is below 10%, the process is expected to expand in regions with strong refining and petrochemical clusters, particularly in the Middle East and parts of Asia.
Application Analysis
Chemical intermediates remain the largest application segment, accounting for more than 34% of global MMA demand in 2025. MMA’s role as a precursor to polymethyl methacrylate (PMMA) underpins its importance in automotive, construction, and electronics. Rising demand for lightweight plastics and transparent materials continues to reinforce this segment’s dominance.
Surface coatings represent another major application, with MMA-based formulations widely used in automotive paints, architectural coatings, and industrial finishes. Their weather resistance and durability make them essential for long-life performance in both infrastructure and vehicles. This segment is projected to grow steadily at around 6% CAGR, supported by construction activity in Asia-Pacific and refurbishment demand in developed markets.
Emulsion polymers, used in adhesives, sealants, and specialty paints, are also expanding. MMA enhances bonding strength and durability, making it a preferred additive in consumer and industrial products. With rising demand for water-based and low-VOC formulations, MMA’s role in emulsion polymers is expected to strengthen, particularly in Europe and North America where environmental regulations are stringent.
End-Use Analysis
The buildings and construction sector continues to dominate MMA consumption, representing over 43% of global demand in 2025. PMMA-based products are widely used in windows, panels, and decorative materials due to their clarity, strength, and weather resistance. Infrastructure development in Asia-Pacific and green building initiatives in Europe are expected to sustain growth in this segment.
The automotive industry is another critical end-use, with MMA used in light covers, trims, and coatings. As automakers pursue weight reduction and energy efficiency, MMA-based plastics are increasingly replacing heavier materials. The sector is forecast to grow at more than 7% CAGR through 2030, driven by electric vehicle adoption and demand for advanced coatings.
Electronics and paints and coatings also represent significant demand centers. MMA is used in display screens, optical components, and protective coatings for consumer electronics. In paints and coatings, MMA-based formulations are valued for their durability and finish, with applications spanning residential, commercial, and industrial projects. Together, these segments account for nearly one-third of global MMA consumption.
Regional Analysis
North America remains a leading market, accounting for more than 40% of global MMA revenues in 2025, valued at over USD 6 billion. Strong demand from automotive, construction, and electronics industries in the United States and Canada underpins this position. The region also benefits from advanced manufacturing capabilities and ongoing investments in sustainable production technologies.
Europe continues to expand steadily, supported by demand in automotive and construction. Germany, France, and the United Kingdom are key contributors, with regulatory emphasis on recycling and green materials driving adoption. Initiatives such as the MMAtwo project highlight Europe’s focus on circular production, which is expected to reshape supply chains over the next decade.
Asia-Pacific is the fastest-growing region, projected to expand at a CAGR above 7% through 2030. China, India, Japan, and South Korea are leading demand, driven by rapid urbanization, infrastructure development, and strong electronics manufacturing bases. The region’s large-scale industrialization and government-backed infrastructure projects make it the most attractive investment destination for MMA producers.
Latin America and the Middle East & Africa represent smaller but growing markets. Brazil and Mexico lead demand in Latin America, supported by construction and automotive production. In the Middle East, countries such as Saudi Arabia and the UAE are investing heavily in petrochemical integration and infrastructure, creating opportunities for MMA expansion. While their combined share is below 15%, both regions are expected to post above-average growth rates through 2030.
By Feedstock (Acetone, Ethylene, Methanol, Isobutylene, Others), By Application (Chemical Intermediate, Surface Coatings, Emulsion Polymer, Others), By End-Use (Buildings & Construction, Automotive, Electronics, Paints & Coatings, Others), By Distribution Channel (Direct Sales, Indirect Sales)
Research Methodology
Primary Research- 100 Interviews of Stakeholders
Secondary Research
Desk Research
Regional scope
North America (United States, Canada, Mexico)
Latin America (Brazil, Argentina, Columbia)
East Asia And Pacific (China, Japan, South Korea, Australia, Cambodia, Fiji, Indonesia)
Sea And South Asia (India, Singapore, Thailand, Taiwan, Malaysia)
Eastern Europe (Poland, Russia, Czech Republic, Romania)
Western Europe (Germany, U.K., France, Spain, Itlay)
Middle East & Africa (GCC Countries, Egypt, Nigeria, South Africa, Israel)
Competitive Landscape
DuPont Inc, Kuraray Group, Arkema, Monómeros del Vallés S.L., Huntsman Corporation, BASF SE, LG Chem, Kowa India Pvt. Ltd., Evonik Industries AG, Heilongjiang Zhongmeng Longxin Chemical Co., Ltd., Lucite International, Dhalop Chemicals, Asahi Kasei Corporation,
Customization Scope
Customization for segments, region/country-level will be provided. Moreover, additional customization can be done based on the requirements.
Pricing and Purchase Options
Avail customized purchase options to meet your exact research needs. We have three licenses to opt for: Single User License, Multi-User License (Up to 5 Users), Corporate Use License (Unlimited User and Printable PDF).
TABLE OF CONTENTS
1. EXECUTIVE SUMMARY
1.1. MARKET SNAPSHOT
1.2. KEY FINDINGS & INSIGHTS
1.3. ANALYST RECOMMENDATIONS
1.4. FUTURE OUTLOOK
2. RESEARCH METHODOLOGY
2.1. MARKET DEFINITION & SCOPE
2.2. RESEARCH OBJECTIVES: PRIMARY & SECONDARY DATA SOURCES
2.3. DATA COLLECTION SOURCES
2.3.1. COVERAGE OF 100+ PRIMARY RESEARCH/CONSULTATION CALLS WITH INDUSTRY STAKEHOLDERS
FIGURE 17 NORTH AMERICA METHYL METHACRYLATE CURRENT AND FUTURE TYPE ANALYSIS, 2025–2034, (USD MILLION)
FIGURE 18 NORTH AMERICA METHYL METHACRYLATE CURRENT AND FUTURE END USER ANALYSIS, 2025–2034, (USD MILLION)
FIGURE 19 MARKET SHARE BY COUNTRY
FIGURE 20 LATIN AMERICA METHYL METHACRYLATE CURRENT AND FUTURE TYPE ANALYSIS, 2025–2034, (USD MILLION)
FIGURE 21 LATIN AMERICA METHYL METHACRYLATE CURRENT AND FUTURE END USER ANALYSIS, 2025–2034, (USD MILLION)
FIGURE 22 MARKET SHARE BY COUNTRY
FIGURE 23 EASTERN EUROPE METHYL METHACRYLATE CURRENT AND FUTURE TYPE ANALYSIS, 2025–2034, (USD MILLION)
FIGURE 24 EASTERN EUROPE METHYL METHACRYLATE CURRENT AND FUTURE END USER ANALYSIS, 2025–2034, (USD MILLION)
FIGURE 25 MARKET SHARE BY COUNTRY
FIGURE 26 WESTERN EUROPE METHYL METHACRYLATE CURRENT AND FUTURE TYPE ANALYSIS, 2025–2034, (USD MILLION)
FIGURE 27 WESTERN EUROPE METHYL METHACRYLATE CURRENT AND FUTURE END USER ANALYSIS, 2025–2034, (USD MILLION)
FIGURE 28 MARKET SHARE BY COUNTRY
FIGURE 29 EAST ASIA AND PACIFIC METHYL METHACRYLATE CURRENT AND FUTURE TYPE ANALYSIS, 2025–2034, (USD MILLION)
FIGURE 30 EAST ASIA AND PACIFIC METHYL METHACRYLATE CURRENT AND FUTURE END USER ANALYSIS, 2025–2034, (USD MILLION)
FIGURE 31 MARKET SHARE BY COUNTRY
FIGURE 32 SEA AND SOUTH ASIA METHYL METHACRYLATE CURRENT AND FUTURE TYPE ANALYSIS, 2025–2034, (USD MILLION)
FIGURE 33 SEA AND SOUTH ASIA METHYL METHACRYLATE CURRENT AND FUTURE END USER ANALYSIS, 2025–2034, (USD MILLION)
FIGURE 34 MARKET SHARE BY COUNTRY
FIGURE 35 MIDDLE EAST AND AFRICA METHYL METHACRYLATE CURRENT AND FUTURE TYPE ANALYSIS, 2025–2034, (USD MILLION)
FIGURE 36 MIDDLE EAST AND AFRICA METHYL METHACRYLATE CURRENT AND FUTURE END USER ANALYSIS, 2025–2034, (USD MILLION)
FIGURE 37 NORTH AMERICA METHYL METHACRYLATE CURRENT AND FUTURE MARKET VOLUME SHARE REGIONAL ANALYSIS, 2025–2034, (USD MILLION)
FIGURE 38 U.S. METHYL METHACRYLATE CURRENT AND FUTURE TYPE ANALYSIS, 2025–2034, (USD MILLION)
FIGURE 39 U.S. METHYL METHACRYLATE CURRENT AND FUTURE END USER ANALYSIS, 2025–2034, (USD MILLION)
FIGURE 40 CANADA METHYL METHACRYLATE CURRENT AND FUTURE TYPE ANALYSIS, 2025–2034, (USD MILLION)
FIGURE 41 CANADA METHYL METHACRYLATE CURRENT AND FUTURE END USER ANALYSIS, 2025–2034, (USD MILLION)
FIGURE 42 LATIN AMERICA METHYL METHACRYLATE CURRENT AND FUTURE MARKET VOLUME SHARE REGIONAL ANALYSIS, 2025–2034, (USD MILLION)
FIGURE 43 MEXICO METHYL METHACRYLATE CURRENT AND FUTURE TYPE ANALYSIS, 2025–2034, (USD MILLION)
FIGURE 44 MEXICO METHYL METHACRYLATE CURRENT AND FUTURE END USER ANALYSIS, 2025–2034, (USD MILLION)
FIGURE 45 BRAZIL METHYL METHACRYLATE CURRENT AND FUTURE TYPE ANALYSIS, 2025–2034, (USD MILLION)
FIGURE 46 BRAZIL METHYL METHACRYLATE CURRENT AND FUTURE END USER ANALYSIS, 2025–2034, (USD MILLION)
FIGURE 47 ARGENTINA METHYL METHACRYLATE CURRENT AND FUTURE TYPE ANALYSIS, 2025–2034, (USD MILLION)
FIGURE 48 ARGENTINA METHYL METHACRYLATE CURRENT AND FUTURE END USER ANALYSIS, 2025–2034, (USD MILLION)
FIGURE 49 COLUMBIA METHYL METHACRYLATE CURRENT AND FUTURE TYPE ANALYSIS, 2025–2034, (USD MILLION)
FIGURE 50 COLUMBIA METHYL METHACRYLATE CURRENT AND FUTURE END USER ANALYSIS, 2025–2034, (USD MILLION)
FIGURE 51 REST OF LATIN AMERICA METHYL METHACRYLATE CURRENT AND FUTURE TYPE ANALYSIS, 2025–2034, (USD MILLION)
FIGURE 52 REST OF LATIN AMERICA METHYL METHACRYLATE CURRENT AND FUTURE END USER ANALYSIS, 2025–2034, (USD MILLION)
FIGURE 53 EASTERN EUROPE METHYL METHACRYLATE CURRENT AND FUTURE MARKET VOLUME SHARE REGIONAL ANALYSIS, 2025–2034, (USD MILLION)
FIGURE 54 POLAND METHYL METHACRYLATE CURRENT AND FUTURE TYPE ANALYSIS, 2025–2034, (USD MILLION)
FIGURE 55 POLAND METHYL METHACRYLATE CURRENT AND FUTURE END USER ANALYSIS, 2025–2034, (USD MILLION)
FIGURE 56 RUSSIA METHYL METHACRYLATE CURRENT AND FUTURE TYPE ANALYSIS, 2025–2034, (USD MILLION)
FIGURE 57 RUSSIA METHYL METHACRYLATE CURRENT AND FUTURE END USER ANALYSIS, 2025–2034, (USD MILLION)
FIGURE 58 CZECH REPUBLIC METHYL METHACRYLATE CURRENT AND FUTURE TYPE ANALYSIS, 2025–2034, (USD MILLION)
FIGURE 59 CZECH REPUBLIC METHYL METHACRYLATE CURRENT AND FUTURE END USER ANALYSIS, 2025–2034, (USD MILLION)
FIGURE 60 ROMANIA METHYL METHACRYLATE CURRENT AND FUTURE TYPE ANALYSIS, 2025–2034, (USD MILLION)
FIGURE 61 ROMANIA METHYL METHACRYLATE CURRENT AND FUTURE END USER ANALYSIS, 2025–2034, (USD MILLION)
FIGURE 62 REST OF EASTERN EUROPE METHYL METHACRYLATE CURRENT AND FUTURE TYPE ANALYSIS, 2025–2034, (USD MILLION)
FIGURE 63 REST OF EASTERN EUROPE METHYL METHACRYLATE CURRENT AND FUTURE END USER ANALYSIS, 2025–2034, (USD MILLION)
FIGURE 64 WESTERN EUROPE METHYL METHACRYLATE CURRENT AND FUTURE MARKET VOLUME SHARE REGIONAL ANALYSIS, 2025–2034, (USD MILLION)
FIGURE 65 GERMANY METHYL METHACRYLATE CURRENT AND FUTURE TYPE ANALYSIS, 2025–2034, (USD MILLION)
FIGURE 66 GERMANY METHYL METHACRYLATE CURRENT AND FUTURE END USER ANALYSIS, 2025–2034, (USD MILLION)
FIGURE 67 FRANCE METHYL METHACRYLATE CURRENT AND FUTURE TYPE ANALYSIS, 2025–2034, (USD MILLION)
FIGURE 68 FRANCE METHYL METHACRYLATE CURRENT AND FUTURE END USER ANALYSIS, 2025–2034, (USD MILLION)
FIGURE 69 UK METHYL METHACRYLATE CURRENT AND FUTURE TYPE ANALYSIS, 2025–2034, (USD MILLION)
FIGURE 70 UK METHYL METHACRYLATE CURRENT AND FUTURE END USER ANALYSIS, 2025–2034, (USD MILLION)
FIGURE 71 SPAIN METHYL METHACRYLATE CURRENT AND FUTURE TYPE ANALYSIS, 2025–2034, (USD MILLION)
FIGURE 72 SPAIN METHYL METHACRYLATE CURRENT AND FUTURE END USER ANALYSIS, 2025–2034, (USD MILLION)
FIGURE 73 ITALY METHYL METHACRYLATE CURRENT AND FUTURE TYPE ANALYSIS, 2025–2034, (USD MILLION)
FIGURE 74 ITALY METHYL METHACRYLATE CURRENT AND FUTURE END USER ANALYSIS, 2025–2034, (USD MILLION)
FIGURE 75 REST OF WESTERN EUROPE METHYL METHACRYLATE CURRENT AND FUTURE TYPE ANALYSIS, 2025–2034, (USD MILLION)
FIGURE 76 REST OF WESTERN EUROPE METHYL METHACRYLATE CURRENT AND FUTURE END USER ANALYSIS, 2025–2034, (USD MILLION)
FIGURE 77 EAST ASIA AND PACIFIC METHYL METHACRYLATE CURRENT AND FUTURE MARKET VOLUME SHARE REGIONAL ANALYSIS, 2025–2034, (USD MILLION)
FIGURE 78 CHINA METHYL METHACRYLATE CURRENT AND FUTURE TYPE ANALYSIS, 2025–2034, (USD MILLION)
FIGURE 79 CHINA METHYL METHACRYLATE CURRENT AND FUTURE END USER ANALYSIS, 2025–2034, (USD MILLION)
FIGURE 80 JAPAN METHYL METHACRYLATE CURRENT AND FUTURE TYPE ANALYSIS, 2025–2034, (USD MILLION)
FIGURE 81 JAPAN METHYL METHACRYLATE CURRENT AND FUTURE END USER ANALYSIS, 2025–2034, (USD MILLION)
FIGURE 82 AUSTRALIA METHYL METHACRYLATE CURRENT AND FUTURE TYPE ANALYSIS, 2025–2034, (USD MILLION)
FIGURE 83 AUSTRALIA METHYL METHACRYLATE CURRENT AND FUTURE END USER ANALYSIS, 2025–2034, (USD MILLION)
FIGURE 84 CAMBODIA METHYL METHACRYLATE CURRENT AND FUTURE TYPE ANALYSIS, 2025–2034, (USD MILLION)
FIGURE 85 CAMBODIA METHYL METHACRYLATE CURRENT AND FUTURE END USER ANALYSIS, 2025–2034, (USD MILLION)
FIGURE 86 FIJI METHYL METHACRYLATE CURRENT AND FUTURE TYPE ANALYSIS, 2025–2034, (USD MILLION)
FIGURE 87 FIJI METHYL METHACRYLATE CURRENT AND FUTURE END USER ANALYSIS, 2025–2034, (USD MILLION)
FIGURE 88 INDONESIA METHYL METHACRYLATE CURRENT AND FUTURE TYPE ANALYSIS, 2025–2034, (USD MILLION)
FIGURE 89 INDONESIA METHYL METHACRYLATE CURRENT AND FUTURE END USER ANALYSIS, 2025–2034, (USD MILLION)
FIGURE 90 SOUTH KOREA METHYL METHACRYLATE CURRENT AND FUTURE TYPE ANALYSIS, 2025–2034, (USD MILLION)
FIGURE 91 SOUTH KOREA METHYL METHACRYLATE CURRENT AND FUTURE END USER ANALYSIS, 2025–2034, (USD MILLION)
FIGURE 92 REST OF EAST ASIA AND PACIFIC METHYL METHACRYLATE CURRENT AND FUTURE TYPE ANALYSIS, 2025–2034, (USD MILLION)
FIGURE 93 REST OF EAST ASIA AND PACIFIC METHYL METHACRYLATE CURRENT AND FUTURE END USER ANALYSIS, 2025–2034, (USD MILLION)
FIGURE 94 SEA AND SOUTH ASIA METHYL METHACRYLATE CURRENT AND FUTURE MARKET VOLUME SHARE REGIONAL ANALYSIS, 2025–2034, (USD MILLION)
FIGURE 95 BANGLADESH METHYL METHACRYLATE CURRENT AND FUTURE TYPE ANALYSIS, 2025–2034, (USD MILLION)
FIGURE 96 BANGLADESH METHYL METHACRYLATE CURRENT AND FUTURE END USER ANALYSIS, 2025–2034, (USD MILLION)
FIGURE 97 NEW ZEALAND METHYL METHACRYLATE CURRENT AND FUTURE TYPE ANALYSIS, 2025–2034, (USD MILLION)
FIGURE 98 NEW ZEALAND METHYL METHACRYLATE CURRENT AND FUTURE END USER ANALYSIS, 2025–2034, (USD MILLION)
FIGURE 99 INDIA METHYL METHACRYLATE CURRENT AND FUTURE TYPE ANALYSIS, 2025–2034, (USD MILLION)
FIGURE 100 INDIA METHYL METHACRYLATE CURRENT AND FUTURE END USER ANALYSIS, 2025–2034, (USD MILLION)
FIGURE 101 SINGAPORE METHYL METHACRYLATE CURRENT AND FUTURE TYPE ANALYSIS, 2025–2034, (USD MILLION)
FIGURE 102 SINGAPORE METHYL METHACRYLATE CURRENT AND FUTURE END USER ANALYSIS, 2025–2034, (USD MILLION)
FIGURE 103 THAILAND METHYL METHACRYLATE CURRENT AND FUTURE TYPE ANALYSIS, 2025–2034, (USD MILLION)
FIGURE 104 THAILAND METHYL METHACRYLATE CURRENT AND FUTURE END USER ANALYSIS, 2025–2034, (USD MILLION)
FIGURE 105 TAIWAN METHYL METHACRYLATE CURRENT AND FUTURE TYPE ANALYSIS, 2025–2034, (USD MILLION)
FIGURE 106 TAIWAN METHYL METHACRYLATE CURRENT AND FUTURE END USER ANALYSIS, 2025–2034, (USD MILLION)
FIGURE 107 MALAYSIA METHYL METHACRYLATE CURRENT AND FUTURE TYPE ANALYSIS, 2025–2034, (USD MILLION)
FIGURE 108 MALAYSIA METHYL METHACRYLATE CURRENT AND FUTURE END USER ANALYSIS, 2025–2034, (USD MILLION)
FIGURE 109 REST OF SEA AND SOUTH ASIA METHYL METHACRYLATE CURRENT AND FUTURE TYPE ANALYSIS, 2025–2034, (USD MILLION)
FIGURE 110 REST OF SEA AND SOUTH ASIA METHYL METHACRYLATE CURRENT AND FUTURE END USER ANALYSIS, 2025–2034, (USD MILLION)
FIGURE 111 MIDDLE EAST AND AFRICA METHYL METHACRYLATE CURRENT AND FUTURE MARKET VOLUME SHARE REGIONAL ANALYSIS, 2025–2034, (USD MILLION)
FIGURE 112 GCC COUNTRIES METHYL METHACRYLATE CURRENT AND FUTURE TYPE ANALYSIS, 2025–2034, (USD MILLION)
FIGURE 113 GCC COUNTRIES METHYL METHACRYLATE CURRENT AND FUTURE END USER ANALYSIS, 2025–2034, (USD MILLION)
FIGURE 114 SAUDI ARABIA METHYL METHACRYLATE CURRENT AND FUTURE TYPE ANALYSIS, 2025–2034, (USD MILLION)
FIGURE 115 SAUDI ARABIA METHYL METHACRYLATE CURRENT AND FUTURE END USER ANALYSIS, 2025–2034, (USD MILLION)
FIGURE 116 UAE METHYL METHACRYLATE CURRENT AND FUTURE TYPE ANALYSIS, 2025–2034, (USD MILLION)
FIGURE 117 UAE METHYL METHACRYLATE CURRENT AND FUTURE END USER ANALYSIS, 2025–2034, (USD MILLION)
FIGURE 118 BAHRAIN METHYL METHACRYLATE CURRENT AND FUTURE TYPE ANALYSIS, 2025–2034, (USD MILLION)
FIGURE 119 BAHRAIN METHYL METHACRYLATE CURRENT AND FUTURE END USER ANALYSIS, 2025–2034, (USD MILLION)
FIGURE 120 KUWAIT METHYL METHACRYLATE CURRENT AND FUTURE TYPE ANALYSIS, 2025–2034, (USD MILLION)
FIGURE 121 KUWAIT METHYL METHACRYLATE CURRENT AND FUTURE END USER ANALYSIS, 2025–2034, (USD MILLION)
FIGURE 122 OMAN METHYL METHACRYLATE CURRENT AND FUTURE TYPE ANALYSIS, 2025–2034, (USD MILLION)
FIGURE 123 OMAN METHYL METHACRYLATE CURRENT AND FUTURE END USER ANALYSIS, 2025–2034, (USD MILLION)
FIGURE 124 QATAR METHYL METHACRYLATE CURRENT AND FUTURE TYPE ANALYSIS, 2025–2034, (USD MILLION)
FIGURE 125 QATAR METHYL METHACRYLATE CURRENT AND FUTURE END USER ANALYSIS, 2025–2034, (USD MILLION)
FIGURE 126 EGYPT METHYL METHACRYLATE CURRENT AND FUTURE TYPE ANALYSIS, 2025–2034, (USD MILLION)
FIGURE 127 EGYPT METHYL METHACRYLATE CURRENT AND FUTURE END USER ANALYSIS, 2025–2034, (USD MILLION)
FIGURE 128 NIGERIA METHYL METHACRYLATE CURRENT AND FUTURE TYPE ANALYSIS, 2025–2034, (USD MILLION)
FIGURE 129 NIGERIA METHYL METHACRYLATE CURRENT AND FUTURE END USER ANALYSIS, 2025–2034, (USD MILLION)
FIGURE 130 SOUTH AFRICA METHYL METHACRYLATE CURRENT AND FUTURE TYPE ANALYSIS, 2025–2034, (USD MILLION)
FIGURE 131 SOUTH AFRICA METHYL METHACRYLATE CURRENT AND FUTURE END USER ANALYSIS, 2025–2034, (USD MILLION)
FIGURE 132 ISRAEL METHYL METHACRYLATE CURRENT AND FUTURE TYPE ANALYSIS, 2025–2034, (USD MILLION)
FIGURE 133 ISRAEL METHYL METHACRYLATE CURRENT AND FUTURE END USER ANALYSIS, 2025–2034, (USD MILLION)
FIGURE 134 REST OF MEA METHYL METHACRYLATE CURRENT AND FUTURE TYPE ANALYSIS, 2025–2034, (USD MILLION)
FIGURE 135 REST OF MEA METHYL METHACRYLATE CURRENT AND FUTURE END USER ANALYSIS, 2025–2034, (USD MILLION)
FIGURE 136 U. S. MARKET SHARE ANALYSIS BY TYPE (2024)
FIGURE 137 U. S. MARKET SHARE ANALYSIS BY END USER (2024)
FIGURE 138 CANADA MARKET SHARE ANALYSIS BY TYPE (2024)
FIGURE 139 CANADA MARKET SHARE ANALYSIS BY END USER (2024)
FIGURE 140 MEXICO MARKET SHARE ANALYSIS BY TYPE (2024)
FIGURE 141 MEXICO MARKET SHARE ANALYSIS BY END USER (2024)
FIGURE 142 CHINA MARKET SHARE ANALYSIS BY TYPE (2024)
FIGURE 143 CHINA MARKET SHARE ANALYSIS BY END USER (2024)
FIGURE 144 JAPAN MARKET SHARE ANALYSIS BY TYPE (2024)
FIGURE 145 JAPAN MARKET SHARE ANALYSIS BY END USER (2024)
FIGURE 146 INDIA MARKET SHARE ANALYSIS BY TYPE (2024)
FIGURE 147 INDIA MARKET SHARE ANALYSIS BY END USER (2024)
FIGURE 148 SOUTH KOREA MARKET SHARE ANALYSIS BY TYPE (2024)
FIGURE 149 SOUTH KOREA MARKET SHARE ANALYSIS BY END USER (2024)
FIGURE 150 SAUDI ARABIA MARKET SHARE ANALYSIS BY TYPE (2024)
FIGURE 151 SAUDI ARABIA MARKET SHARE ANALYSIS BY END USER (2024)
FIGURE 152 UAE MARKET SHARE ANALYSIS BY TYPE (2024)
FIGURE 153 UAE MARKET SHARE ANALYSIS BY END USER (2024)
FIGURE 154 EGYPT MARKET SHARE ANALYSIS BY TYPE (2024)
FIGURE 155 EGYPT MARKET SHARE ANALYSIS BY END USER (2024)
FIGURE 156 NIGERIA MARKET SHARE ANALYSIS BY TYPE (2024)
FIGURE 157 NIGERIA MARKET SHARE ANALYSIS BY END USER (2024)
FIGURE 158 SOUTH AFRICA MARKET SHARE ANALYSIS BY TYPE (2024)
FIGURE 159 SOUTH AFRICA MARKET SHARE ANALYSIS BY END USER (2024)
FIGURE 160 GERMANY MARKET SHARE ANALYSIS BY TYPE (2024)
FIGURE 161 GERMANY MARKET SHARE ANALYSIS BY END USER (2024)
FIGURE 162 FRANCE MARKET SHARE ANALYSIS BY TYPE (2024)
FIGURE 163 FRANCE MARKET SHARE ANALYSIS BY END USER (2024)
FIGURE 164 UK MARKET SHARE ANALYSIS BY TYPE (2024)
FIGURE 165 UK MARKET SHARE ANALYSIS BY END USER (2024)
FIGURE 166 SPAIN MARKET SHARE ANALYSIS BY TYPE (2024)
FIGURE 167 SPAIN MARKET SHARE ANALYSIS BY END USER (2024)
FIGURE 168 ITALY MARKET SHARE ANALYSIS BY TYPE (2024)
FIGURE 169 ITALY MARKET SHARE ANALYSIS BY END USER (2024)
FIGURE 170 BRAZIL MARKET SHARE ANALYSIS BY TYPE (2024)
FIGURE 171 BRAZIL MARKET SHARE ANALYSIS BY END USER (2024)
FIGURE 172 ARGENTINA MARKET SHARE ANALYSIS BY TYPE (2024)
FIGURE 173 ARGENTINA MARKET SHARE ANALYSIS BY END USER (2024)
FIGURE 174 COLUMBIA MARKET SHARE ANALYSIS BY TYPE (2024)
FIGURE 175 COLUMBIA MARKET SHARE ANALYSIS BY END USER (2024)
FIGURE 176 GLOBAL METHYL METHACRYLATE CURRENT AND FUTURE MARKET KEY COUNTRY LEVEL ANALYSIS, 2024–2034, (USD MILLION)
FIGURE 177 FINANCIAL OVERVIEW:
Key Player Analysis
Huntsman Corporation: Huntsman is a challenger in MMA-adjacent chemistries, focused on specialty monomers, acrylics, and performance additives that feed into coatings and composites. The company positions MMA-related offerings within its Advanced Materials and Performance Products portfolios, targeting automotive coatings, construction resins, and electronics encapsulation. In 2025, Huntsman is prioritizing margin resilience through portfolio pruning and downstream formulation focus. It is investing in automation, digital plant monitoring, and low-VOC chemistries to align with buyer specifications in North America and Europe. The company’s differentiator is its integrated customer base across polyurethane, epoxy, and acrylic systems, which enables cross-selling and tailored formulations. You can expect mid-single-digit growth from MMA-linked products, supported by EV coatings demand and refurbishment cycles in construction.
Kuraray Group: Kuraray is a leader with a strong footprint in PMMA and methacrylate value chains, supported by global production and R&D. The group supplies MMA, PMMA sheets and resins, and specialty grades for optical, automotive, and construction uses. In 2025, Kuraray is expanding high-purity grades for optical components and investing in process efficiency to reduce Scope 1 and Scope 2 emissions. It is executing selective capacity debottlenecking in Asia and Europe and partnering with downstream OEMs on recycled PMMA feedstock qualification. Kuraray’s differentiators are optical-grade consistency and application engineering support, which lift adoption in displays and lighting systems. PMMA and MMA-linked revenue is expected to grow at 6–7% CAGR through 2030, powered by demand in architectural glazing and premium electronics.
Kowa India Pvt. Ltd.: Kowa India is a niche player and distribution specialist, serving MMA and PMMA supply chains across India and South Asia. The company focuses on procurement, logistics, and compliance for offshore producers, linking them to domestic coatings, construction, and electronics manufacturers. In 2025, Kowa is scaling indirect sales channels and digital order management, targeting faster fulfillment for SMEs and regional processors. The firm’s differentiator is its import management and last-mile distribution network, which shortens lead times and stabilizes pricing for buyers facing feedstock volatility. Indirect sales tied to MMA and derived products are increasing at 8–10% annually, supported by infrastructure projects and automotive component exports from India.
Lucite International: Lucite International, part of Mitsubishi Chemical Group, is a global leader in MMA with integrated assets and a broad PMMA portfolio. The company operates large-scale plants and proprietary technologies, supplying standard and specialty MMA grades to automotive, construction, medical, and electronics markets. In 2025, Lucite is advancing bio-based MMA pilots and circular PMMA initiatives in Europe, while reinforcing supply security through feedstock optimization and regional balancing. It is partnering with brand owners on recycled content targets and qualifying high-clarity PMMA for automotive lighting and consumer electronics. Lucite’s differentiators are scale, process technology, and consistent quality across regions. The MMA segment is projected to track the global market at roughly 6% CAGR, with share gains in high-spec applications as recycled MMA volumes rise and OEM sustainability targets tighten.
Key Players
DuPont Inc
Kuraray Group
Arkema
Monómeros del Vallés S.L.
Huntsman Corporation
BASF SE
LG Chem
Kowa India Pvt. Ltd.
Evonik Industries AG
Heilongjiang Zhongmeng Longxin Chemical Co., Ltd.
Lucite International
Dhalop Chemicals
Asahi Kasei Corporation
Driver
Automotive Lightweighting and EV Adoption Driving MMA Demand
As of 2025, demand for Methyl Methacrylate (MMA) is accelerating in both automotive and electronics manufacturing. In the automotive sector, MMA-derived polymethyl methacrylate (PMMA) is widely used in light covers, trims, and glazing applications. Its lightweight and impact-resistant properties directly support automakers’ push for fuel efficiency and electric vehicle design. With global EV sales projected to exceed 30 million units annually by 2030, MMA demand from this sector alone is expected to grow at a CAGR above 7%.
Electronics and Bio-Based Innovation Expanding End-Use Applications
Electronics is another critical growth engine. MMA is essential in producing high-clarity display panels, LED screens, and smartphone covers. Rising consumer demand for durable, scratch-resistant devices is expanding MMA’s role in premium electronics. Producers such as Mitsubishi Chemical are also advancing bio-based MMA monomers, aligning with sustainability targets while securing long-term supply resilience. These combined factors position MMA as a core material in industries undergoing structural transformation.
Restraint
Environmental Compliance and VOC Emissions Pressure Margins
Despite strong demand, environmental and health concerns remain a significant constraint on MMA market expansion. Production processes release volatile organic compounds (VOCs), contributing to air pollution and raising compliance costs in regions with strict environmental regulations. In Europe, for example, VOC reduction mandates have increased operational costs by up to 12% for chemical producers since 2020.
Occupational Safety Standards and Cost-Intensive Clean Technologies
Worker safety is another challenge. MMA exposure can cause respiratory and skin irritation, prompting regulators to tighten occupational safety standards. While bio-based and low-emission production routes are emerging, they remain cost-intensive, limiting adoption at scale. These factors create a dual pressure on producers: to meet rising demand while investing heavily in cleaner technologies, which may compress margins in the medium term.
Opportunity
Circular Economy and MMA Recycling Unlock New Value Streams
The most significant growth opportunity lies in the convergence of MMA with sustainability-driven applications. Recycling initiatives, such as the European Commission’s MMAtwo project, are targeting the recovery of over 12,000 tons of MMA annually from PMMA waste. This circular approach not only reduces environmental impact but also creates a new revenue stream for producers.
Asia-Pacific Capacity Expansion and Specialty-Grade Demand
Regionally, Asia-Pacific presents the strongest expansion potential. China, India, and South Korea are scaling automotive and electronics production, with MMA demand in the region projected to grow at a CAGR above 8% through 2030. For investors, this signals opportunities in capacity expansion, recycling technologies, and specialty-grade MMA for high-performance applications in EVs and consumer electronics.
Trend
Rising Adoption of Bio-Based PMMA in Regulated Industries
Sustainability is shaping the future trajectory of the MMA market. Bio-based PMMA is gaining traction, with early adoption in automotive and electronics where regulatory compliance and brand positioning are critical. By 2025, bio-based MMA accounts for less than 5% of global supply, but its share is expected to triple by 2030 as production costs decline and consumer-facing industries adopt greener materials.
Process Innovation, Automation, and Low-Emission Pathways
At the same time, process innovation is reshaping supply economics. The acetone cyanohydrin (ACH) method remains dominant, but alternative low-emission routes are being piloted in Japan and Europe. Producers are also integrating digital monitoring and automation to improve efficiency and reduce waste. These trends highlight a market in transition, where sustainability and technology are not optional but central to long-term competitiveness.
Recent Developments
Dec 2024 – The Dow Chemical Company: Dow announced a strategic review of its methyl methacrylate (MMA) production capacities in Asia, signaling potential output consolidation in response to regional oversupply. The move addresses recent price declines and is intended to rebalance the company's global supply chain ahead of 2025. This action positions Dow to improve its asset performance and protect margins amid challenging market conditions.
Feb 2025 – Mitsubishi Chemical Group: The company reported the successful completion of its pilot program for a new, more sustainable MMA monomer manufacturing process using plant-derived materials. The process is projected to reduce the carbon footprint by over 15% compared to conventional methods. This breakthrough reinforces Mitsubishi's leadership in green chemistry and prepares it for commercial-scale application in 2026, meeting rising demand for bio-based products.
Apr 2025 – Evonik Industries AG: Evonik entered into a multi-year supply agreement with a major European automotive OEM to provide high-purity MMA for electric vehicle (EV) battery casings and lightweight body panels. The deal, valued at an estimated USD 85 million, supports the automotive industry's shift toward durable, lightweight materials to enhance EV range and performance. This partnership solidifies Evonik’s position as a key materials supplier for the next generation of transportation.
Jul 2025 – Arkema: Following its Q2 financial disclosures, Arkema launched a corporate efficiency program aimed at doubling its annual cost-saving targets for its acrylics division. The initiative includes operational adjustments and supply chain consolidations expected to generate over €80 million in savings by year-end. This strategy strengthens the company's financial resilience against macroeconomic headwinds and weak demand.
Sep 2025 – Sumitomo Chemical: The company announced a joint venture in South Korea to construct a new facility dedicated to producing MMA-based polymers for the electronics and construction sectors. The project, an investment of approximately USD 120 million, will increase Sumitomo’s production capacity in Asia by 50 kilotons per year. This expansion allows the company to capture growing demand for advanced materials in high-tech applications like digital displays and 5G infrastructure.