Global Micro Investing App Market Size, Share & Analysis By Type (Android, iOS), By Deployment (Cloud-based, On-premises), By End-User (Business, Individual), By User Demographics, FinTech Adoption Trends, Monetization Models, Competitive Landscape & Forecast 2025–2034
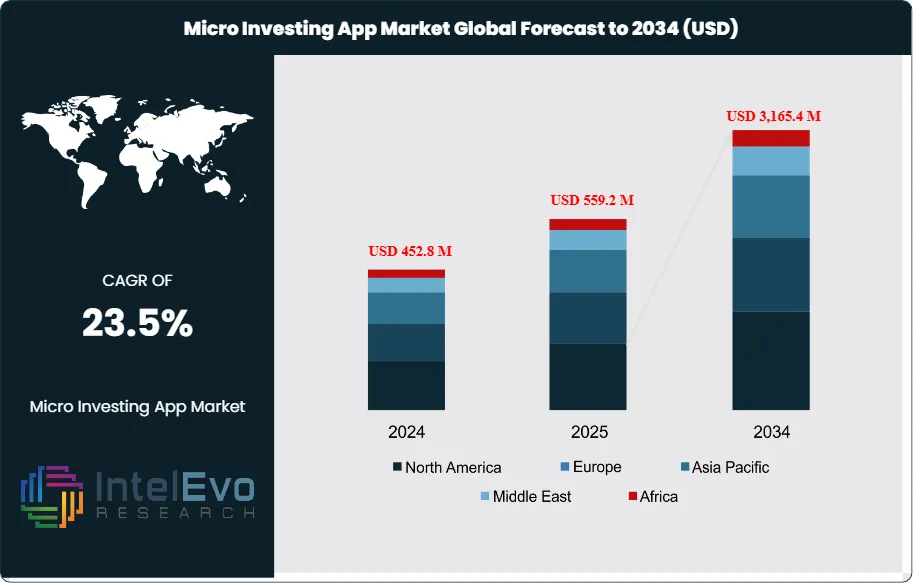
The Micro Investing App Market size is expected to be worth around USD USD 3,165.4 million by 2034, from 452.8 million in 2024, growing at a CAGR of 23.5% during the forecast period from 2025 to 2034. Market has grown quickly due to increased digital financial access, automated wealth-building tools, and the rise of fractional investing among new investors. The upcoming decade will be influenced by greater smartphone use, the onboarding of Gen-Z, partnerships in embedded finance, and updated regulations that improve access to digital investment products globally.
Micro investing platforms provide various product options that make wealth creation more accessible by allowing users to invest small amounts, sometimes starting from just USD 1. The product lineup includes fractional share investing, round-up investment tools, robo-advisory micro-portfolios, thematic baskets, index-linked micro funds, automated recurring investment plans, and micro-savings with investment-linked rewards. Many apps are also adding crypto micro investing, ESG-focused micro portfolios, and personalized asset allocation driven by AI. These features appeal particularly to new investors, younger users, and those looking for low-risk, automated ways to build long-term wealth.
The market's growth mainly results from a shift towards digital wealth-building habits among millennials and Gen-Z, who prefer automation, gamified investing, and low-commitment financial tools. Financial education programs, simple user interfaces, and AI-powered risk scoring are helping to boost adoption. However, challenges remain, such as fragmented regulations, differing KYC/AML requirements, and worries about data privacy and cybersecurity risks. Monetization challenges, like low revenue per user and high costs for attracting customers, also impact platform profitability. Despite these hurdles, the market has many opportunities, especially in emerging economies where fintech adoption is speeding up. Partnerships between neobanks, payment apps, and micro-investing platforms are broadening access. Trends like AI-guided investing, social investing communities, and micro-alternatives such as real estate, commodities, and bonds are changing how companies compete.
The COVID-19 pandemic significantly sped up the adoption of micro-investing. It drove more retail participation, raised financial awareness, and spurred interest in digital savings and investment combinations. Lockdowns and economic uncertainty led millions to consider long-term wealth planning, benefiting low-entry digital platforms. On the other hand, the post-pandemic period brought challenges, including reduced disposable income in some areas and increased caution among investors. Moreover, global geopolitical tensions and trade issues, especially involving major tech economies, have affected data storage regulations, cross-border fintech partnerships, and API-based brokerage integrations. These factors have pushed platforms to enhance compliance, diversify their brokerage back-ends, and adopt data-localization strategies to ensure consistent service.
In summary, the Micro Investing App Market is moving from an early-adoption phase toward a scalable financial ecosystem powered by automation, AI, and embedded finance. With growing consumer confidence, faster fintech digitization, and clearer regulations, the market is set for strong growth through 2034.
Key Takeaways
Market Growth: The global Micro Investing App market is projected to scale from USD 452.8 million in 2024 to USD 3,165.4 million by 2034, at a 23.5% CAGR (2025–2034), propelled by fractional investing, round-ups, zero-commission trading, and rising financial-wellness adoption among first-time investors.
Platform (OS): Android led with ~62% share in 2024, outperforming iOS due to its larger installed base in price-sensitive, emerging markets and lower acquisition costs per user; iOS retained a premium ARPU niche (~38%).
End User:Individual investors accounted for >70% of revenues in 2024, reflecting strong uptake of automated “spare-change” and paycheck auto-invest features; institutional/SMB use remains nascent but is expanding via white-label and embedded-finance partnerships.
Driver: Cloud-native deployment underpins scalability and speed-to-market, with >75% of platforms delivered via the cloud in 2024; open-banking rails and instant payments compress onboarding from days to minutes, while mobile-first behavior (millennials are ~43% more likely to invest via smartphone) accelerates conversion.
Restraint: Profitability is pressured by customer-acquisition cost inflation (~15–20% YoY in mature markets) and elevated early-life churn, alongside tightening rules on gamification, disclosures, and data privacy (KYC/AML, cross-border data) that raise compliance overhead.
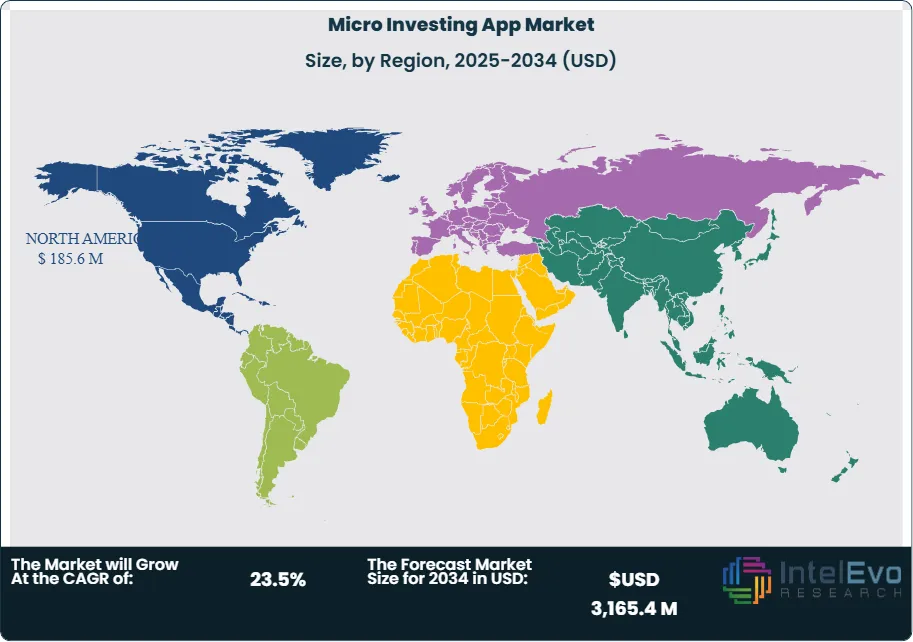
Opportunity: Asia–Pacific is the standout expansion vector, expected to deliver ~40% of absolute growth (≈USD 850–900 million) through 2034 on the back of smartphone penetration and underbanked segments; localized products (multi-currency wallets, small-lot treasuries/ETFs) in India, Indonesia, and the Philippines are poised for outsized uptake (>25% CAGR).
Trend: Convergence of AI-driven robo-advice and behavioral nudging is lifting engagement and retention; global digital-advice AUM is on track to exceed USD ~5.1 trillion by 2027, reinforcing the funnel for micro-ticket portfolios and goal-based, automated investing.
Regional Analysis: North America remained the largest market in 2024 with >40% share, supported by mature brokerage infrastructure and high fintech adoption; Western Europe follows (≈25–27%) aided by PSD2/open-banking integration, while Asia–Pacific posts the fastest growth (>25% CAGR). Latin America and Middle East & Africa are earlier-stage (<10% share each) but are benefiting from real-time payments and telco-fintech ecosystems.
Type Analysis
Android remains the scale platform for micro-investing in 2025, accounting for an estimated 61–63% of active users and ~58–60% of segment revenue. Its open ecosystem, broad OEM footprint, and affordability underpin penetration in price-sensitive markets, while native integrations with local rails (e.g., UPI in India, Pix in Brazil, DuitNow in Malaysia) and multi-language UI support lower onboarding friction and unit costs. iOS, by contrast, captures a smaller user base (~37–39%) but materially higher monetization—ARPU is typically 1.3–1.6× Android—driven by greater paid-tier uptake, higher average balances, and seamless funding via Apple Pay. Compliance and security features (biometrics, on-device encryption) also translate into superior funding conversion and retention. Looking to 2030, Android users are projected to grow at ~19–21% CAGR on emerging-market expansion, while iOS revenue is set to compound faster (~22–24% CAGR) as premium advisory bundles, tax tools, and high-yield cash features scale.
Deployment Analysis
Cloud-based deployment is the industry default in 2025, representing ~77–79% of revenue and >85% of new builds. Vendors prioritize elastic compute for intraday rebalancing, real-time risk, and AML analytics, while managed services compress release cycles from weeks to days. Enterprise-grade controls (SOC 2/ISO 27001), zero-trust access, HSM-backed key management, and continuous patching have narrowed historic security objections. On-premises persists mainly with Tier-1 financial institutions in markets with strict data-residency mandates, sovereign-cloud preferences, or latency-sensitive brokerage stacks; this cohort is expected to decline to ~15% share by 2030 as confidential computing, bring-your-own-key (BYOK), and regionalized data zones in public clouds meet regulatory thresholds. Hybrid patterns—cloud analytics plus on-prem transaction ledgers—are gaining adoption in Europe and parts of APAC.
End-User Analysis
Individual consumers remain the core demand engine, contributing ~72–74% of 2025 revenue and >80% of net-new accounts. Adoption is propelled by round-ups, paycheck auto-invest, and fractionalization that enable <$10 entry points; platforms report first-90-day funding conversion in the 35–45% range where instant payments are supported. Younger cohorts (Gen Z/young millennials) exhibit the highest growth, but multi-generational uptake is rising as apps bundle goal-based portfolios, micro-treasuries/ETFs, and education modules. The Business segment (26–28% revenue) is expanding faster (~24–26% CAGR through 2030) via embedded finance: employers offering opt-in micro-investing alongside earned-wage access, neobanks and telcos white-labeling robo-advice, and payroll providers enabling default contribution nudges. These channels deliver structurally lower CAC and higher persistence than direct-to-consumer models.
Regional Analysis
North America remains the largest market in 2025 with ~39–41% revenue share, underpinned by zero-commission trading, deep brokerage liquidity, and strong fintech adoption; leading players (e.g., Acorns, Stash, Robinhood) are layering high-yield cash, tax-loss harvesting, and retirement micro-plans to expand wallet share. Europe holds ~24–26%, supported by PSD2/open-banking connectivity, maturing robo-advisors, and rising interest in low-denomination government bond products; regulatory scrutiny of gamification is shaping UX design but also elevating trust.
Asia Pacific is the fastest-growing corridor (CAGR >25%), with share projected to approach 30–32% by 2030. India, Indonesia, and the Philippines are investment hotspots where smartphone penetration, instant-payment networks, and underbanked populations drive step-change adoption; local champions (e.g., Groww-style models, Raiz in ANZ/SEA) tailor micro-lots and vernacular support to accelerate conversion.
Latin America (~6–8%) benefits from real-time rails (Pix in Brazil, CoDi in Mexico) and rising retail participation, while the Middle East & Africa (~5–6%) see momentum in GCC sandboxes (UAE, Saudi Arabia) and mobile-money ecosystems (Kenya, Nigeria). Across emerging regions, partnerships with banks, telcos, and payroll providers are the fastest route to scale, compressing CAC and improving lifetime value.
Customization for segments, region/country-level will be provided. Moreover, additional customization can be done based on the requirements.
Pricing and Purchase Options
Avail customized purchase options to meet your exact research needs. We have three licenses to opt for: Single User License, Multi-User License (Up to 5 Users), Corporate Use License (Unlimited User and Printable PDF).
TABLE OF CONTENTS
1. EXECUTIVE SUMMARY
1.1. MARKET SNAPSHOT
1.2. KEY FINDINGS & INSIGHTS
1.3. ANALYST RECOMMENDATIONS
1.4. FUTURE OUTLOOK
2. RESEARCH METHODOLOGY
2.1. MARKET DEFINITION & SCOPE
2.2. RESEARCH OBJECTIVES: PRIMARY & SECONDARY DATA SOURCES
2.3. DATA COLLECTION SOURCES
2.3.1. COVERAGE OF 100+ PRIMARY RESEARCH/CONSULTATION CALLS WITH INDUSTRY STAKEHOLDERS
FIGURE 17 NORTH AMERICA MICRO INVESTING APP SYSTEM CURRENT AND FUTURE TYPE ANALYSIS, 2025–2034, (USD MILLION)
FIGURE 18 NORTH AMERICA MICRO INVESTING APP SYSTEM CURRENT AND FUTURE END USER ANALYSIS, 2025–2034, (USD MILLION)
FIGURE 19 MARKET SHARE BY COUNTRY
FIGURE 20 LATIN AMERICA MICRO INVESTING APP SYSTEM CURRENT AND FUTURE TYPE ANALYSIS, 2025–2034, (USD MILLION)
FIGURE 21 LATIN AMERICA MICRO INVESTING APP SYSTEM CURRENT AND FUTURE END USER ANALYSIS, 2025–2034, (USD MILLION)
FIGURE 22 MARKET SHARE BY COUNTRY
FIGURE 23 EASTERN EUROPE MICRO INVESTING APP SYSTEM CURRENT AND FUTURE TYPE ANALYSIS, 2025–2034, (USD MILLION)
FIGURE 24 EASTERN EUROPE MICRO INVESTING APP SYSTEM CURRENT AND FUTURE END USER ANALYSIS, 2025–2034, (USD MILLION)
FIGURE 25 MARKET SHARE BY COUNTRY
FIGURE 26 WESTERN EUROPE MICRO INVESTING APP SYSTEM CURRENT AND FUTURE TYPE ANALYSIS, 2025–2034, (USD MILLION)
FIGURE 27 WESTERN EUROPE MICRO INVESTING APP SYSTEM CURRENT AND FUTURE END USER ANALYSIS, 2025–2034, (USD MILLION)
FIGURE 28 MARKET SHARE BY COUNTRY
FIGURE 29 EAST ASIA AND PACIFIC MICRO INVESTING APP SYSTEM CURRENT AND FUTURE TYPE ANALYSIS, 2025–2034, (USD MILLION)
FIGURE 30 EAST ASIA AND PACIFIC MICRO INVESTING APP SYSTEM CURRENT AND FUTURE END USER ANALYSIS, 2025–2034, (USD MILLION)
FIGURE 31 MARKET SHARE BY COUNTRY
FIGURE 32 SEA AND SOUTH ASIA MICRO INVESTING APP SYSTEM CURRENT AND FUTURE TYPE ANALYSIS, 2025–2034, (USD MILLION)
FIGURE 33 SEA AND SOUTH ASIA MICRO INVESTING APP SYSTEM CURRENT AND FUTURE END USER ANALYSIS, 2025–2034, (USD MILLION)
FIGURE 34 MARKET SHARE BY COUNTRY
FIGURE 35 MIDDLE EAST AND AFRICA MICRO INVESTING APP SYSTEM CURRENT AND FUTURE TYPE ANALYSIS, 2025–2034, (USD MILLION)
FIGURE 36 MIDDLE EAST AND AFRICA MICRO INVESTING APP SYSTEM CURRENT AND FUTURE END USER ANALYSIS, 2025–2034, (USD MILLION)
FIGURE 37 NORTH AMERICA MICRO INVESTING APP SYSTEM CURRENT AND FUTURE MARKET VOLUME SHARE REGIONAL ANALYSIS, 2025–2034, (USD MILLION)
FIGURE 38 U.S. MICRO INVESTING APP SYSTEM CURRENT AND FUTURE TYPE ANALYSIS, 2025–2034, (USD MILLION)
FIGURE 39 U.S. MICRO INVESTING APP SYSTEM CURRENT AND FUTURE END USER ANALYSIS, 2025–2034, (USD MILLION)
FIGURE 40 CANADA MICRO INVESTING APP SYSTEM CURRENT AND FUTURE TYPE ANALYSIS, 2025–2034, (USD MILLION)
FIGURE 41 CANADA MICRO INVESTING APP SYSTEM CURRENT AND FUTURE END USER ANALYSIS, 2025–2034, (USD MILLION)
FIGURE 42 LATIN AMERICA MICRO INVESTING APP SYSTEM CURRENT AND FUTURE MARKET VOLUME SHARE REGIONAL ANALYSIS, 2025–2034, (USD MILLION)
FIGURE 43 MEXICO MICRO INVESTING APP SYSTEM CURRENT AND FUTURE TYPE ANALYSIS, 2025–2034, (USD MILLION)
FIGURE 44 MEXICO MICRO INVESTING APP SYSTEM CURRENT AND FUTURE END USER ANALYSIS, 2025–2034, (USD MILLION)
FIGURE 45 BRAZIL MICRO INVESTING APP SYSTEM CURRENT AND FUTURE TYPE ANALYSIS, 2025–2034, (USD MILLION)
FIGURE 46 BRAZIL MICRO INVESTING APP SYSTEM CURRENT AND FUTURE END USER ANALYSIS, 2025–2034, (USD MILLION)
FIGURE 47 ARGENTINA MICRO INVESTING APP SYSTEM CURRENT AND FUTURE TYPE ANALYSIS, 2025–2034, (USD MILLION)
FIGURE 48 ARGENTINA MICRO INVESTING APP SYSTEM CURRENT AND FUTURE END USER ANALYSIS, 2025–2034, (USD MILLION)
FIGURE 49 COLUMBIA MICRO INVESTING APP SYSTEM CURRENT AND FUTURE TYPE ANALYSIS, 2025–2034, (USD MILLION)
FIGURE 50 COLUMBIA MICRO INVESTING APP SYSTEM CURRENT AND FUTURE END USER ANALYSIS, 2025–2034, (USD MILLION)
FIGURE 51 REST OF LATIN AMERICA MICRO INVESTING APP SYSTEM CURRENT AND FUTURE TYPE ANALYSIS, 2025–2034, (USD MILLION)
FIGURE 52 REST OF LATIN AMERICA MICRO INVESTING APP SYSTEM CURRENT AND FUTURE END USER ANALYSIS, 2025–2034, (USD MILLION)
FIGURE 53 EASTERN EUROPE MICRO INVESTING APP SYSTEM CURRENT AND FUTURE MARKET VOLUME SHARE REGIONAL ANALYSIS, 2025–2034, (USD MILLION)
FIGURE 54 POLAND MICRO INVESTING APP SYSTEM CURRENT AND FUTURE TYPE ANALYSIS, 2025–2034, (USD MILLION)
FIGURE 55 POLAND MICRO INVESTING APP SYSTEM CURRENT AND FUTURE END USER ANALYSIS, 2025–2034, (USD MILLION)
FIGURE 56 RUSSIA MICRO INVESTING APP SYSTEM CURRENT AND FUTURE TYPE ANALYSIS, 2025–2034, (USD MILLION)
FIGURE 57 RUSSIA MICRO INVESTING APP SYSTEM CURRENT AND FUTURE END USER ANALYSIS, 2025–2034, (USD MILLION)
FIGURE 58 CZECH REPUBLIC MICRO INVESTING APP SYSTEM CURRENT AND FUTURE TYPE ANALYSIS, 2025–2034, (USD MILLION)
FIGURE 59 CZECH REPUBLIC MICRO INVESTING APP SYSTEM CURRENT AND FUTURE END USER ANALYSIS, 2025–2034, (USD MILLION)
FIGURE 60 ROMANIA MICRO INVESTING APP SYSTEM CURRENT AND FUTURE TYPE ANALYSIS, 2025–2034, (USD MILLION)
FIGURE 61 ROMANIA MICRO INVESTING APP SYSTEM CURRENT AND FUTURE END USER ANALYSIS, 2025–2034, (USD MILLION)
FIGURE 62 REST OF EASTERN EUROPE MICRO INVESTING APP SYSTEM CURRENT AND FUTURE TYPE ANALYSIS, 2025–2034, (USD MILLION)
FIGURE 63 REST OF EASTERN EUROPE MICRO INVESTING APP SYSTEM CURRENT AND FUTURE END USER ANALYSIS, 2025–2034, (USD MILLION)
FIGURE 64 WESTERN EUROPE MICRO INVESTING APP SYSTEM CURRENT AND FUTURE MARKET VOLUME SHARE REGIONAL ANALYSIS, 2025–2034, (USD MILLION)
FIGURE 65 GERMANY MICRO INVESTING APP SYSTEM CURRENT AND FUTURE TYPE ANALYSIS, 2025–2034, (USD MILLION)
FIGURE 66 GERMANY MICRO INVESTING APP SYSTEM CURRENT AND FUTURE END USER ANALYSIS, 2025–2034, (USD MILLION)
FIGURE 67 FRANCE MICRO INVESTING APP SYSTEM CURRENT AND FUTURE TYPE ANALYSIS, 2025–2034, (USD MILLION)
FIGURE 68 FRANCE MICRO INVESTING APP SYSTEM CURRENT AND FUTURE END USER ANALYSIS, 2025–2034, (USD MILLION)
FIGURE 69 UK MICRO INVESTING APP SYSTEM CURRENT AND FUTURE TYPE ANALYSIS, 2025–2034, (USD MILLION)
FIGURE 70 UK MICRO INVESTING APP SYSTEM CURRENT AND FUTURE END USER ANALYSIS, 2025–2034, (USD MILLION)
FIGURE 71 SPAIN MICRO INVESTING APP SYSTEM CURRENT AND FUTURE TYPE ANALYSIS, 2025–2034, (USD MILLION)
FIGURE 72 SPAIN MICRO INVESTING APP SYSTEM CURRENT AND FUTURE END USER ANALYSIS, 2025–2034, (USD MILLION)
FIGURE 73 ITALY MICRO INVESTING APP SYSTEM CURRENT AND FUTURE TYPE ANALYSIS, 2025–2034, (USD MILLION)
FIGURE 74 ITALY MICRO INVESTING APP SYSTEM CURRENT AND FUTURE END USER ANALYSIS, 2025–2034, (USD MILLION)
FIGURE 75 REST OF WESTERN EUROPE MICRO INVESTING APP SYSTEM CURRENT AND FUTURE TYPE ANALYSIS, 2025–2034, (USD MILLION)
FIGURE 76 REST OF WESTERN EUROPE MICRO INVESTING APP SYSTEM CURRENT AND FUTURE END USER ANALYSIS, 2025–2034, (USD MILLION)
FIGURE 77 EAST ASIA AND PACIFIC MICRO INVESTING APP SYSTEM CURRENT AND FUTURE MARKET VOLUME SHARE REGIONAL ANALYSIS, 2025–2034, (USD MILLION)
FIGURE 78 CHINA MICRO INVESTING APP SYSTEM CURRENT AND FUTURE TYPE ANALYSIS, 2025–2034, (USD MILLION)
FIGURE 79 CHINA MICRO INVESTING APP SYSTEM CURRENT AND FUTURE END USER ANALYSIS, 2025–2034, (USD MILLION)
FIGURE 80 JAPAN MICRO INVESTING APP SYSTEM CURRENT AND FUTURE TYPE ANALYSIS, 2025–2034, (USD MILLION)
FIGURE 81 JAPAN MICRO INVESTING APP SYSTEM CURRENT AND FUTURE END USER ANALYSIS, 2025–2034, (USD MILLION)
FIGURE 82 AUSTRALIA MICRO INVESTING APP SYSTEM CURRENT AND FUTURE TYPE ANALYSIS, 2025–2034, (USD MILLION)
FIGURE 83 AUSTRALIA MICRO INVESTING APP SYSTEM CURRENT AND FUTURE END USER ANALYSIS, 2025–2034, (USD MILLION)
FIGURE 84 CAMBODIA MICRO INVESTING APP SYSTEM CURRENT AND FUTURE TYPE ANALYSIS, 2025–2034, (USD MILLION)
FIGURE 85 CAMBODIA MICRO INVESTING APP SYSTEM CURRENT AND FUTURE END USER ANALYSIS, 2025–2034, (USD MILLION)
FIGURE 86 FIJI MICRO INVESTING APP SYSTEM CURRENT AND FUTURE TYPE ANALYSIS, 2025–2034, (USD MILLION)
FIGURE 87 FIJI MICRO INVESTING APP SYSTEM CURRENT AND FUTURE END USER ANALYSIS, 2025–2034, (USD MILLION)
FIGURE 88 INDONESIA MICRO INVESTING APP SYSTEM CURRENT AND FUTURE TYPE ANALYSIS, 2025–2034, (USD MILLION)
FIGURE 89 INDONESIA MICRO INVESTING APP SYSTEM CURRENT AND FUTURE END USER ANALYSIS, 2025–2034, (USD MILLION)
FIGURE 90 SOUTH KOREA MICRO INVESTING APP SYSTEM CURRENT AND FUTURE TYPE ANALYSIS, 2025–2034, (USD MILLION)
FIGURE 91 SOUTH KOREA MICRO INVESTING APP SYSTEM CURRENT AND FUTURE END USER ANALYSIS, 2025–2034, (USD MILLION)
FIGURE 92 REST OF EAST ASIA AND PACIFIC MICRO INVESTING APP SYSTEM CURRENT AND FUTURE TYPE ANALYSIS, 2025–2034, (USD MILLION)
FIGURE 93 REST OF EAST ASIA AND PACIFIC MICRO INVESTING APP SYSTEM CURRENT AND FUTURE END USER ANALYSIS, 2025–2034, (USD MILLION)
FIGURE 94 SEA AND SOUTH ASIA MICRO INVESTING APP SYSTEM CURRENT AND FUTURE MARKET VOLUME SHARE REGIONAL ANALYSIS, 2025–2034, (USD MILLION)
FIGURE 95 BANGLADESH MICRO INVESTING APP SYSTEM CURRENT AND FUTURE TYPE ANALYSIS, 2025–2034, (USD MILLION)
FIGURE 96 BANGLADESH MICRO INVESTING APP SYSTEM CURRENT AND FUTURE END USER ANALYSIS, 2025–2034, (USD MILLION)
FIGURE 97 NEW ZEALAND MICRO INVESTING APP SYSTEM CURRENT AND FUTURE TYPE ANALYSIS, 2025–2034, (USD MILLION)
FIGURE 98 NEW ZEALAND MICRO INVESTING APP SYSTEM CURRENT AND FUTURE END USER ANALYSIS, 2025–2034, (USD MILLION)
FIGURE 99 INDIA MICRO INVESTING APP SYSTEM CURRENT AND FUTURE TYPE ANALYSIS, 2025–2034, (USD MILLION)
FIGURE 100 INDIA MICRO INVESTING APP SYSTEM CURRENT AND FUTURE END USER ANALYSIS, 2025–2034, (USD MILLION)
FIGURE 101 SINGAPORE MICRO INVESTING APP SYSTEM CURRENT AND FUTURE TYPE ANALYSIS, 2025–2034, (USD MILLION)
FIGURE 102 SINGAPORE MICRO INVESTING APP SYSTEM CURRENT AND FUTURE END USER ANALYSIS, 2025–2034, (USD MILLION)
FIGURE 103 THAILAND MICRO INVESTING APP SYSTEM CURRENT AND FUTURE TYPE ANALYSIS, 2025–2034, (USD MILLION)
FIGURE 104 THAILAND MICRO INVESTING APP SYSTEM CURRENT AND FUTURE END USER ANALYSIS, 2025–2034, (USD MILLION)
FIGURE 105 TAIWAN MICRO INVESTING APP SYSTEM CURRENT AND FUTURE TYPE ANALYSIS, 2025–2034, (USD MILLION)
FIGURE 106 TAIWAN MICRO INVESTING APP SYSTEM CURRENT AND FUTURE END USER ANALYSIS, 2025–2034, (USD MILLION)
FIGURE 107 MALAYSIA MICRO INVESTING APP SYSTEM CURRENT AND FUTURE TYPE ANALYSIS, 2025–2034, (USD MILLION)
FIGURE 108 MALAYSIA MICRO INVESTING APP SYSTEM CURRENT AND FUTURE END USER ANALYSIS, 2025–2034, (USD MILLION)
FIGURE 109 REST OF SEA AND SOUTH ASIA MICRO INVESTING APP SYSTEM CURRENT AND FUTURE TYPE ANALYSIS, 2025–2034, (USD MILLION)
FIGURE 110 REST OF SEA AND SOUTH ASIA MICRO INVESTING APP SYSTEM CURRENT AND FUTURE END USER ANALYSIS, 2025–2034, (USD MILLION)
FIGURE 111 MIDDLE EAST AND AFRICA MICRO INVESTING APP SYSTEM CURRENT AND FUTURE MARKET VOLUME SHARE REGIONAL ANALYSIS, 2025–2034, (USD MILLION)
FIGURE 112 GCC COUNTRIES MICRO INVESTING APP SYSTEM CURRENT AND FUTURE TYPE ANALYSIS, 2025–2034, (USD MILLION)
FIGURE 113 GCC COUNTRIES MICRO INVESTING APP SYSTEM CURRENT AND FUTURE END USER ANALYSIS, 2025–2034, (USD MILLION)
FIGURE 114 SAUDI ARABIA MICRO INVESTING APP SYSTEM CURRENT AND FUTURE TYPE ANALYSIS, 2025–2034, (USD MILLION)
FIGURE 115 SAUDI ARABIA MICRO INVESTING APP SYSTEM CURRENT AND FUTURE END USER ANALYSIS, 2025–2034, (USD MILLION)
FIGURE 116 UAE MICRO INVESTING APP SYSTEM CURRENT AND FUTURE TYPE ANALYSIS, 2025–2034, (USD MILLION)
FIGURE 117 UAE MICRO INVESTING APP SYSTEM CURRENT AND FUTURE END USER ANALYSIS, 2025–2034, (USD MILLION)
FIGURE 118 BAHRAIN MICRO INVESTING APP SYSTEM CURRENT AND FUTURE TYPE ANALYSIS, 2025–2034, (USD MILLION)
FIGURE 119 BAHRAIN MICRO INVESTING APP SYSTEM CURRENT AND FUTURE END USER ANALYSIS, 2025–2034, (USD MILLION)
FIGURE 120 KUWAIT MICRO INVESTING APP SYSTEM CURRENT AND FUTURE TYPE ANALYSIS, 2025–2034, (USD MILLION)
FIGURE 121 KUWAIT MICRO INVESTING APP SYSTEM CURRENT AND FUTURE END USER ANALYSIS, 2025–2034, (USD MILLION)
FIGURE 122 OMAN MICRO INVESTING APP SYSTEM CURRENT AND FUTURE TYPE ANALYSIS, 2025–2034, (USD MILLION)
FIGURE 123 OMAN MICRO INVESTING APP SYSTEM CURRENT AND FUTURE END USER ANALYSIS, 2025–2034, (USD MILLION)
FIGURE 124 QATAR MICRO INVESTING APP SYSTEM CURRENT AND FUTURE TYPE ANALYSIS, 2025–2034, (USD MILLION)
FIGURE 125 QATAR MICRO INVESTING APP SYSTEM CURRENT AND FUTURE END USER ANALYSIS, 2025–2034, (USD MILLION)
FIGURE 126 EGYPT MICRO INVESTING APP SYSTEM CURRENT AND FUTURE TYPE ANALYSIS, 2025–2034, (USD MILLION)
FIGURE 127 EGYPT MICRO INVESTING APP SYSTEM CURRENT AND FUTURE END USER ANALYSIS, 2025–2034, (USD MILLION)
FIGURE 128 NIGERIA MICRO INVESTING APP SYSTEM CURRENT AND FUTURE TYPE ANALYSIS, 2025–2034, (USD MILLION)
FIGURE 129 NIGERIA MICRO INVESTING APP SYSTEM CURRENT AND FUTURE END USER ANALYSIS, 2025–2034, (USD MILLION)
FIGURE 130 SOUTH AFRICA MICRO INVESTING APP SYSTEM CURRENT AND FUTURE TYPE ANALYSIS, 2025–2034, (USD MILLION)
FIGURE 131 SOUTH AFRICA MICRO INVESTING APP SYSTEM CURRENT AND FUTURE END USER ANALYSIS, 2025–2034, (USD MILLION)
FIGURE 132 ISRAEL MICRO INVESTING APP SYSTEM CURRENT AND FUTURE TYPE ANALYSIS, 2025–2034, (USD MILLION)
FIGURE 133 ISRAEL MICRO INVESTING APP SYSTEM CURRENT AND FUTURE END USER ANALYSIS, 2025–2034, (USD MILLION)
FIGURE 134 REST OF MEA MICRO INVESTING APP SYSTEM CURRENT AND FUTURE TYPE ANALYSIS, 2025–2034, (USD MILLION)
FIGURE 135 REST OF MEA MICRO INVESTING APP SYSTEM CURRENT AND FUTURE END USER ANALYSIS, 2025–2034, (USD MILLION)
FIGURE 136 U. S. MARKET SHARE ANALYSIS BY TYPE (2024)
FIGURE 137 U. S. MARKET SHARE ANALYSIS BY END USER (2024)
FIGURE 138 CANADA MARKET SHARE ANALYSIS BY TYPE (2024)
FIGURE 139 CANADA MARKET SHARE ANALYSIS BY END USER (2024)
FIGURE 140 MEXICO MARKET SHARE ANALYSIS BY TYPE (2024)
FIGURE 141 MEXICO MARKET SHARE ANALYSIS BY END USER (2024)
FIGURE 142 CHINA MARKET SHARE ANALYSIS BY TYPE (2024)
FIGURE 143 CHINA MARKET SHARE ANALYSIS BY END USER (2024)
FIGURE 144 JAPAN MARKET SHARE ANALYSIS BY TYPE (2024)
FIGURE 145 JAPAN MARKET SHARE ANALYSIS BY END USER (2024)
FIGURE 146 INDIA MARKET SHARE ANALYSIS BY TYPE (2024)
FIGURE 147 INDIA MARKET SHARE ANALYSIS BY END USER (2024)
FIGURE 148 SOUTH KOREA MARKET SHARE ANALYSIS BY TYPE (2024)
FIGURE 149 SOUTH KOREA MARKET SHARE ANALYSIS BY END USER (2024)
FIGURE 150 SAUDI ARABIA MARKET SHARE ANALYSIS BY TYPE (2024)
FIGURE 151 SAUDI ARABIA MARKET SHARE ANALYSIS BY END USER (2024)
FIGURE 152 UAE MARKET SHARE ANALYSIS BY TYPE (2024)
FIGURE 153 UAE MARKET SHARE ANALYSIS BY END USER (2024)
FIGURE 154 EGYPT MARKET SHARE ANALYSIS BY TYPE (2024)
FIGURE 155 EGYPT MARKET SHARE ANALYSIS BY END USER (2024)
FIGURE 156 NIGERIA MARKET SHARE ANALYSIS BY TYPE (2024)
FIGURE 157 NIGERIA MARKET SHARE ANALYSIS BY END USER (2024)
FIGURE 158 SOUTH AFRICA MARKET SHARE ANALYSIS BY TYPE (2024)
FIGURE 159 SOUTH AFRICA MARKET SHARE ANALYSIS BY END USER (2024)
FIGURE 160 GERMANY MARKET SHARE ANALYSIS BY TYPE (2024)
FIGURE 161 GERMANY MARKET SHARE ANALYSIS BY END USER (2024)
FIGURE 162 FRANCE MARKET SHARE ANALYSIS BY TYPE (2024)
FIGURE 163 FRANCE MARKET SHARE ANALYSIS BY END USER (2024)
FIGURE 164 UK MARKET SHARE ANALYSIS BY TYPE (2024)
FIGURE 165 UK MARKET SHARE ANALYSIS BY END USER (2024)
FIGURE 166 SPAIN MARKET SHARE ANALYSIS BY TYPE (2024)
FIGURE 167 SPAIN MARKET SHARE ANALYSIS BY END USER (2024)
FIGURE 168 ITALY MARKET SHARE ANALYSIS BY TYPE (2024)
FIGURE 169 ITALY MARKET SHARE ANALYSIS BY END USER (2024)
FIGURE 170 BRAZIL MARKET SHARE ANALYSIS BY TYPE (2024)
FIGURE 171 BRAZIL MARKET SHARE ANALYSIS BY END USER (2024)
FIGURE 172 ARGENTINA MARKET SHARE ANALYSIS BY TYPE (2024)
FIGURE 173 ARGENTINA MARKET SHARE ANALYSIS BY END USER (2024)
FIGURE 174 COLUMBIA MARKET SHARE ANALYSIS BY TYPE (2024)
FIGURE 175 COLUMBIA MARKET SHARE ANALYSIS BY END USER (2024)
FIGURE 176 GLOBAL MICRO INVESTING APP SYSTEM CURRENT AND FUTURE MARKET KEY COUNTRY LEVEL ANALYSIS, 2024–2034, (USD MILLION)
FIGURE 177 FINANCIAL OVERVIEW:
Key Player Analysis
Robinhood: Positioning – Leader/Disruptor. Robinhood has pivoted from a retail-trading pure play to a full-stack investing platform, adding RIA custody and institutional crypto to widen its profit mix and asset base. As of Q2–Q3 2025, the firm reported 45% YoY revenue growth to ~$989 million in Q2 and platform assets above ~$300 billion, underpinned by rising cash yields, options volumes, and ETF balances (~$46 billion, ~29% of equity AUC). The February 2025 closing of TradePMR adds ~350 RIA firms and ~$40–43 billion in advised assets, positioning Robinhood to cross-sell advisory services and capture lifecycle migration as younger traders seek planning. In June 2025 it completed the ~$200 million acquisition of Bitstamp and launched tokenized U.S. stock/ETF exposure for EU users via Arbitrum, signaling an aggressive push into 24/7, blockchain-enabled markets. Differentiators include near-instant onboarding, aggressive product velocity (perps/staking in select markets), and a marketing engine that scales deposit-match campaigns across consumer and RIA channels.
Betterment: Positioning – Leader/Innovator. Betterment enters 2025 with $63+ billion AUM and 1M+ customers across retail, workplace, and advisor channels, supported by deep tax automation and smart cash features. Strategically, the firm is broadening beyond “pure robo” with self-directed trading (announced April 2025), a Solo 401(k) for entrepreneurs (August 2025), and distribution partnerships—most recently with First Citizens Wealth (September 2025)—to expand workplace penetration. The acquisition of Ellevest’s automated investing accounts (announced Feb 2025; transfers around Apr 17, 2025) augments Betterment’s female-forward segment strength while adding scale to its core advice engine. Differentiation rests on retirement-led bundles (>$21B retirement AUM), advisor tooling, and disciplined pricing that undercuts incumbents while sustaining unit economics.
Moneybox: Positioning – Challenger/Innovator (UK). Moneybox has evolved into a mainstream UK wealth platform with 1.5M+ customers and £16.6bn AUA by mid-2025 (+75% YoY), propelled by strong net inflows (£4.5bn in H1 2025) and a profitable operating profile. In September 2025 it unveiled a brand refresh and its “Aurora” engine to sharpen personalization across investing, savings, pensions, and mortgages—aimed at pushing ARPU higher without sacrificing accessibility. Differentiators include a unified financial-goals UX, ISA/Lifetime ISA depth, and mortgage advisory integration, which together reduce churn and raise share of wallet. Sustainability disclosures (2024 carbon-neutral report) and disciplined growth (2024 revenue +68% YoY to £93.8m) further enhance credibility with regulators and partners.
Acorns:Positioning – Category Leader (Micro-investing & Family Finance). In 2025, Acorns is consolidating family-finance leadership—serving >15.5 million people and marking one million kids served—by integrating custodial, checking, and automated portfolios under a subscription model. The company executed a string of capability tuck-ins: EarlyBird (May 2025) to deepen gifting/custodial flows and Zeta (June 2025) to bolster couples and household money management, augmenting engagement for its $12/month “Gold” tier. Differentiation stems from habit-formation mechanics (round-ups, automated goals), broad ETF portfolios (including limited bitcoin-linked ETF exposure), and an expanding family ecosystem that smooths progression from child accounts to adult investing—lifting lifetime value while defending against fee-free trading apps.
Market Key Players
Stash
Acorns
Betterment
Greenlight
Moneyfarm
Wealthify
SoFi
Bamboo
M1
Robinhood
Wealthsimple
Nutmeg
Moneybox
Other Key Players
Driver:
Surging Smartphone-Native Wealth Building Accelerates Market Growth
As of 2025, micro-investing is riding a structural shift toward smartphone-native wealth building. Low entry points (fractional shares, round-ups under USD 5), instant funding via real-time payment rails, and automated portfolios have expanded the active user base, keeping the market on a ~21% CAGR trajectory through 2034. Cloud delivery now powers ~78% of deployments, compressing feature release cycles and enabling real-time risk and compliance at scale. Platforms report first-90-day funding conversion of ~35–45% in markets with instant payments, while Android’s broad reach (~61–63% of users) and iOS’s higher ARPU (1.3–1.6× Android) jointly deepen monetization. Strategically, these forces lower friction, widen addressable demand, and support a profitable ladder from micro-tickets into higher-margin advisory bundles and cash/yield products.
Restraint:
Rising CAC and Compliance Pressures Constrain Profitability
Profitability remains constrained by rising customer-acquisition costs and regulatory overhead. CAC inflation of ~15–20% YoY in mature markets and early-life churn near 25–35% within six months dilute LTV/CAC ratios, particularly for pure D2C models. At the same time, tightening scrutiny on gamification, disclosure, and data privacy elevates compliance and engineering costs (often +80–120 bps of revenue), while app-store economics and identity/KYC fraud risks pressure margins. The strategic implication is clear: operators must pivot to lower-CAC channels (employer payroll, banking/telco partnerships), invest in retention science (behavioral nudges, goal tracking), and standardize controls to avoid regulatory drag on scale.
Opportunity:
Asia Pacific and Embedded Finance Unlock the Largest Growth Runway
Asia Pacific is the standout expansion vector, supported by rising smartphone penetration, vernacular interfaces, and instant-payment networks. The region is poised to contribute ~40% of absolute market growth through 2034—equating to roughly USD 0.85–0.90 billion of incremental revenue on current baselines—with India, Indonesia, and the Philippines outpacing >25% CAGR. Parallel upside exists in B2B2C embedded finance: employers, neobanks, and payroll providers bundling micro-investing can reduce CAC by 30–50% versus D2C and lift persistence via default contributions. Strategically, localized products (small-lot treasuries/ETFs, tax wrappers, multi-currency wallets) and compliant data-residency options will be decisive in capturing this runway.
Trend:
AI-Driven Advice and Fractionalization Reshape Product Economics
AI-enabled advice and automation are redefining product economics and customer experience. Robo-advisory penetration continues to climb, with digital-advice AUM projected to surpass ~USD 5.1 trillion by 2027, and leading micro-investing platforms report 50–70% of routine advice interactions handled by AI assistants with compliant guardrails. Generative insights (explainable portfolio changes, tax-aware rebalancing), risk-based nudges, and hyper-personalized goals are lifting engagement and reducing abandonment. Concurrently, multi-asset fractionalization (equities, ETFs, short-duration treasuries, and early tokenized funds) broadens product breadth without raising ticket sizes. The strategic impact is a durable improvement in unit economics—higher ARPU, lower service cost, tighter compliance—and a defensible moat built on data network effects.
Recent Developments
Dec 2024 – Robinhood: Expanded EU crypto footprint with localized apps (Italy, Poland, Lithuania), added 14 new tokens (EU total ~40), and rolled out staking for SOL and ETH; > two-thirds of EU SOL holdings were staked post-launch. Strengthens EU scale and recurring crypto engagement ahead of broader tokenization plans.
Feb 2025 – Robinhood: Closed the acquisition of TradePMR, bringing ~350 RIA firms and >$40B in advised assets into the fold; management guided to ~$85M of 2025 integration costs. Accelerates entry into RIA custody and creates a bridge from retail to advised assets.
Apr 2025 – Betterment: Agreed to acquire Ellevest’s automated-investing accounts, with transfers on/around Apr 17, 2025 (undisclosed value). Broadens female-focused segment reach and adds scale to Betterment’s core robo engine.
Jul 2025 – Robinhood: Reported Q2 2025 results: revenue +45% YoY to $989M; ETFs reached ~$46B (29% of equities under custody). Validates diversification beyond trading and supports higher ARPU via yield and ETF flows.
Sep 2025 – Moneybox: Announced a brand refresh and the launch of its Aurora engine; confirmed £16bn+ AUA and 1.5M+ customers. Enhances personalization and cross-sell across investing, savings, pensions, and mortgages to sustain profitable growth.