
- Home
- Industries
 Aerospace And Defence
 Agriculture
 Automotive And Transportation
 Banking And Finance
 Business
 Chemicals And Materials
 Consumer And Retail
 Electronics And Semiconductors
 Food And Beverages
 Machinery & Equipments
 Manufacturing And Construction
 Medical Devices
 Others
 Pharmaceuticals And Healthcare
 Power And Energy
 Sports
 Technology
- Services
- News Room
- About us
- Contact Us
-
Microduct Cable Market Size, Trends & Forecast 2034 | 11.5% CAGR
Global Microduct Cable Market Size, Share, Analysis Report By Type (Single-mode, Multi-mode), Duct Type (Direct Burial, Flame Retardant, Direct Install), Material Type (Glass, Plastic), End-Use Industry (Power Utilities, Telecommunication, Industrial, Defense/Military, Medical, Others), Region and Key Players - Industry Segment Overview, Market Dynamics, Competitive Strategies, Trends and Forecast 2025-2034

Report Overview:
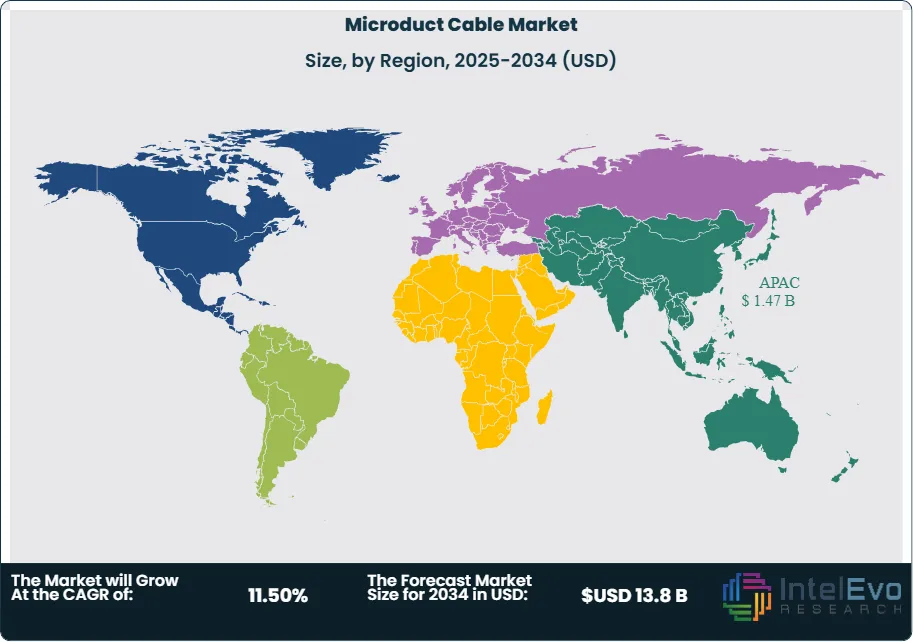
The Microduct Cable Market size is expected to be worth around USD 13.8 billion by 2034, up from USD 4.9 billion in 2024, growing at a CAGR of 11.5% during the forecast period from 2025 to 2034. The growth is fueled by the rising demand for high-speed fiber optic connectivity, 5G infrastructure expansion, and increasing investments in smart city networks. With growing adoption across data centers, telecom, and enterprise applications, the microduct cable market is rapidly transforming the global communication backbone.

Get More Information about this report -
Request Free Sample ReportThe Microduct Cable Market is a significant part of the global telecommunications, power utilities, industrial, defense, and medical sectors. These cables, designed with small, flexible ducts, offer an efficient solution for fiber optic cables, significantly simplifying installations and upgrades. Microduct cables provide enhanced flexibility and scalability, making them an attractive option for telecommunication and data transmission networks. The global demand for faster internet speeds, digital transformations, and expanding telecommunication infrastructures is fueling the growth of the microduct cable market. As demand for high-speed connectivity rises, so does the need for efficient cable solutions that can easily be adapted, managed, and upgraded.
The microduct cable market is experiencing robust growth, driven primarily by the increasing demand for high-speed internet and data transmission, along with the digitalization of industries worldwide. As the Internet of Things (IoT), smart cities, and cloud computing continue to gain traction, the need for efficient and scalable fiber-optic solutions has accelerated. The proliferation of broadband services, combined with the ongoing 5G rollout and upgrades in telecommunications infrastructure, continues to spur the demand for microduct cables.
Furthermore, microduct cables offer significant advantages over traditional cables, including the ability to support multiple fiber optic installations without needing to dig up the ground repeatedly. This flexibility enables easier expansion and maintenance of fiber optic networks, providing cost-effective solutions to network operators. Additionally, the microduct cable’s ability to withstand harsh environmental conditions such as extreme temperatures and moisture is essential for their widespread adoption in both urban and rural areas.
The Asia-Pacific region dominates the Microduct cable market, accounting for a substantial market share. The rapid industrialization in countries like China, India, and Japan, combined with massive infrastructure development and increasing demand for fiber optic networks, has positioned this region as a leader in the market.
The COVID-19 pandemic had a profound impact on industries worldwide, including the microduct cable market. Supply chain disruptions, delays in raw material deliveries, and halted construction and infrastructure projects during the height of the pandemic resulted in a slowdown in demand for microduct cables. However, the market has shown signs of recovery as countries ease lockdown measures and businesses resume their operations. The increased demand for remote work and internet connectivity due to the pandemic has also accelerated the need for upgraded telecommunication networks, giving rise to new opportunities in the market.
, Duct Type (Direct Burial, Flame Retardant, Direct Install), Material Type (Glass, Plastic), End-Use Industry (Power Utilities, Telecommunication, Industrial, Defense/Military, Medical, Others), Region and Key Players - Industry Segment Overview, Market Dynamics, Competitive Strategies, Trends and Forecast 2025-2034")
Key Takeaways:
- Market Growth: The Microduct Cable Market is expected to reach USD 13.8 billion by 2034, growing at a robust CAGR of 11.5% from 2024, owing to technological advancements in fiber optics, regulatory mandates promoting broadband expansion, and growing investments in telecommunications infrastructure.
- Type Dominance: Single-mode cables lead the market as they provide long-distance communication capabilities, essential for telecommunication applications.
- Duct Type Dominance: Flame Retardant ducts hold the largest market share due to their superior fire resistance, making them essential for safety-critical installations in commercial and industrial environments.
- Material Type Dominance: Plastic-based ducts dominate due to their cost-effectiveness, lightweight nature, and flexibility, making them ideal for various installation environments.
- End-Use Industry Dominance: Telecommunication industry is the dominant segment in the microduct cable market due to the increasing demand for broadband, 5G rollout, and network upgrades.
- Driver: The increasing demand for high-speed internet and the global rollout of 5G technology are primary growth drivers of the microduct cable market. Rising adoption of smart city projects and data-heavy applications further accelerates the need for fiber-optic infrastructure.
- Restraint: High initial investment and complex installation processes can hinder market growth. Technical constraints in retrofitting older infrastructure with modern microduct systems limit their adoption in legacy networks.
- Opportunity: Expanding IoT and industrial automation markets present new demand for microduct cable installations. Developing nations are rapidly investing in telecom infrastructure, creating untapped potential for growth.
- Trend: There is a shift towards environmentally sustainable, modular, and low-maintenance microduct solutions. Growing preference for plug-and-play or pre-installed fiber-in-microduct systems is reshaping network installation practices.
- Regional Analysis: The Asia-Pacific region leads the microduct cable market, driven by rapid industrial growth, infrastructure expansion, and rising demand for fiber optic networks in countries like China, India, and Japan. North America and Europe also contribute significantly, fueled by 5G deployment and continuous investment in telecom and utility infrastructure.
Type Analysis:
Single-mode cables leads With over 60% Market Share In Microduct Cable Market. Single-mode cables dominate the market due to their ability to transmit data over long distances with minimal signal loss, making them ideal for high-speed, high-capacity applications such as backbone networks and intercity communication. These cables are widely used in telecommunications and internet infrastructure, especially where precision and minimal attenuation are critical.
Single-mode cables lead the market, especially in 5G rollout and data center backhaul networks. However, multi-mode cables are expected to see growth in short-distance, high-density applications such as LANs and intra-building communication, particularly in data centers.
Duct Type Analysis:
Flame retardant microducts have gained significant traction due to strict fire safety regulations, particularly in commercial buildings, industrial facilities, and underground installations. These ducts ensure operational safety and compliance with global fire safety standards, making them the preferred choice for critical infrastructure deployment.
Flame retardant ducts currently lead the market. Looking ahead, direct install ducts may witness notable growth due to their simplified deployment processes and lower installation costs, especially in emerging urban development and smart city projects.
Material Type Analysis:
Plastic ducts dominate the market owing to their affordability, flexibility, and ease of installation. These characteristics make plastic ducts suitable for a wide range of applications, including both indoor and outdoor installations. Their corrosion resistance and light weight also contribute to reduced labor and transport costs.
Plastic leads due to its adaptability and cost-effectiveness. However, glass ducts are likely to grow in specialized sectors like defense and high-temperature industrial applications, where mechanical strength and heat resistance are crucial.
End-Use Industry Analysis:
The telecommunications sector is the most dominant end-user of microduct cables, driven by surging demand for high-speed internet, fiber-to-the-home (FTTH) projects, and the accelerated deployment of 5G networks worldwide. The need to support cloud computing, video streaming, and IoT further amplifies this demand.
Telecommunication leads due to the continuous expansion of fiber-optic networks. Meanwhile, power utilities and industrial sectors are anticipated to experience strong growth due to the increasing adoption of smart grids, automation, and IoT-enabled infrastructure.
Region Analysis:
Asia-Pacific region holds nearly 30% Market Share In Microduct Cable Market. North America currently holds the leading position in the global microduct cable market, driven by robust investment in 5G deployment, modernization of telecommunication infrastructure, and high demand for fast and reliable internet services across industrial and commercial sectors. The United States, in particular, has seen widespread fiber-optic expansion initiatives, supported by both public and private sector funding, aimed at enhancing broadband access in urban and remote areas. Additionally, the presence of major technology companies and a strong emphasis on network performance and sustainability further contribute to the region’s market dominance.
Asia-Pacific follows closely behind, supported by rapid industrialization and aggressive digital infrastructure development in key nations like China, India, Japan, and South Korea. Government-led initiatives, including China’s 5G acceleration plans and India’s BharatNet project, are fueling significant demand for fiber-optic and microduct cable systems. Meanwhile, Europe maintains a strong position, driven by ongoing utility upgrades, smart city deployments, and a growing focus on energy-efficient, high-speed network infrastructure.
Regions such as Latin America, the Middle East, and Africa (LAMEA) are poised for significant growth. As these regions intensify investments in broadband and mobile network expansion, especially in underserved and rural areas, the demand for microduct cables is expected to rise steadily.
Get More Information about this report -
Request Free Sample ReportKey Market Segment
By Type
- Single-mode
- Multi-mode
By Duct Type
- Direct Install Microduct Cables
- Direct Buried Microduct Cables
- Flame Retardant Microduct Cables
- Aerial Microduct Cables
By Material
- Glass
- High-Density Polyethylene (HDPE)
- Low-Density Polyethylene (LDPE)
- Polypropylene (PP)
- Others
By Application
- Telecommunications
- Data Centers
- Smart Cities
- Industrial and Commercial Buildings
- Defense and Aerospace
- Others
By End-User
- Network Operators
- Internet Service Providers (ISPs)
- Enterprises
- Government and Public Infrastructure
By Region
- North America
- Latin America
- East Asia And Pacific
- Sea And South Asia
- Eastern Europe
- Western Europe
- Middle East & Africa
| Report Attribute | Details |
| Market size (2025) | USD 5.46 B |
| Forecast Revenue (2034) | USD 13.8 B |
| CAGR (2025-2034) | 11.50% |
| Historical data | 2018-2023 |
| Base Year For Estimation | 2024 |
| Forecast Period | 2025-2034 |
| Report coverage | Revenue Forecast, Competitive Landscape, Market Dynamics, Growth Factors, Trends and Recent Developments |
| Segments covered | By Type: Single-mode, Multi-mode, By Duct Type: Direct Install Microduct Cables, Direct Buried Microduct Cables, Flame Retardant Microduct Cables, Aerial Microduct Cables, By Material: Glass, High-Density Polyethylene (HDPE), Low-Density Polyethylene (LDPE), Polypropylene (PP), Others, By Application: Telecommunications, Data Centers, Smart Cities, Industrial and Commercial Buildings, Defense and Aerospace, Others, By End-User: Network Operators, Internet Service Providers (ISPs), Enterprises, Government and Public Infrastructure |
| Research Methodology |
|
| Regional scope |
|
| Competitive Landscape | Nexans S.A., Corning Incorporated, Nestor Cables, General Cable Corp, Sumitomo Electric Industries Ltd, Polycab Telecom, Emtelle UK Limited, Prysmian Group, CommScope Holding Company Inc., Leoni AG, Arabian Fiber Optic Cable Manufacturing LLC, Orient Cables India Pvt. Ltd, Briticom |
| Customization Scope | Customization for segments, region/country-level will be provided. Moreover, additional customization can be done based on the requirements. |
| Pricing and Purchase Options | Avail customized purchase options to meet your exact research needs. We have three licenses to opt for: Single User License, Multi-User License (Up to 5 Users), Corporate Use License (Unlimited User and Printable PDF). |
, Duct Type (Direct Burial, Flame Retardant, Direct Install), Material Type (Glass, Plastic), End-Use Industry (Power Utilities, Telecommunication, Industrial, Defense/Military, Medical, Others), Region and Key Players - Industry Segment Overview, Market Dynamics, Competitive Strategies, Trends and Forecast 2025-2034")
, Duct Type (Direct Burial, Flame Retardant, Direct Install), Material Type (Glass, Plastic), End-Use Industry (Power Utilities, Telecommunication, Industrial, Defense/Military, Medical, Others), Region and Key Players - Industry Segment Overview, Market Dynamics, Competitive Strategies, Trends and Forecast 2025-2034")
, Duct Type (Direct Burial, Flame Retardant, Direct Install), Material Type (Glass, Plastic), End-Use Industry (Power Utilities, Telecommunication, Industrial, Defense/Military, Medical, Others), Region and Key Players - Industry Segment Overview, Market Dynamics, Competitive Strategies, Trends and Forecast 2025-2034")
Frequently Asked Questions
How big is the Microduct Cable Market ?
Discover insights on the Global Microduct Cable Market size, growth trends, 5G expansion, and forecast to 2034. Explore opportunities shaping fiber connectivity.
Who are the major players in the Microduct Cable Market ?
Nexans S.A., Corning Incorporated, Nestor Cables, General Cable Corp, Sumitomo Electric Industries Ltd, Polycab Telecom, Emtelle UK Limited, Prysmian Group, CommScope Holding Company Inc., Leoni AG, Arabian Fiber Optic Cable Manufacturing LLC, Orient Cables India Pvt. Ltd, Briticom
Which segments covered the Microduct Cable Market ?
By Type: Single-mode, Multi-mode, By Duct Type: Direct Install Microduct Cables, Direct Buried Microduct Cables, Flame Retardant Microduct Cables, Aerial Microduct Cables, By Material: Glass, High-Density Polyethylene (HDPE), Low-Density Polyethylene (LDPE), Polypropylene (PP), Others, By Application: Telecommunications, Data Centers, Smart Cities, Industrial and Commercial Buildings, Defense and Aerospace, Others, By End-User: Network Operators, Internet Service Providers (ISPs), Enterprises, Government and Public Infrastructure
How can this market research report help my business make strategic decisions?
Our market research reports provide actionable intelligence, including verified market size data, CAGR projections, competitive benchmarking, and segment-level opportunity analysis. These insights support strategic planning, investment decisions, product development, and market entry strategies for enterprises and startups alike.
How frequently is the data updated?
We continuously monitor industry developments and update our reports to reflect regulatory changes, technological advancements, and macroeconomic shifts. Updated editions ensure you receive the latest market intelligence.

Select Licence Type
Connect with our sales team
Why IntelEvoResearch
100%
Customer
Satisfaction
24x7+
Availability - we are always
there when you need us
200+
Fortune 50 Companies trust
IntelEvoResearch
80%
of our reports are exclusive
and first in the industry
100%
more data
and analysis
1000+
reports published
till date