MaaS Market to Hit $11.16B by 2034 | 10.8% CAGR Forecast for Microgrid as a Service
Global Microgrid as a Service Market Size, Share, Analysis Report By Service Type(Monitoring and Control Service, Operation and Maintenance Service, SaaS, Design and Consulting Service), Grid Type(Grid-Connected Microgrids, Remote/Islanded Microgrids), End-User(Government, Commercial and Industrial, Healthcare, Educational Institutes, Military, Utility), Power Source(Renewable Energy, Combined Heat and Power (CHP), Diesel Generators), Region and Key Players - Industry Segment Overview, Market Dynamics, Competitive Strategies, Trends and Forecast 2025-2034
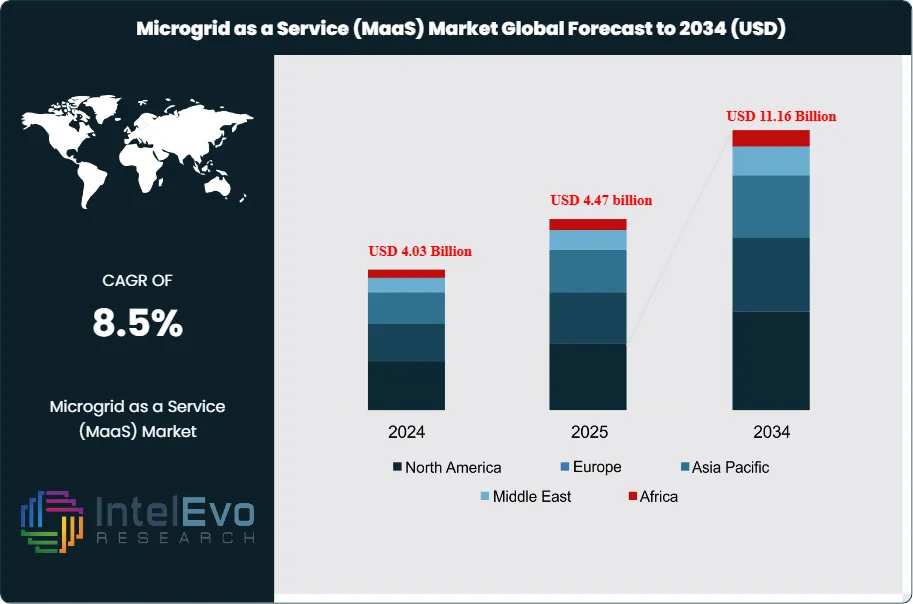
The Global Microgrid as a Service (MaaS) Market size is projected to reach approximately USD 11.16 Billion by 2034, up from an estimated USD 4.03 Billion in 2024, growing at a Compound Annual Growth Rate (CAGR) of 10.8% during the forecast period from 2025 to 2034. Microgrid as a Service is no longer the future — it's the next big leap in energy decentralization. As energy resilience and sustainability become global imperatives, MaaS is gaining unprecedented momentum across industries.
The Microgrid as a Service (MaaS) market refers to the outsourcing and management of microgrid systems, where a third party handles the design, installation, and operation of microgrids for clients. Microgrids are localized energy grids that can operate independently or in conjunction with the main power grid, ensuring resilience and energy security. The MaaS model allows organizations to implement microgrids without upfront capital investment, promoting accessibility and efficiency. In 2024, the market is valued at approximately USD 4.03 billion, driven by the increasing demand for reliable, clean energy and a growing emphasis on reducing greenhouse gas emissions. Additionally, the market benefits from technological advancements in energy storage and renewable energy integration.
The growth of the MaaS market is driven by several factors. Key among them is the increasing demand for energy resilience and security due to frequent grid outages and extreme weather events. The rising focus on decarbonization and sustainability also drives the adoption of renewable energy-based microgrids. The MaaS model's pay-as-you-go structure allows clients to minimize initial costs while still benefiting from long-term energy savings, making it appealing to various industries, particularly in remote or underserved regions. Additionally, government policies promoting renewable energy integration and grid modernization further support the market's expansion. With advancements in smart grid technologies and energy storage systems, the MaaS market is expected to witness significant growth over the next decade.
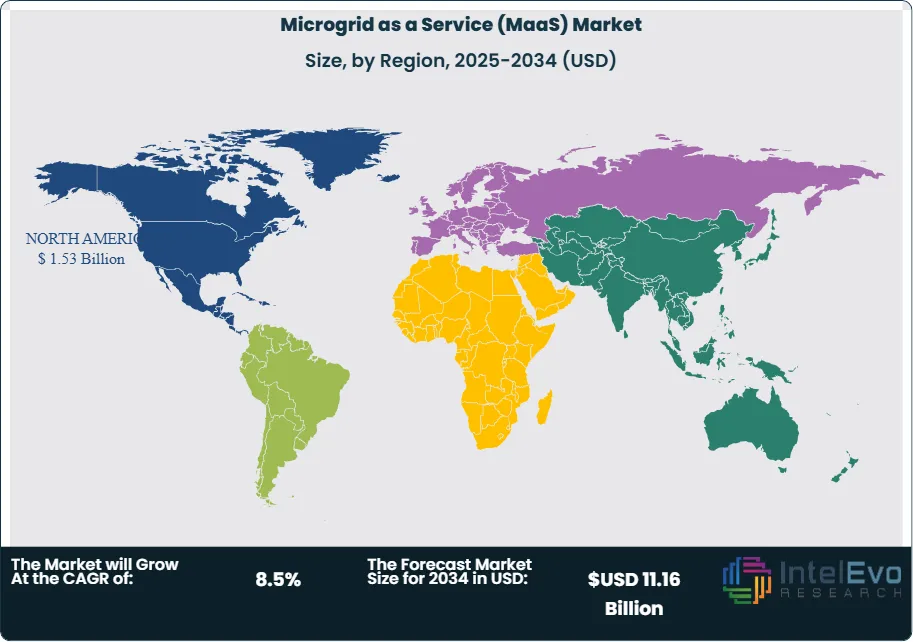
North America leads the MaaS market due to robust infrastructure, advanced energy policies, and significant investment in microgrid projects. The United States, in particular, dominates with its focus on grid modernization and renewable energy adoption. Europe follows closely, driven by stringent environmental regulations and a strong push toward decarbonization. The Asia-Pacific region is projected to experience the fastest growth, fueled by increasing energy demand in developing nations like India and China, alongside a growing focus on renewable energy and infrastructure development. Latin America and the Middle East & Africa regions are also emerging markets, with governments investing in microgrid systems to improve energy access and sustainability.
The COVID-19 pandemic had a mixed impact on the MaaS market. In the short term, project delays and supply chain disruptions slowed the deployment of new microgrid systems. However, the pandemic underscored the need for resilient, decentralized energy systems, driving long-term interest in MaaS solutions. The increased focus on sustainability post-pandemic, combined with economic recovery efforts centered on green energy, has accelerated investments in microgrids. As industries shift towards more flexible energy models, the MaaS market is expected to rebound and grow steadily in the post-pandemic period.
Market Growth: The Microgrid as a Service (MaaS) market is expected to reach USD 11.6 Billion by 2034, growing at a strong CAGR of 10.8%, reflecting rapid expansion driven by the increasing adoption of microgrids.
Service Type Dominance: The Monitoring and Control Service segment is projected to dominate the MaaS market, driven by the need for real-time energy monitoring and system optimization across industries, ensuring reliable and efficient energy supply.
Grid Type Analysis: Grid-Connected Microgrids hold the largest market share due to their ability to support both distributed energy generation and central grid operations, providing flexibility and improved energy management for urban and industrial settings.
Driver: Growing demand for reliable and decentralized energy systems, combined with rising renewable energy adoption and advancements in smart grid technologies, are key drivers propelling the MaaS market’s growth during the forecast period.
Restraint: High initial setup costs and the complexity of integrating various renewable energy sources into existing systems are significant challenges, hindering the widespread adoption of microgrids as a service across smaller and mid-scale industries.
Opportunity: The rising demand for microgrids in developing regions, particularly in remote and underserved areas, presents significant growth opportunities, as MaaS can offer flexible energy solutions without the need for large infrastructure investments.
Trend: Increasing integration of energy storage systems with microgrids is emerging as a significant trend, enhancing energy reliability and flexibility.
Regional Analysis: North America leads the market, driven by investments in grid modernization and renewable energy projects, with Asia-Pacific expected to experience the fastest growth.
Service Type:
The Microgrid as a Service (MaaS) market is categorized by several key services: Monitoring and Control Service, Operation and Maintenance Service, Software as a Service (SaaS), and Design and Consulting Service. Monitoring and Control Services are essential for real-time management of microgrid performance, optimizing energy usage, and detecting anomalies. Operation and Maintenance Services ensure smooth functioning and longevity of microgrid systems. SaaS offerings streamline data analysis and operational oversight through cloud-based platforms, allowing businesses to manage energy resources remotely. Design and Consulting Services are vital in the planning and customization of microgrids based on specific energy needs and infrastructure, especially for complex industrial applications. These services are critical for ensuring microgrid reliability and efficiency.
Grid Type:
The MaaS market is segmented into Grid-Connected Microgrids and Remote/Islanded Microgrids. Grid-connected microgrids are integrated with the main power grid, allowing energy to flow both ways—supplying excess energy back to the grid when required and drawing from it during shortages. This type is prevalent in urban and industrial sectors for enhanced energy efficiency and resilience. Remote/Islanded Microgrids, on the other hand, operate independently from the central grid, making them essential for providing power in isolated areas, remote industries, or disaster recovery zones. Their independence from traditional grids makes them highly valuable in regions lacking reliable energy infrastructure, supporting sustainable energy access.
End-User:
Key end-users of the MaaS market include Government, Commercial and Industrial, Healthcare, Educational Institutes, Military, and Utility sectors. Government agencies are focusing on microgrid solutions to enhance energy security and disaster resilience, especially in critical infrastructures. The Commercial and Industrial sectors utilize microgrids for cost-effective energy management and to ensure uninterrupted power for production processes. Healthcare facilities require highly reliable power sources, making microgrids indispensable for critical operations. Educational institutes adopt microgrids for both sustainability and cost-efficiency. The military relies on microgrids for secure and resilient energy supplies in bases, and Utility companies use them for load management and supporting renewable energy integration.
Power Source:
The Microgrid as a Service market is segmented based on power sources, including Renewable Energy, Combined Heat and Power (CHP), and Diesel Generators. Renewable energy microgrids, leveraging solar, wind, and hydroelectric sources, are rapidly gaining traction as the world shifts toward sustainable energy solutions. CHP systems offer a dual advantage by producing both electricity and useful heat from a single fuel source, enhancing energy efficiency in industrial settings. Diesel generators, while less eco-friendly, remain a key backup power source for microgrids in emergency or off-grid situations. The integration of diverse power sources allows microgrids to offer tailored energy solutions to meet specific regional or operational needs.
Region Analysis:
North America Dominates with the Largest Market Share in Microgrid as a Service (MaaS) Market: North America holds the largest market share in the Microgrid as a Service (MaaS) market, driven by significant investments in grid modernization, renewable energy integration, and a strong focus on energy security. The U.S., in particular, has implemented numerous microgrid projects, especially in urban centers and critical infrastructure like hospitals and military bases, due to the region’s advanced energy infrastructure and supportive government policies. North America’s regulatory framework encourages the adoption of microgrids to promote energy resilience, especially in response to increasing power outages caused by extreme weather events. Moreover, the region’s emphasis on decarbonization and sustainability is pushing the growth of renewable energy-based microgrids, solidifying its dominant position in the global MaaS market.
Asia-Pacific is projected to be the fastest-growing region in the Microgrid as a Service (MaaS) market, driven by rapid industrialization, urbanization, and the rising demand for reliable and sustainable energy solutions in countries like China and India. The region's growing energy needs, coupled with government initiatives to reduce carbon emissions and improve energy access in remote areas, are major growth drivers. Additionally, Asia-Pacific has been investing heavily in renewable energy, with microgrids serving as a key solution for integrating solar, wind, and other clean energy sources. Europe, Latin America, and the Middle East & Africa are also seeing growth, particularly in rural electrification and energy management projects, though they trail behind North America and Asia-Pacific in overall market size.
By Service Type(Monitoring and Control Service, Operation and Maintenance Service, SaaS, Design and Consulting Service), Grid Type(Grid-Connected Microgrids, Remote/Islanded Microgrids), End-User(Government, Commercial and Industrial, Healthcare, Educational Institutes, Military, Utility), Power Source(Renewable Energy, Combined Heat and Power (CHP), Diesel Generators)
Research Methodology
Primary Research- 100 Interviews of Stakeholders
Secondary Research
Desk Research
Regional scope
North America (United States, Canada, Mexico)
Latin America (Brazil, Argentina, Columbia)
East Asia And Pacific (China, Japan, South Korea, Australia, Cambodia, Fiji, Indonesia)
Sea And South Asia (India, Singapore, Thailand, Taiwan, Malaysia)
Eastern Europe (Poland, Russia, Czech Republic, Romania)
Western Europe (Germany, U.K., France, Spain, Itlay)
Middle East & Africa (GCC Countries, Egypt, Nigeria, South Africa, Israel)
Competitive Landscape
Siemens AG, Schneider Electric SE, General Electric, ABB Ltd., Eaton Corporation, Honeywell International Inc., Exelon Corporation, Spirae LLC, NRG Energy Inc., S&C Electric Company, Hitachi Ltd., Toshiba Corporation, Duke Energy Corporation, PowerSecure Inc., Anbaric Development Partners, ENGIE Group, Green Energy Corp, Bloom Energy Corporation, Cummins Inc., Advanced Microgrid Solutions
Customization Scope
Customization for segments, region/country-level will be provided. Moreover, additional customization can be done based on the requirements.
Pricing and Purchase Options
Avail customized purchase options to meet your exact research needs. We have three licenses to opt for: Single User License, Multi-User License (Up to 5 Users), Corporate Use License (Unlimited User and Printable PDF).
TABLE OF CONTENTS
1. EXECUTIVE SUMMARY
1.1. MARKET SNAPSHOT
1.2. KEY FINDINGS & INSIGHTS
1.3. ANALYST RECOMMENDATIONS
1.4. FUTURE OUTLOOK
2. RESEARCH METHODOLOGY
2.1. MARKET DEFINITION & SCOPE
2.2. RESEARCH OBJECTIVES: PRIMARY & SECONDARY DATA SOURCES
2.3. DATA COLLECTION SOURCES
2.3.1. COVERAGE OF 100+ PRIMARY RESEARCH/CONSULTATION CALLS WITH INDUSTRY STAKEHOLDERS
FIGURE 17 NORTH AMERICA MICROGRID AS A SERVICE (MAAS) CURRENT AND FUTURE TYPE ANALYSIS, 2025–2034, (USD MILLION)
FIGURE 18 NORTH AMERICA MICROGRID AS A SERVICE (MAAS) CURRENT AND FUTURE END USER ANALYSIS, 2025–2034, (USD MILLION)
FIGURE 19 MARKET SHARE BY COUNTRY
FIGURE 20 LATIN AMERICA MICROGRID AS A SERVICE (MAAS) CURRENT AND FUTURE TYPE ANALYSIS, 2025–2034, (USD MILLION)
FIGURE 21 LATIN AMERICA MICROGRID AS A SERVICE (MAAS) CURRENT AND FUTURE END USER ANALYSIS, 2025–2034, (USD MILLION)
FIGURE 22 MARKET SHARE BY COUNTRY
FIGURE 23 EASTERN EUROPE MICROGRID AS A SERVICE (MAAS) CURRENT AND FUTURE TYPE ANALYSIS, 2025–2034, (USD MILLION)
FIGURE 24 EASTERN EUROPE MICROGRID AS A SERVICE (MAAS) CURRENT AND FUTURE END USER ANALYSIS, 2025–2034, (USD MILLION)
FIGURE 25 MARKET SHARE BY COUNTRY
FIGURE 26 WESTERN EUROPE MICROGRID AS A SERVICE (MAAS) CURRENT AND FUTURE TYPE ANALYSIS, 2025–2034, (USD MILLION)
FIGURE 27 WESTERN EUROPE MICROGRID AS A SERVICE (MAAS) CURRENT AND FUTURE END USER ANALYSIS, 2025–2034, (USD MILLION)
FIGURE 28 MARKET SHARE BY COUNTRY
FIGURE 29 EAST ASIA AND PACIFIC MICROGRID AS A SERVICE (MAAS) CURRENT AND FUTURE TYPE ANALYSIS, 2025–2034, (USD MILLION)
FIGURE 30 EAST ASIA AND PACIFIC MICROGRID AS A SERVICE (MAAS) CURRENT AND FUTURE END USER ANALYSIS, 2025–2034, (USD MILLION)
FIGURE 31 MARKET SHARE BY COUNTRY
FIGURE 32 SEA AND SOUTH ASIA MICROGRID AS A SERVICE (MAAS) CURRENT AND FUTURE TYPE ANALYSIS, 2025–2034, (USD MILLION)
FIGURE 33 SEA AND SOUTH ASIA MICROGRID AS A SERVICE (MAAS) CURRENT AND FUTURE END USER ANALYSIS, 2025–2034, (USD MILLION)
FIGURE 34 MARKET SHARE BY COUNTRY
FIGURE 35 MIDDLE EAST AND AFRICA MICROGRID AS A SERVICE (MAAS) CURRENT AND FUTURE TYPE ANALYSIS, 2025–2034, (USD MILLION)
FIGURE 36 MIDDLE EAST AND AFRICA MICROGRID AS A SERVICE (MAAS) CURRENT AND FUTURE END USER ANALYSIS, 2025–2034, (USD MILLION)
FIGURE 37 NORTH AMERICA MICROGRID AS A SERVICE (MAAS) CURRENT AND FUTURE MARKET VOLUME SHARE REGIONAL ANALYSIS, 2025–2034, (USD MILLION)
FIGURE 38 U.S. MICROGRID AS A SERVICE (MAAS) CURRENT AND FUTURE TYPE ANALYSIS, 2025–2034, (USD MILLION)
FIGURE 39 U.S. MICROGRID AS A SERVICE (MAAS) CURRENT AND FUTURE END USER ANALYSIS, 2025–2034, (USD MILLION)
FIGURE 40 CANADA MICROGRID AS A SERVICE (MAAS) CURRENT AND FUTURE TYPE ANALYSIS, 2025–2034, (USD MILLION)
FIGURE 41 CANADA MICROGRID AS A SERVICE (MAAS) CURRENT AND FUTURE END USER ANALYSIS, 2025–2034, (USD MILLION)
FIGURE 42 LATIN AMERICA MICROGRID AS A SERVICE (MAAS) CURRENT AND FUTURE MARKET VOLUME SHARE REGIONAL ANALYSIS, 2025–2034, (USD MILLION)
FIGURE 43 MEXICO MICROGRID AS A SERVICE (MAAS) CURRENT AND FUTURE TYPE ANALYSIS, 2025–2034, (USD MILLION)
FIGURE 44 MEXICO MICROGRID AS A SERVICE (MAAS) CURRENT AND FUTURE END USER ANALYSIS, 2025–2034, (USD MILLION)
FIGURE 45 BRAZIL MICROGRID AS A SERVICE (MAAS) CURRENT AND FUTURE TYPE ANALYSIS, 2025–2034, (USD MILLION)
FIGURE 46 BRAZIL MICROGRID AS A SERVICE (MAAS) CURRENT AND FUTURE END USER ANALYSIS, 2025–2034, (USD MILLION)
FIGURE 47 ARGENTINA MICROGRID AS A SERVICE (MAAS) CURRENT AND FUTURE TYPE ANALYSIS, 2025–2034, (USD MILLION)
FIGURE 48 ARGENTINA MICROGRID AS A SERVICE (MAAS) CURRENT AND FUTURE END USER ANALYSIS, 2025–2034, (USD MILLION)
FIGURE 49 COLUMBIA MICROGRID AS A SERVICE (MAAS) CURRENT AND FUTURE TYPE ANALYSIS, 2025–2034, (USD MILLION)
FIGURE 50 COLUMBIA MICROGRID AS A SERVICE (MAAS) CURRENT AND FUTURE END USER ANALYSIS, 2025–2034, (USD MILLION)
FIGURE 51 REST OF LATIN AMERICA MICROGRID AS A SERVICE (MAAS) CURRENT AND FUTURE TYPE ANALYSIS, 2025–2034, (USD MILLION)
FIGURE 52 REST OF LATIN AMERICA MICROGRID AS A SERVICE (MAAS) CURRENT AND FUTURE END USER ANALYSIS, 2025–2034, (USD MILLION)
FIGURE 53 EASTERN EUROPE MICROGRID AS A SERVICE (MAAS) CURRENT AND FUTURE MARKET VOLUME SHARE REGIONAL ANALYSIS, 2025–2034, (USD MILLION)
FIGURE 54 POLAND MICROGRID AS A SERVICE (MAAS) CURRENT AND FUTURE TYPE ANALYSIS, 2025–2034, (USD MILLION)
FIGURE 55 POLAND MICROGRID AS A SERVICE (MAAS) CURRENT AND FUTURE END USER ANALYSIS, 2025–2034, (USD MILLION)
FIGURE 56 RUSSIA MICROGRID AS A SERVICE (MAAS) CURRENT AND FUTURE TYPE ANALYSIS, 2025–2034, (USD MILLION)
FIGURE 57 RUSSIA MICROGRID AS A SERVICE (MAAS) CURRENT AND FUTURE END USER ANALYSIS, 2025–2034, (USD MILLION)
FIGURE 58 CZECH REPUBLIC MICROGRID AS A SERVICE (MAAS) CURRENT AND FUTURE TYPE ANALYSIS, 2025–2034, (USD MILLION)
FIGURE 59 CZECH REPUBLIC MICROGRID AS A SERVICE (MAAS) CURRENT AND FUTURE END USER ANALYSIS, 2025–2034, (USD MILLION)
FIGURE 60 ROMANIA MICROGRID AS A SERVICE (MAAS) CURRENT AND FUTURE TYPE ANALYSIS, 2025–2034, (USD MILLION)
FIGURE 61 ROMANIA MICROGRID AS A SERVICE (MAAS) CURRENT AND FUTURE END USER ANALYSIS, 2025–2034, (USD MILLION)
FIGURE 62 REST OF EASTERN EUROPE MICROGRID AS A SERVICE (MAAS) CURRENT AND FUTURE TYPE ANALYSIS, 2025–2034, (USD MILLION)
FIGURE 63 REST OF EASTERN EUROPE MICROGRID AS A SERVICE (MAAS) CURRENT AND FUTURE END USER ANALYSIS, 2025–2034, (USD MILLION)
FIGURE 64 WESTERN EUROPE MICROGRID AS A SERVICE (MAAS) CURRENT AND FUTURE MARKET VOLUME SHARE REGIONAL ANALYSIS, 2025–2034, (USD MILLION)
FIGURE 65 GERMANY MICROGRID AS A SERVICE (MAAS) CURRENT AND FUTURE TYPE ANALYSIS, 2025–2034, (USD MILLION)
FIGURE 66 GERMANY MICROGRID AS A SERVICE (MAAS) CURRENT AND FUTURE END USER ANALYSIS, 2025–2034, (USD MILLION)
FIGURE 67 FRANCE MICROGRID AS A SERVICE (MAAS) CURRENT AND FUTURE TYPE ANALYSIS, 2025–2034, (USD MILLION)
FIGURE 68 FRANCE MICROGRID AS A SERVICE (MAAS) CURRENT AND FUTURE END USER ANALYSIS, 2025–2034, (USD MILLION)
FIGURE 69 UK MICROGRID AS A SERVICE (MAAS) CURRENT AND FUTURE TYPE ANALYSIS, 2025–2034, (USD MILLION)
FIGURE 70 UK MICROGRID AS A SERVICE (MAAS) CURRENT AND FUTURE END USER ANALYSIS, 2025–2034, (USD MILLION)
FIGURE 71 SPAIN MICROGRID AS A SERVICE (MAAS) CURRENT AND FUTURE TYPE ANALYSIS, 2025–2034, (USD MILLION)
FIGURE 72 SPAIN MICROGRID AS A SERVICE (MAAS) CURRENT AND FUTURE END USER ANALYSIS, 2025–2034, (USD MILLION)
FIGURE 73 ITALY MICROGRID AS A SERVICE (MAAS) CURRENT AND FUTURE TYPE ANALYSIS, 2025–2034, (USD MILLION)
FIGURE 74 ITALY MICROGRID AS A SERVICE (MAAS) CURRENT AND FUTURE END USER ANALYSIS, 2025–2034, (USD MILLION)
FIGURE 75 REST OF WESTERN EUROPE MICROGRID AS A SERVICE (MAAS) CURRENT AND FUTURE TYPE ANALYSIS, 2025–2034, (USD MILLION)
FIGURE 76 REST OF WESTERN EUROPE MICROGRID AS A SERVICE (MAAS) CURRENT AND FUTURE END USER ANALYSIS, 2025–2034, (USD MILLION)
FIGURE 77 EAST ASIA AND PACIFIC MICROGRID AS A SERVICE (MAAS) CURRENT AND FUTURE MARKET VOLUME SHARE REGIONAL ANALYSIS, 2025–2034, (USD MILLION)
FIGURE 78 CHINA MICROGRID AS A SERVICE (MAAS) CURRENT AND FUTURE TYPE ANALYSIS, 2025–2034, (USD MILLION)
FIGURE 79 CHINA MICROGRID AS A SERVICE (MAAS) CURRENT AND FUTURE END USER ANALYSIS, 2025–2034, (USD MILLION)
FIGURE 80 JAPAN MICROGRID AS A SERVICE (MAAS) CURRENT AND FUTURE TYPE ANALYSIS, 2025–2034, (USD MILLION)
FIGURE 81 JAPAN MICROGRID AS A SERVICE (MAAS) CURRENT AND FUTURE END USER ANALYSIS, 2025–2034, (USD MILLION)
FIGURE 82 AUSTRALIA MICROGRID AS A SERVICE (MAAS) CURRENT AND FUTURE TYPE ANALYSIS, 2025–2034, (USD MILLION)
FIGURE 83 AUSTRALIA MICROGRID AS A SERVICE (MAAS) CURRENT AND FUTURE END USER ANALYSIS, 2025–2034, (USD MILLION)
FIGURE 84 CAMBODIA MICROGRID AS A SERVICE (MAAS) CURRENT AND FUTURE TYPE ANALYSIS, 2025–2034, (USD MILLION)
FIGURE 85 CAMBODIA MICROGRID AS A SERVICE (MAAS) CURRENT AND FUTURE END USER ANALYSIS, 2025–2034, (USD MILLION)
FIGURE 86 FIJI MICROGRID AS A SERVICE (MAAS) CURRENT AND FUTURE TYPE ANALYSIS, 2025–2034, (USD MILLION)
FIGURE 87 FIJI MICROGRID AS A SERVICE (MAAS) CURRENT AND FUTURE END USER ANALYSIS, 2025–2034, (USD MILLION)
FIGURE 88 INDONESIA MICROGRID AS A SERVICE (MAAS) CURRENT AND FUTURE TYPE ANALYSIS, 2025–2034, (USD MILLION)
FIGURE 89 INDONESIA MICROGRID AS A SERVICE (MAAS) CURRENT AND FUTURE END USER ANALYSIS, 2025–2034, (USD MILLION)
FIGURE 90 SOUTH KOREA MICROGRID AS A SERVICE (MAAS) CURRENT AND FUTURE TYPE ANALYSIS, 2025–2034, (USD MILLION)
FIGURE 91 SOUTH KOREA MICROGRID AS A SERVICE (MAAS) CURRENT AND FUTURE END USER ANALYSIS, 2025–2034, (USD MILLION)
FIGURE 92 REST OF EAST ASIA AND PACIFIC MICROGRID AS A SERVICE (MAAS) CURRENT AND FUTURE TYPE ANALYSIS, 2025–2034, (USD MILLION)
FIGURE 93 REST OF EAST ASIA AND PACIFIC MICROGRID AS A SERVICE (MAAS) CURRENT AND FUTURE END USER ANALYSIS, 2025–2034, (USD MILLION)
FIGURE 94 SEA AND SOUTH ASIA MICROGRID AS A SERVICE (MAAS) CURRENT AND FUTURE MARKET VOLUME SHARE REGIONAL ANALYSIS, 2025–2034, (USD MILLION)
FIGURE 95 BANGLADESH MICROGRID AS A SERVICE (MAAS) CURRENT AND FUTURE TYPE ANALYSIS, 2025–2034, (USD MILLION)
FIGURE 96 BANGLADESH MICROGRID AS A SERVICE (MAAS) CURRENT AND FUTURE END USER ANALYSIS, 2025–2034, (USD MILLION)
FIGURE 97 NEW ZEALAND MICROGRID AS A SERVICE (MAAS) CURRENT AND FUTURE TYPE ANALYSIS, 2025–2034, (USD MILLION)
FIGURE 98 NEW ZEALAND MICROGRID AS A SERVICE (MAAS) CURRENT AND FUTURE END USER ANALYSIS, 2025–2034, (USD MILLION)
FIGURE 99 INDIA MICROGRID AS A SERVICE (MAAS) CURRENT AND FUTURE TYPE ANALYSIS, 2025–2034, (USD MILLION)
FIGURE 100 INDIA MICROGRID AS A SERVICE (MAAS) CURRENT AND FUTURE END USER ANALYSIS, 2025–2034, (USD MILLION)
FIGURE 101 SINGAPORE MICROGRID AS A SERVICE (MAAS) CURRENT AND FUTURE TYPE ANALYSIS, 2025–2034, (USD MILLION)
FIGURE 102 SINGAPORE MICROGRID AS A SERVICE (MAAS) CURRENT AND FUTURE END USER ANALYSIS, 2025–2034, (USD MILLION)
FIGURE 103 THAILAND MICROGRID AS A SERVICE (MAAS) CURRENT AND FUTURE TYPE ANALYSIS, 2025–2034, (USD MILLION)
FIGURE 104 THAILAND MICROGRID AS A SERVICE (MAAS) CURRENT AND FUTURE END USER ANALYSIS, 2025–2034, (USD MILLION)
FIGURE 105 TAIWAN MICROGRID AS A SERVICE (MAAS) CURRENT AND FUTURE TYPE ANALYSIS, 2025–2034, (USD MILLION)
FIGURE 106 TAIWAN MICROGRID AS A SERVICE (MAAS) CURRENT AND FUTURE END USER ANALYSIS, 2025–2034, (USD MILLION)
FIGURE 107 MALAYSIA MICROGRID AS A SERVICE (MAAS) CURRENT AND FUTURE TYPE ANALYSIS, 2025–2034, (USD MILLION)
FIGURE 108 MALAYSIA MICROGRID AS A SERVICE (MAAS) CURRENT AND FUTURE END USER ANALYSIS, 2025–2034, (USD MILLION)
FIGURE 109 REST OF SEA AND SOUTH ASIA MICROGRID AS A SERVICE (MAAS) CURRENT AND FUTURE TYPE ANALYSIS, 2025–2034, (USD MILLION)
FIGURE 110 REST OF SEA AND SOUTH ASIA MICROGRID AS A SERVICE (MAAS) CURRENT AND FUTURE END USER ANALYSIS, 2025–2034, (USD MILLION)
FIGURE 111 MIDDLE EAST AND AFRICA MICROGRID AS A SERVICE (MAAS) CURRENT AND FUTURE MARKET VOLUME SHARE REGIONAL ANALYSIS, 2025–2034, (USD MILLION)
FIGURE 112 GCC COUNTRIES MICROGRID AS A SERVICE (MAAS) CURRENT AND FUTURE TYPE ANALYSIS, 2025–2034, (USD MILLION)
FIGURE 113 GCC COUNTRIES MICROGRID AS A SERVICE (MAAS) CURRENT AND FUTURE END USER ANALYSIS, 2025–2034, (USD MILLION)
FIGURE 114 SAUDI ARABIA MICROGRID AS A SERVICE (MAAS) CURRENT AND FUTURE TYPE ANALYSIS, 2025–2034, (USD MILLION)
FIGURE 115 SAUDI ARABIA MICROGRID AS A SERVICE (MAAS) CURRENT AND FUTURE END USER ANALYSIS, 2025–2034, (USD MILLION)
FIGURE 116 UAE MICROGRID AS A SERVICE (MAAS) CURRENT AND FUTURE TYPE ANALYSIS, 2025–2034, (USD MILLION)
FIGURE 117 UAE MICROGRID AS A SERVICE (MAAS) CURRENT AND FUTURE END USER ANALYSIS, 2025–2034, (USD MILLION)
FIGURE 118 BAHRAIN MICROGRID AS A SERVICE (MAAS) CURRENT AND FUTURE TYPE ANALYSIS, 2025–2034, (USD MILLION)
FIGURE 119 BAHRAIN MICROGRID AS A SERVICE (MAAS) CURRENT AND FUTURE END USER ANALYSIS, 2025–2034, (USD MILLION)
FIGURE 120 KUWAIT MICROGRID AS A SERVICE (MAAS) CURRENT AND FUTURE TYPE ANALYSIS, 2025–2034, (USD MILLION)
FIGURE 121 KUWAIT MICROGRID AS A SERVICE (MAAS) CURRENT AND FUTURE END USER ANALYSIS, 2025–2034, (USD MILLION)
FIGURE 122 OMAN MICROGRID AS A SERVICE (MAAS) CURRENT AND FUTURE TYPE ANALYSIS, 2025–2034, (USD MILLION)
FIGURE 123 OMAN MICROGRID AS A SERVICE (MAAS) CURRENT AND FUTURE END USER ANALYSIS, 2025–2034, (USD MILLION)
FIGURE 124 QATAR MICROGRID AS A SERVICE (MAAS) CURRENT AND FUTURE TYPE ANALYSIS, 2025–2034, (USD MILLION)
FIGURE 125 QATAR MICROGRID AS A SERVICE (MAAS) CURRENT AND FUTURE END USER ANALYSIS, 2025–2034, (USD MILLION)
FIGURE 126 EGYPT MICROGRID AS A SERVICE (MAAS) CURRENT AND FUTURE TYPE ANALYSIS, 2025–2034, (USD MILLION)
FIGURE 127 EGYPT MICROGRID AS A SERVICE (MAAS) CURRENT AND FUTURE END USER ANALYSIS, 2025–2034, (USD MILLION)
FIGURE 128 NIGERIA MICROGRID AS A SERVICE (MAAS) CURRENT AND FUTURE TYPE ANALYSIS, 2025–2034, (USD MILLION)
FIGURE 129 NIGERIA MICROGRID AS A SERVICE (MAAS) CURRENT AND FUTURE END USER ANALYSIS, 2025–2034, (USD MILLION)
FIGURE 130 SOUTH AFRICA MICROGRID AS A SERVICE (MAAS) CURRENT AND FUTURE TYPE ANALYSIS, 2025–2034, (USD MILLION)
FIGURE 131 SOUTH AFRICA MICROGRID AS A SERVICE (MAAS) CURRENT AND FUTURE END USER ANALYSIS, 2025–2034, (USD MILLION)
FIGURE 132 ISRAEL MICROGRID AS A SERVICE (MAAS) CURRENT AND FUTURE TYPE ANALYSIS, 2025–2034, (USD MILLION)
FIGURE 133 ISRAEL MICROGRID AS A SERVICE (MAAS) CURRENT AND FUTURE END USER ANALYSIS, 2025–2034, (USD MILLION)
FIGURE 134 REST OF MEA MICROGRID AS A SERVICE (MAAS) CURRENT AND FUTURE TYPE ANALYSIS, 2025–2034, (USD MILLION)
FIGURE 135 REST OF MEA MICROGRID AS A SERVICE (MAAS) CURRENT AND FUTURE END USER ANALYSIS, 2025–2034, (USD MILLION)
FIGURE 136 U. S. MARKET SHARE ANALYSIS BY TYPE (2024)
FIGURE 137 U. S. MARKET SHARE ANALYSIS BY END USER (2024)
FIGURE 138 CANADA MARKET SHARE ANALYSIS BY TYPE (2024)
FIGURE 139 CANADA MARKET SHARE ANALYSIS BY END USER (2024)
FIGURE 140 MEXICO MARKET SHARE ANALYSIS BY TYPE (2024)
FIGURE 141 MEXICO MARKET SHARE ANALYSIS BY END USER (2024)
FIGURE 142 CHINA MARKET SHARE ANALYSIS BY TYPE (2024)
FIGURE 143 CHINA MARKET SHARE ANALYSIS BY END USER (2024)
FIGURE 144 JAPAN MARKET SHARE ANALYSIS BY TYPE (2024)
FIGURE 145 JAPAN MARKET SHARE ANALYSIS BY END USER (2024)
FIGURE 146 INDIA MARKET SHARE ANALYSIS BY TYPE (2024)
FIGURE 147 INDIA MARKET SHARE ANALYSIS BY END USER (2024)
FIGURE 148 SOUTH KOREA MARKET SHARE ANALYSIS BY TYPE (2024)
FIGURE 149 SOUTH KOREA MARKET SHARE ANALYSIS BY END USER (2024)
FIGURE 150 SAUDI ARABIA MARKET SHARE ANALYSIS BY TYPE (2024)
FIGURE 151 SAUDI ARABIA MARKET SHARE ANALYSIS BY END USER (2024)
FIGURE 152 UAE MARKET SHARE ANALYSIS BY TYPE (2024)
FIGURE 153 UAE MARKET SHARE ANALYSIS BY END USER (2024)
FIGURE 154 EGYPT MARKET SHARE ANALYSIS BY TYPE (2024)
FIGURE 155 EGYPT MARKET SHARE ANALYSIS BY END USER (2024)
FIGURE 156 NIGERIA MARKET SHARE ANALYSIS BY TYPE (2024)
FIGURE 157 NIGERIA MARKET SHARE ANALYSIS BY END USER (2024)
FIGURE 158 SOUTH AFRICA MARKET SHARE ANALYSIS BY TYPE (2024)
FIGURE 159 SOUTH AFRICA MARKET SHARE ANALYSIS BY END USER (2024)
FIGURE 160 GERMANY MARKET SHARE ANALYSIS BY TYPE (2024)
FIGURE 161 GERMANY MARKET SHARE ANALYSIS BY END USER (2024)
FIGURE 162 FRANCE MARKET SHARE ANALYSIS BY TYPE (2024)
FIGURE 163 FRANCE MARKET SHARE ANALYSIS BY END USER (2024)
FIGURE 164 UK MARKET SHARE ANALYSIS BY TYPE (2024)
FIGURE 165 UK MARKET SHARE ANALYSIS BY END USER (2024)
FIGURE 166 SPAIN MARKET SHARE ANALYSIS BY TYPE (2024)
FIGURE 167 SPAIN MARKET SHARE ANALYSIS BY END USER (2024)
FIGURE 168 ITALY MARKET SHARE ANALYSIS BY TYPE (2024)
FIGURE 169 ITALY MARKET SHARE ANALYSIS BY END USER (2024)
FIGURE 170 BRAZIL MARKET SHARE ANALYSIS BY TYPE (2024)
FIGURE 171 BRAZIL MARKET SHARE ANALYSIS BY END USER (2024)
FIGURE 172 ARGENTINA MARKET SHARE ANALYSIS BY TYPE (2024)
FIGURE 173 ARGENTINA MARKET SHARE ANALYSIS BY END USER (2024)
FIGURE 174 COLUMBIA MARKET SHARE ANALYSIS BY TYPE (2024)
FIGURE 175 COLUMBIA MARKET SHARE ANALYSIS BY END USER (2024)
FIGURE 176 GLOBAL MICROGRID AS A SERVICE (MAAS) CURRENT AND FUTURE MARKET KEY COUNTRY LEVEL ANALYSIS, 2024–2034, (USD MILLION)
FIGURE 177 FINANCIAL OVERVIEW:
Key Players Analysis:
Siemens AG: Siemens AG is a global technology powerhouse based in Munich, Germany, with a strong presence in the energy, industrial automation, and infrastructure sectors. In the Microgrid as a Service (MaaS) market, Siemens offers advanced microgrid solutions that integrate renewable energy and energy storage. Their business strategy focuses on digitalization, sustainability, and enhancing energy security.
Schneider Electric SE: Headquartered in Rueil-Malmaison, France, Schneider Electric specializes in energy management and automation solutions. The company provides MaaS offerings that include microgrid design, operation, and management services. Their microgrid solutions focus on increasing energy efficiency, resilience, and sustainability. Schneider's strategy revolves around promoting decentralized energy and driving innovation in renewable integration and smart energy management.
General Electric (GE): General Electric, based in Boston, Massachusetts, is a multinational conglomerate involved in power generation, renewable energy, and grid solutions. In the MaaS market, GE provides energy-efficient microgrid systems, integrating renewables and storage. Their strategy emphasizes creating resilient energy infrastructures and advancing digital grid technologies to enhance global energy access and sustainability.
ABB Ltd.: ABB Ltd., based in Zurich, Switzerland, is a leader in electrification and automation technologies. ABB’s microgrid solutions are designed to improve energy reliability and efficiency by integrating renewable energy sources and energy storage. Their business strategy emphasizes innovation in energy transition technologies, focusing on carbon reduction and decentralized energy systems to meet future energy demands.
Eaton Corporation: Eaton Corporation, headquartered in Dublin, Ireland, provides energy-efficient products and services for electrical power management. Eaton’s microgrid solutions focus on enhancing energy resilience and sustainability, offering integration with renewable energy and energy storage systems. Their strategy is centered on creating intelligent power solutions that support the global energy transition towards cleaner, decentralized power grids.
Honeywell International Inc.: Based in Charlotte, North Carolina, Honeywell International Inc. is a diversified technology and manufacturing company. Honeywell provides microgrid control systems and energy management solutions for industries and critical infrastructure. Their MaaS solutions emphasize energy reliability and operational efficiency. The company’s strategy focuses on advancing smart technologies and optimizing energy usage through automation and AI-driven systems.
Exelon Corporation: Exelon Corporation, headquartered in Chicago, Illinois, is a leading energy provider, with a significant focus on renewable energy and grid modernization. Exelon offers microgrid solutions through its subsidiaries, aiming to improve grid resilience and energy access. Their strategy includes investments in clean energy technologies and modernizing energy infrastructure to enhance sustainability and reliability.
Spirae LLC: Spirae LLC, based in Fort Collins, Colorado, provides software platforms for microgrid management, focusing on distributed energy resource (DER) integration. Spirae's MaaS offerings enable seamless energy management by integrating renewables, storage, and grid systems. Their strategy emphasizes innovation in energy management software and supporting the transition to decentralized, sustainable energy systems.
NRG Energy, Inc.: Headquartered in Houston, Texas, NRG Energy is a leading energy company offering a range of power solutions, including microgrid services. NRG’s MaaS provides energy solutions that improve reliability and integrate renewable energy. Their business strategy focuses on decarbonization, energy transition, and offering customer-centric, flexible energy services to meet the growing demand for sustainable energy.
S&C Electric Company: S&C Electric Company, based in Chicago, Illinois, specializes in electric power switching and protection systems. S&C provides MaaS solutions that enhance grid resilience and reliability, particularly for critical infrastructure. Their microgrid solutions are tailored to seamlessly integrate renewable energy sources. The company’s strategy centers around innovation in grid reliability and increasing the efficiency of distributed energy resources.
Market Key Players
Siemens AG
Schneider Electric SE
General Electric
ABB Ltd.
Eaton Corporation
Honeywell International Inc.
Exelon Corporation
Spirae LLC
NRG Energy, Inc.
S&C Electric Company
Hitachi, Ltd.
Toshiba Corporation
Duke Energy Corporation
PowerSecure, Inc.
Anbaric Development Partners
ENGIE Group
Green Energy Corp
Bloom Energy Corporation
Cummins Inc.
Advanced Microgrid Solutions
Driver:
Growing Demand for Decentralized Energy Systems:
The increasing reliance on decentralized energy systems is a key driver for the Microgrid as a Service (MaaS) market. Traditional centralized grids are prone to failures due to aging infrastructure, and the demand for more resilient and flexible energy solutions is rising. Microgrids offer localized energy generation, enabling them to function autonomously in the event of a grid failure, ensuring continuity for critical operations in sectors such as healthcare, military, and commercial industries. Additionally, the need for greater energy independence, particularly in regions prone to natural disasters and power outages, is fueling the adoption of microgrids. This transition to decentralized energy models is set to enhance the MaaS market significantly.
Rising Adoption of Renewable Energy:
The global shift toward clean and sustainable energy sources is significantly driving the MaaS market. Microgrids are highly compatible with renewable energy technologies, such as solar, wind, and hydropower, which are being integrated into energy systems worldwide. Governments and corporations are increasingly investing in renewable energy microgrids to reduce their carbon footprints and comply with stringent environmental regulations. This transition aligns with global efforts to combat climate change, as renewable energy sources help reduce reliance on fossil fuels. The versatility of microgrids in managing intermittent renewable energy sources, along with energy storage solutions, enhances their appeal and is contributing to the rapid expansion of the market.
Government Initiatives and Regulatory Support:
Governments across the globe are increasingly focusing on enhancing energy security and resilience, creating favorable conditions for the MaaS market. Various regions are offering financial incentives, subsidies, and tax benefits to promote the deployment of microgrids, particularly in sectors like healthcare, defense, and critical infrastructure. Regulatory frameworks aimed at reducing greenhouse gas emissions and transitioning to renewable energy are also fostering microgrid adoption. In countries like the U.S., Canada, and Germany, government initiatives for smart grid technologies and renewable energy integration are further boosting the growth of the MaaS market, making it an attractive solution for sustainable and reliable energy management.
Restraints:
High Initial Setup Costs:
One of the major challenges for the growth of the MaaS market is the high initial investment required for microgrid infrastructure. The costs of installing advanced technologies, such as renewable energy sources, energy storage systems, and grid interconnection equipment, are significant. This financial burden is especially challenging for smaller businesses and developing regions, where upfront capital may be limited. Additionally, the complexity of integrating different energy sources and ensuring interoperability with existing grid systems adds to the cost. Although the long-term operational savings and efficiency gains from microgrids are evident, the initial setup costs can be a barrier to widespread adoption.
Complexity of Integration and Regulatory Barriers:
The integration of microgrids with existing grid infrastructure can be a complicated process, requiring careful coordination of technical, operational, and regulatory aspects. Microgrids must ensure seamless interoperability with the main power grid, especially in regions where centralized energy systems dominate. Furthermore, regulatory environments in certain countries may not fully support the deployment of decentralized energy systems, presenting another challenge for market growth. Regulations regarding grid interconnection, energy tariffs, and the operation of distributed generation assets vary significantly across regions. These complexities can slow down the deployment process and hinder the widespread adoption of microgrids as a service, especially in regions with outdated regulatory frameworks.
Opportunities:
Expansion in Remote and Underserved Areas:
One of the biggest opportunities for the MaaS market lies in providing reliable energy solutions to remote and underserved regions. In many developing nations and isolated communities, access to electricity is limited or unreliable due to insufficient grid infrastructure. Microgrids offer a practical and scalable solution to bring consistent power to these areas, bypassing the need for extensive central grid extensions. This opportunity is especially relevant in regions of Asia-Pacific and Africa, where governments and organizations are increasingly turning to microgrids to provide energy for rural development, disaster recovery, and remote industrial operations. The market stands to gain substantially by addressing these unmet energy needs.
Growing Demand for Energy Storage Integration:
The integration of advanced energy storage systems with microgrids is a significant growth opportunity in the MaaS market. As renewable energy sources, such as solar and wind, are intermittent, energy storage systems like batteries are crucial for ensuring a reliable and stable power supply. The increasing affordability and technological advancements in energy storage systems are making them more accessible for microgrid solutions. This is particularly important for sectors like healthcare and military operations, where an uninterrupted power supply is critical. The ability to store excess energy and release it when needed enhances the efficiency and reliability of microgrids, making energy storage a key opportunity for market expansion.
Trend:
Increasing Focus on Energy Security and Resilience:
One notable trend in the MaaS market is the growing emphasis on energy security and resilience, especially in response to climate-related disasters and increasing power outages. Both public and private sectors are prioritizing resilient energy solutions that can operate independently of the central grid, ensuring continuity during disruptions. Microgrids offer this capability, making them an attractive option for sectors such as healthcare, military, and critical infrastructure. As extreme weather events become more frequent and severe, the demand for microgrid solutions to protect against prolonged outages and support emergency operations is expected to grow, driving the market forward.
Recent Development:
In October 2024: Aspen Technology launched the AspenTech Microgrid Management System™, designed to help companies in energy-intensive industries optimize power generation and storage while meeting their net-zero goals. This new product offers real-time control, scheduling capabilities, and optimization tools to enhance both operational efficiency and sustainability, especially in industries like chemicals, refining, and mining.
In September 2024: Schneider Electric announced a strategic partnership with Siemens to collaborate on the development of advanced energy management solutions. This collaboration focuses on integrating Schneider’s automation solutions with Siemens’ digital technologies to enhance energy efficiency in industrial operations.
Frequently Asked Questions
How big is the Microgrid as a Service (MaaS) Market?
The Global Microgrid as a Service (MaaS) Market is set for explosive growth, projected to reach $11.16 Billion by 2034 (CAGR 10.8%). Discover how the demand for energy resilience, decentralized power, and zero-CAPEX solutions is driving massive adoption across commercial and industrial sectors.
Who are the major players in the Microgrid as a Service (MaaS) Market?
Siemens AG, Schneider Electric SE, General Electric, ABB Ltd., Eaton Corporation, Honeywell International Inc., Exelon Corporation, Spirae LLC, NRG Energy Inc., S&C Electric Company, Hitachi Ltd., Toshiba Corporation, Duke Energy Corporation, PowerSecure Inc., Anbaric Development Partners, ENGIE Group, Green Energy Corp, Bloom Energy Corporation, Cummins Inc., Advanced Microgrid Solutions
Which segments covered the Microgrid as a Service (MaaS) Market?
By Service Type(Monitoring and Control Service, Operation and Maintenance Service, SaaS, Design and Consulting Service), Grid Type(Grid-Connected Microgrids, Remote/Islanded Microgrids), End-User(Government, Commercial and Industrial, Healthcare, Educational Institutes, Military, Utility), Power Source(Renewable Energy, Combined Heat and Power (CHP), Diesel Generators)
How can this market research report help my business make strategic decisions?
Our market research reports provide actionable intelligence, including verified market size data, CAGR projections, competitive benchmarking, and segment-level opportunity analysis. These insights support strategic planning, investment decisions, product development, and market entry strategies for enterprises and startups alike.
How frequently is the data updated?
We continuously monitor industry developments and update our reports to reflect regulatory changes, technological advancements, and macroeconomic shifts. Updated editions ensure you receive the latest market intelligence.

 Aerospace And Defence
 Agriculture
 Automotive And Transportation
 Banking And Finance
 Business
 Chemicals And Materials
 Consumer And Retail
 Electronics And Semiconductors
 Food And Beverages
 Machinery & Equipments
 Manufacturing And Construction
 Medical Devices
 Others
 Pharmaceuticals And Healthcare
 Power And Energy
 Sports
 Technology

, Grid Type(Grid-Connected Microgrids, Remote/Islanded Microgrids), End-User(Government, Commercial and Industrial, Healthcare, Educational Institutes, Military, Utility), Power Source(Renewable Energy, Combined Heat and Power (CHP), Diesel Generators), Region and Key Players - Industry Segment Overview, Market Dynamics, Competitive Strategies, Trends and Forecast 2025-2034")
, Grid Type(Grid-Connected Microgrids, Remote/Islanded Microgrids), End-User(Government, Commercial and Industrial, Healthcare, Educational Institutes, Military, Utility), Power Source(Renewable Energy, Combined Heat and Power (CHP), Diesel Generators), Region and Key Players - Industry Segment Overview, Market Dynamics, Competitive Strategies, Trends and Forecast 2025-2034")
, Grid Type(Grid-Connected Microgrids, Remote/Islanded Microgrids), End-User(Government, Commercial and Industrial, Healthcare, Educational Institutes, Military, Utility), Power Source(Renewable Energy, Combined Heat and Power (CHP), Diesel Generators), Region and Key Players - Industry Segment Overview, Market Dynamics, Competitive Strategies, Trends and Forecast 2025-2034")
, Grid Type(Grid-Connected Microgrids, Remote/Islanded Microgrids), End-User(Government, Commercial and Industrial, Healthcare, Educational Institutes, Military, Utility), Power Source(Renewable Energy, Combined Heat and Power (CHP), Diesel Generators), Region and Key Players - Industry Segment Overview, Market Dynamics, Competitive Strategies, Trends and Forecast 2025-2034")
