Microparticulated Whey Protein Market 2024–2034 | Growth Outlook
Global Microparticulated Whey Protein Market Size, Share & Analysis By Type (Isolate, Concentrate, Hydrolysate), By Application (Bakery, Dairy, Sports Nutrition), By End-User Industry Outlook, Functional Ingredient Trends & Forecast 2025–2034
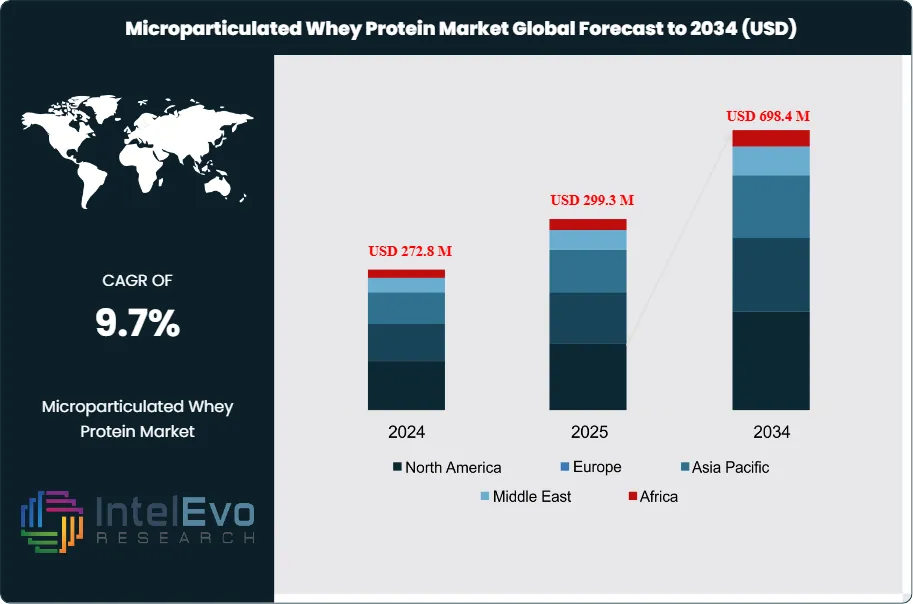
The Microparticulated Whey Protein market is valued at USD 272.8 million in 2024 and is projected to reach approximately USD 698.4 million by 2034, reflecting a strong CAGR of about 9.7% during 2025–2034. The surge in high-protein functional foods, clean-label formulations, and reduced-fat dairy innovations is accelerating global demand. Food manufacturers are increasingly adopting microparticulated whey as a superior fat replacer to improve texture, creaminess, and nutritional value without compromising taste. With sports nutrition, meal replacements, and ready-to-drink beverages gaining mass-market traction, this protein ingredient is emerging as a cornerstone of next-generation nutrition solutions.
This expansion reflects a steady shift in global nutritional priorities, as consumers increasingly favor high-protein, low-fat, and functional food products. Microparticulated Whey Protein (MWP), produced through controlled thermal and mechanical treatment of standard whey, delivers enhanced solubility, improved texture, and superior digestibility, making it well suited for modern nutrition-focused formulations.
MWP has become a preferred ingredient across sports nutrition, dietary supplements, and high-protein dairy products due to its ability to replicate fat-like mouthfeel while maintaining low caloric density. Current production processes typically involve heating whey to approximately 90°C and applying pressures of up to 140 bar, resulting in uniform microparticles that perform consistently across a wide range of food matrices.
Demand growth has been particularly strong in North America and Western Europe, where protein-fortified foods have transitioned from niche offerings to mainstream consumption. In the United States, protein supplement sales surpassed USD 9 billion in 2024, with MWP gaining market share due to its clean-label positioning and compatibility with reduced-calorie formulations.
Advancements in formulation technology now allow manufacturers to incorporate up to 15% protein in 2 kcal/ml solutions, enabling innovation in ready-to-drink beverages, medical nutrition, and clinical nutrition products. These capabilities are expanding application potential beyond traditional sports nutrition into therapeutic and lifestyle-oriented segments.
The Asia-Pacific region is emerging as a key growth engine, supported by urbanization, rising disposable incomes, and rapidly expanding fitness cultures. Sports nutrition sales in markets such as India and Vietnam recorded a 34% year-over-year increase, signaling accelerating adoption of protein-enriched products across developing economies.
Despite strong demand, supply-side constraints persist. Limited raw whey availability and energy-intensive processing have contributed to a 6.2% increase in input costs between 2022 and 2024. Additionally, heightened regulatory scrutiny surrounding protein claims and labeling requirements in regions such as the European Union and Australia necessitates careful compliance management.
In response, manufacturers are investing in precision processing technologies and clean energy integration to stabilize operating margins and improve production efficiency. These initiatives are helping offset cost pressures while supporting sustainability objectives.
Strategically, product development efforts are shifting toward novel applications, including bakery, snacks, and hybrid plant-protein blends that enhance nutritional value without compromising taste or mouthfeel. Capital inflows are increasingly targeting mid-scale processors capable of agile formulation, rapid innovation, and faster market deployment.
As the market matures, competitive differentiation will extend beyond protein concentration to include digestibility, sourcing transparency, and sustainability credentials. These factors are reinforcing the long-term value proposition of Microparticulated Whey Protein within an increasingly competitive global protein economy.
Key Takeaways
Market Growth: The global Microparticulated Whey Protein market reached USD 272.8 million in 2024 and is projected to grow at a CAGR of 9.7%, hitting USD 698.4 million by 2034. Growth is driven by rising demand for protein-enriched, low-fat, and clean-label formulations across food and beverage sectors.
Product Type: Microparticulated whey protein isolate leads with a 46.4% revenue share, driven by its high protein purity and compatibility with functional food and clinical nutrition applications.
Form: Powder form accounts for 74.3% of total market volume, offering manufacturers flexibility in blending, storage, and transportation for large-scale formulation needs.
Grade: Food-grade variants represent 68.5% of global demand, reflecting regulatory alignment and safety compliance for use in mainstream food and beverage products.
Application: Ready-to-drink beverages hold 29.9% of the market, supported by increased consumer preference for convenient, high-protein products, particularly among fitness-focused demographics.
Driver: Clean-label trends and protein fortification demand are accelerating adoption. In 2024, 67% of new product launches in functional beverages included whey-based proteins, with MWP preferred for its solubility and neutral taste.
Restraint: High production costs tied to energy-intensive processing and raw material volatility have led to a 6.2% increase in average input costs between 2022 and 2024, limiting margins for small and mid-sized manufacturers.
Opportunity: Asia-Pacific presents high growth potential, with India and Vietnam seeing over 30% annual growth in sports nutrition sales. Local demand for protein supplements is outpacing supply, creating space for regional manufacturing investments.
Trend: Manufacturers are integrating MWP into non-traditional categories such as bakery and plant-protein blends. Formulations now include up to 15% MWP in 2 kcal/ml products, enabling calorie control without sacrificing texture.
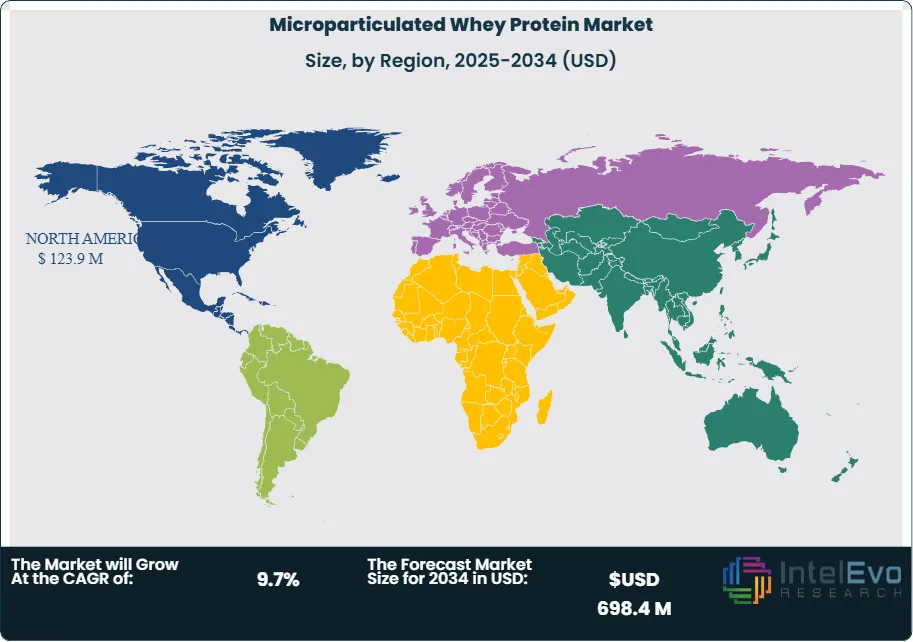
Regional Analysis: North America leads with a 45.4% market share, valued at USD 123.9 million in 2025. Growth in Asia-Pacific is accelerating, driven by expanding health awareness and urban dietary shifts, with a projected CAGR exceeding 9.4% through 2034.
Type Analysis
Microparticulated Whey Protein Isolate continues to lead the market by type, accounting for 46.4% of global revenue in 2025. Its dominance is attributed to a high protein-to-fat ratio, making it the preferred ingredient in sports nutrition, clinical nutrition, and high-performance functional foods. As consumer demand for lean protein sources increases, especially among athletes and health-focused demographics, Isolate remains central to product formulations aiming to deliver maximum nutritional benefit with minimal caloric load.
Concentrate holds a steady position in the market due to its affordability and sufficient protein levels for mainstream dietary applications. It remains widely used in standard protein powders, dairy blends, and everyday nutritional products. Hydrolysate, while representing a smaller segment, is gaining share at a faster rate. Its rapid absorption and improved digestibility make it well-suited for use in infant nutrition, post-exercise recovery formulas, and medical foods. However, higher production costs continue to limit broader adoption. From 2025 onward, manufacturers investing in hydrolysis technologies and cost-efficient production methods are likely to capitalize on rising interest in advanced protein solutions.
Form Analysis
In 2025, powder remains the dominant form in the Microparticulated Whey Protein market, capturing 74.3% of total demand. Its stability, long shelf life, and compatibility with dry blends make it the preferred format for protein bars, powdered beverages, and snack applications. Manufacturers benefit from easy handling, lower storage costs, and broader formulation flexibility. These advantages continue to drive high-volume use across food, supplement, and sports nutrition categories.
Liquid forms, while accounting for a smaller share, are growing steadily in line with rising demand for ready-to-drink (RTD) functional beverages. This segment is particularly active in sports drinks, medical nutrition, and performance beverages. As on-the-go consumption rises in urban centers, particularly in Asia and North America, liquid MWP solutions are expected to expand their market footprint. Their key advantage lies in offering immediate usability and smooth integration into beverages without reconstitution, which appeals to consumers seeking speed and convenience in nutritional intake.
Type Analysis
Food-grade Microparticulated Whey Protein represents the majority of consumption in 2025, holding 68.5% of the market. It is widely applied in protein-fortified dairy products, meal replacements, and clean-label snack categories. Its compliance with food safety regulations and performance across diverse applications have made it the default standard in mainstream food and beverage manufacturing.
Pharma-grade MWP, although smaller in market share, is experiencing increasing demand in medical nutrition, therapeutic formulations, and targeted supplements for aging populations. Its use is expanding in products tailored for digestion-sensitive consumers and patients requiring high bioavailability of essential amino acids. The aging global population and rising incidence of chronic illness are fueling this demand. In Europe and Japan, where geriatric nutritional needs are a policy priority, pharma-grade formats are being incorporated into clinical dietary interventions at a growing rate.
Application Analysis
Ready-to-drink (RTD) beverages account for 29.9% of application-based demand in 2025, the largest among all categories. The segment benefits from strong consumer interest in high-protein, portable nutrition. MWP’s ability to remain stable in liquid form without affecting mouthfeel or flavor is a critical advantage in RTD sports drinks, shakes, and clinical nutrition products.
Dairy products remain a key use case, particularly in yogurt, protein-enriched milk, and high-protein cheese. MWP improves texture and nutritional value while supporting high-protein claims. Nutritional products, including powders, bars, and fortified foods, are also a major area of growth. In 2025, product launches featuring MWP in the nutritional segment increased by over 18%, particularly in North America and Europe.
Pharmaceutical applications, though niche, are increasing steadily. MWP is incorporated into liquid nutrition products for patients with limited digestion capacity, while cosmetics use it in formulations for its bioactive peptides. Although smaller in volume, these segments represent high-margin opportunities and are expected to grow in double digits through 2030.
Region Analysis
North America leads the global market in 2025, accounting for 45.4% of revenue and valued at USD 123.9 million. This dominance is supported by a mature supplement industry, high consumer awareness, and broad retail access to protein-enriched products. The U.S. continues to drive product innovation, particularly in clinical nutrition and RTD beverages featuring MWP.
Europe remains the second-largest market, with steady demand driven by aging demographics and clean-label regulations that favor high-quality protein ingredients. Germany, the UK, and the Nordics are key markets due to proactive health trends and rising functional food adoption.
Asia Pacific shows the highest growth potential, driven by urbanization, increased disposable income, and growing interest in sports and wellness products. Countries like China and India are seeing over 10% annual growth in protein supplement sales, with local brands beginning to formulate with MWP to meet rising demand.
Latin America and the Middle East & Africa remain smaller but developing markets. Gradual economic improvement and health awareness are creating opportunities for regional entry, particularly in urban centers like São Paulo, Riyadh, and Johannesburg. While regulatory complexity and pricing remain challenges, multinationals are beginning to target these regions with affordable, locally adapted MWP-based products.
Customization for segments, region/country-level will be provided. Moreover, additional customization can be done based on the requirements.
Pricing and Purchase Options
Avail customized purchase options to meet your exact research needs. We have three licenses to opt for: Single User License, Multi-User License (Up to 5 Users), Corporate Use License (Unlimited User and Printable PDF).
TABLE OF CONTENTS
1. EXECUTIVE SUMMARY
1.1. MARKET SNAPSHOT
1.2. KEY FINDINGS & INSIGHTS
1.3. ANALYST RECOMMENDATIONS
1.4. FUTURE OUTLOOK
2. RESEARCH METHODOLOGY
2.1. MARKET DEFINITION & SCOPE
2.2. RESEARCH OBJECTIVES: PRIMARY & SECONDARY DATA SOURCES
2.3. DATA COLLECTION SOURCES
2.3.1. COVERAGE OF 100+ PRIMARY RESEARCH/CONSULTATION CALLS WITH INDUSTRY STAKEHOLDERS
FIGURE 17 NORTH AMERICA MICROPARTICULATED WHEY PROTEIN CURRENT AND FUTURE TYPE ANALYSIS, 2025–2034, (USD MILLION)
FIGURE 18 NORTH AMERICA MICROPARTICULATED WHEY PROTEIN CURRENT AND FUTURE END USER ANALYSIS, 2025–2034, (USD MILLION)
FIGURE 19 MARKET SHARE BY COUNTRY
FIGURE 20 LATIN AMERICA MICROPARTICULATED WHEY PROTEIN CURRENT AND FUTURE TYPE ANALYSIS, 2025–2034, (USD MILLION)
FIGURE 21 LATIN AMERICA MICROPARTICULATED WHEY PROTEIN CURRENT AND FUTURE END USER ANALYSIS, 2025–2034, (USD MILLION)
FIGURE 22 MARKET SHARE BY COUNTRY
FIGURE 23 EASTERN EUROPE MICROPARTICULATED WHEY PROTEIN CURRENT AND FUTURE TYPE ANALYSIS, 2025–2034, (USD MILLION)
FIGURE 24 EASTERN EUROPE MICROPARTICULATED WHEY PROTEIN CURRENT AND FUTURE END USER ANALYSIS, 2025–2034, (USD MILLION)
FIGURE 25 MARKET SHARE BY COUNTRY
FIGURE 26 WESTERN EUROPE MICROPARTICULATED WHEY PROTEIN CURRENT AND FUTURE TYPE ANALYSIS, 2025–2034, (USD MILLION)
FIGURE 27 WESTERN EUROPE MICROPARTICULATED WHEY PROTEIN CURRENT AND FUTURE END USER ANALYSIS, 2025–2034, (USD MILLION)
FIGURE 28 MARKET SHARE BY COUNTRY
FIGURE 29 EAST ASIA AND PACIFIC MICROPARTICULATED WHEY PROTEIN CURRENT AND FUTURE TYPE ANALYSIS, 2025–2034, (USD MILLION)
FIGURE 30 EAST ASIA AND PACIFIC MICROPARTICULATED WHEY PROTEIN CURRENT AND FUTURE END USER ANALYSIS, 2025–2034, (USD MILLION)
FIGURE 31 MARKET SHARE BY COUNTRY
FIGURE 32 SEA AND SOUTH ASIA MICROPARTICULATED WHEY PROTEIN CURRENT AND FUTURE TYPE ANALYSIS, 2025–2034, (USD MILLION)
FIGURE 33 SEA AND SOUTH ASIA MICROPARTICULATED WHEY PROTEIN CURRENT AND FUTURE END USER ANALYSIS, 2025–2034, (USD MILLION)
FIGURE 34 MARKET SHARE BY COUNTRY
FIGURE 35 MIDDLE EAST AND AFRICA MICROPARTICULATED WHEY PROTEIN CURRENT AND FUTURE TYPE ANALYSIS, 2025–2034, (USD MILLION)
FIGURE 36 MIDDLE EAST AND AFRICA MICROPARTICULATED WHEY PROTEIN CURRENT AND FUTURE END USER ANALYSIS, 2025–2034, (USD MILLION)
FIGURE 37 NORTH AMERICA MICROPARTICULATED WHEY PROTEIN CURRENT AND FUTURE MARKET VOLUME SHARE REGIONAL ANALYSIS, 2025–2034, (USD MILLION)
FIGURE 38 U.S. MICROPARTICULATED WHEY PROTEIN CURRENT AND FUTURE TYPE ANALYSIS, 2025–2034, (USD MILLION)
FIGURE 39 U.S. MICROPARTICULATED WHEY PROTEIN CURRENT AND FUTURE END USER ANALYSIS, 2025–2034, (USD MILLION)
FIGURE 40 CANADA MICROPARTICULATED WHEY PROTEIN CURRENT AND FUTURE TYPE ANALYSIS, 2025–2034, (USD MILLION)
FIGURE 41 CANADA MICROPARTICULATED WHEY PROTEIN CURRENT AND FUTURE END USER ANALYSIS, 2025–2034, (USD MILLION)
FIGURE 42 LATIN AMERICA MICROPARTICULATED WHEY PROTEIN CURRENT AND FUTURE MARKET VOLUME SHARE REGIONAL ANALYSIS, 2025–2034, (USD MILLION)
FIGURE 43 MEXICO MICROPARTICULATED WHEY PROTEIN CURRENT AND FUTURE TYPE ANALYSIS, 2025–2034, (USD MILLION)
FIGURE 44 MEXICO MICROPARTICULATED WHEY PROTEIN CURRENT AND FUTURE END USER ANALYSIS, 2025–2034, (USD MILLION)
FIGURE 45 BRAZIL MICROPARTICULATED WHEY PROTEIN CURRENT AND FUTURE TYPE ANALYSIS, 2025–2034, (USD MILLION)
FIGURE 46 BRAZIL MICROPARTICULATED WHEY PROTEIN CURRENT AND FUTURE END USER ANALYSIS, 2025–2034, (USD MILLION)
FIGURE 47 ARGENTINA MICROPARTICULATED WHEY PROTEIN CURRENT AND FUTURE TYPE ANALYSIS, 2025–2034, (USD MILLION)
FIGURE 48 ARGENTINA MICROPARTICULATED WHEY PROTEIN CURRENT AND FUTURE END USER ANALYSIS, 2025–2034, (USD MILLION)
FIGURE 49 COLUMBIA MICROPARTICULATED WHEY PROTEIN CURRENT AND FUTURE TYPE ANALYSIS, 2025–2034, (USD MILLION)
FIGURE 50 COLUMBIA MICROPARTICULATED WHEY PROTEIN CURRENT AND FUTURE END USER ANALYSIS, 2025–2034, (USD MILLION)
FIGURE 51 REST OF LATIN AMERICA MICROPARTICULATED WHEY PROTEIN CURRENT AND FUTURE TYPE ANALYSIS, 2025–2034, (USD MILLION)
FIGURE 52 REST OF LATIN AMERICA MICROPARTICULATED WHEY PROTEIN CURRENT AND FUTURE END USER ANALYSIS, 2025–2034, (USD MILLION)
FIGURE 53 EASTERN EUROPE MICROPARTICULATED WHEY PROTEIN CURRENT AND FUTURE MARKET VOLUME SHARE REGIONAL ANALYSIS, 2025–2034, (USD MILLION)
FIGURE 54 POLAND MICROPARTICULATED WHEY PROTEIN CURRENT AND FUTURE TYPE ANALYSIS, 2025–2034, (USD MILLION)
FIGURE 55 POLAND MICROPARTICULATED WHEY PROTEIN CURRENT AND FUTURE END USER ANALYSIS, 2025–2034, (USD MILLION)
FIGURE 56 RUSSIA MICROPARTICULATED WHEY PROTEIN CURRENT AND FUTURE TYPE ANALYSIS, 2025–2034, (USD MILLION)
FIGURE 57 RUSSIA MICROPARTICULATED WHEY PROTEIN CURRENT AND FUTURE END USER ANALYSIS, 2025–2034, (USD MILLION)
FIGURE 58 CZECH REPUBLIC MICROPARTICULATED WHEY PROTEIN CURRENT AND FUTURE TYPE ANALYSIS, 2025–2034, (USD MILLION)
FIGURE 59 CZECH REPUBLIC MICROPARTICULATED WHEY PROTEIN CURRENT AND FUTURE END USER ANALYSIS, 2025–2034, (USD MILLION)
FIGURE 60 ROMANIA MICROPARTICULATED WHEY PROTEIN CURRENT AND FUTURE TYPE ANALYSIS, 2025–2034, (USD MILLION)
FIGURE 61 ROMANIA MICROPARTICULATED WHEY PROTEIN CURRENT AND FUTURE END USER ANALYSIS, 2025–2034, (USD MILLION)
FIGURE 62 REST OF EASTERN EUROPE MICROPARTICULATED WHEY PROTEIN CURRENT AND FUTURE TYPE ANALYSIS, 2025–2034, (USD MILLION)
FIGURE 63 REST OF EASTERN EUROPE MICROPARTICULATED WHEY PROTEIN CURRENT AND FUTURE END USER ANALYSIS, 2025–2034, (USD MILLION)
FIGURE 64 WESTERN EUROPE MICROPARTICULATED WHEY PROTEIN CURRENT AND FUTURE MARKET VOLUME SHARE REGIONAL ANALYSIS, 2025–2034, (USD MILLION)
FIGURE 65 GERMANY MICROPARTICULATED WHEY PROTEIN CURRENT AND FUTURE TYPE ANALYSIS, 2025–2034, (USD MILLION)
FIGURE 66 GERMANY MICROPARTICULATED WHEY PROTEIN CURRENT AND FUTURE END USER ANALYSIS, 2025–2034, (USD MILLION)
FIGURE 67 FRANCE MICROPARTICULATED WHEY PROTEIN CURRENT AND FUTURE TYPE ANALYSIS, 2025–2034, (USD MILLION)
FIGURE 68 FRANCE MICROPARTICULATED WHEY PROTEIN CURRENT AND FUTURE END USER ANALYSIS, 2025–2034, (USD MILLION)
FIGURE 69 UK MICROPARTICULATED WHEY PROTEIN CURRENT AND FUTURE TYPE ANALYSIS, 2025–2034, (USD MILLION)
FIGURE 70 UK MICROPARTICULATED WHEY PROTEIN CURRENT AND FUTURE END USER ANALYSIS, 2025–2034, (USD MILLION)
FIGURE 71 SPAIN MICROPARTICULATED WHEY PROTEIN CURRENT AND FUTURE TYPE ANALYSIS, 2025–2034, (USD MILLION)
FIGURE 72 SPAIN MICROPARTICULATED WHEY PROTEIN CURRENT AND FUTURE END USER ANALYSIS, 2025–2034, (USD MILLION)
FIGURE 73 ITALY MICROPARTICULATED WHEY PROTEIN CURRENT AND FUTURE TYPE ANALYSIS, 2025–2034, (USD MILLION)
FIGURE 74 ITALY MICROPARTICULATED WHEY PROTEIN CURRENT AND FUTURE END USER ANALYSIS, 2025–2034, (USD MILLION)
FIGURE 75 REST OF WESTERN EUROPE MICROPARTICULATED WHEY PROTEIN CURRENT AND FUTURE TYPE ANALYSIS, 2025–2034, (USD MILLION)
FIGURE 76 REST OF WESTERN EUROPE MICROPARTICULATED WHEY PROTEIN CURRENT AND FUTURE END USER ANALYSIS, 2025–2034, (USD MILLION)
FIGURE 77 EAST ASIA AND PACIFIC MICROPARTICULATED WHEY PROTEIN CURRENT AND FUTURE MARKET VOLUME SHARE REGIONAL ANALYSIS, 2025–2034, (USD MILLION)
FIGURE 78 CHINA MICROPARTICULATED WHEY PROTEIN CURRENT AND FUTURE TYPE ANALYSIS, 2025–2034, (USD MILLION)
FIGURE 79 CHINA MICROPARTICULATED WHEY PROTEIN CURRENT AND FUTURE END USER ANALYSIS, 2025–2034, (USD MILLION)
FIGURE 80 JAPAN MICROPARTICULATED WHEY PROTEIN CURRENT AND FUTURE TYPE ANALYSIS, 2025–2034, (USD MILLION)
FIGURE 81 JAPAN MICROPARTICULATED WHEY PROTEIN CURRENT AND FUTURE END USER ANALYSIS, 2025–2034, (USD MILLION)
FIGURE 82 AUSTRALIA MICROPARTICULATED WHEY PROTEIN CURRENT AND FUTURE TYPE ANALYSIS, 2025–2034, (USD MILLION)
FIGURE 83 AUSTRALIA MICROPARTICULATED WHEY PROTEIN CURRENT AND FUTURE END USER ANALYSIS, 2025–2034, (USD MILLION)
FIGURE 84 CAMBODIA MICROPARTICULATED WHEY PROTEIN CURRENT AND FUTURE TYPE ANALYSIS, 2025–2034, (USD MILLION)
FIGURE 85 CAMBODIA MICROPARTICULATED WHEY PROTEIN CURRENT AND FUTURE END USER ANALYSIS, 2025–2034, (USD MILLION)
FIGURE 86 FIJI MICROPARTICULATED WHEY PROTEIN CURRENT AND FUTURE TYPE ANALYSIS, 2025–2034, (USD MILLION)
FIGURE 87 FIJI MICROPARTICULATED WHEY PROTEIN CURRENT AND FUTURE END USER ANALYSIS, 2025–2034, (USD MILLION)
FIGURE 88 INDONESIA MICROPARTICULATED WHEY PROTEIN CURRENT AND FUTURE TYPE ANALYSIS, 2025–2034, (USD MILLION)
FIGURE 89 INDONESIA MICROPARTICULATED WHEY PROTEIN CURRENT AND FUTURE END USER ANALYSIS, 2025–2034, (USD MILLION)
FIGURE 90 SOUTH KOREA MICROPARTICULATED WHEY PROTEIN CURRENT AND FUTURE TYPE ANALYSIS, 2025–2034, (USD MILLION)
FIGURE 91 SOUTH KOREA MICROPARTICULATED WHEY PROTEIN CURRENT AND FUTURE END USER ANALYSIS, 2025–2034, (USD MILLION)
FIGURE 92 REST OF EAST ASIA AND PACIFIC MICROPARTICULATED WHEY PROTEIN CURRENT AND FUTURE TYPE ANALYSIS, 2025–2034, (USD MILLION)
FIGURE 93 REST OF EAST ASIA AND PACIFIC MICROPARTICULATED WHEY PROTEIN CURRENT AND FUTURE END USER ANALYSIS, 2025–2034, (USD MILLION)
FIGURE 94 SEA AND SOUTH ASIA MICROPARTICULATED WHEY PROTEIN CURRENT AND FUTURE MARKET VOLUME SHARE REGIONAL ANALYSIS, 2025–2034, (USD MILLION)
FIGURE 95 BANGLADESH MICROPARTICULATED WHEY PROTEIN CURRENT AND FUTURE TYPE ANALYSIS, 2025–2034, (USD MILLION)
FIGURE 96 BANGLADESH MICROPARTICULATED WHEY PROTEIN CURRENT AND FUTURE END USER ANALYSIS, 2025–2034, (USD MILLION)
FIGURE 97 NEW ZEALAND MICROPARTICULATED WHEY PROTEIN CURRENT AND FUTURE TYPE ANALYSIS, 2025–2034, (USD MILLION)
FIGURE 98 NEW ZEALAND MICROPARTICULATED WHEY PROTEIN CURRENT AND FUTURE END USER ANALYSIS, 2025–2034, (USD MILLION)
FIGURE 99 INDIA MICROPARTICULATED WHEY PROTEIN CURRENT AND FUTURE TYPE ANALYSIS, 2025–2034, (USD MILLION)
FIGURE 100 INDIA MICROPARTICULATED WHEY PROTEIN CURRENT AND FUTURE END USER ANALYSIS, 2025–2034, (USD MILLION)
FIGURE 101 SINGAPORE MICROPARTICULATED WHEY PROTEIN CURRENT AND FUTURE TYPE ANALYSIS, 2025–2034, (USD MILLION)
FIGURE 102 SINGAPORE MICROPARTICULATED WHEY PROTEIN CURRENT AND FUTURE END USER ANALYSIS, 2025–2034, (USD MILLION)
FIGURE 103 THAILAND MICROPARTICULATED WHEY PROTEIN CURRENT AND FUTURE TYPE ANALYSIS, 2025–2034, (USD MILLION)
FIGURE 104 THAILAND MICROPARTICULATED WHEY PROTEIN CURRENT AND FUTURE END USER ANALYSIS, 2025–2034, (USD MILLION)
FIGURE 105 TAIWAN MICROPARTICULATED WHEY PROTEIN CURRENT AND FUTURE TYPE ANALYSIS, 2025–2034, (USD MILLION)
FIGURE 106 TAIWAN MICROPARTICULATED WHEY PROTEIN CURRENT AND FUTURE END USER ANALYSIS, 2025–2034, (USD MILLION)
FIGURE 107 MALAYSIA MICROPARTICULATED WHEY PROTEIN CURRENT AND FUTURE TYPE ANALYSIS, 2025–2034, (USD MILLION)
FIGURE 108 MALAYSIA MICROPARTICULATED WHEY PROTEIN CURRENT AND FUTURE END USER ANALYSIS, 2025–2034, (USD MILLION)
FIGURE 109 REST OF SEA AND SOUTH ASIA MICROPARTICULATED WHEY PROTEIN CURRENT AND FUTURE TYPE ANALYSIS, 2025–2034, (USD MILLION)
FIGURE 110 REST OF SEA AND SOUTH ASIA MICROPARTICULATED WHEY PROTEIN CURRENT AND FUTURE END USER ANALYSIS, 2025–2034, (USD MILLION)
FIGURE 111 MIDDLE EAST AND AFRICA MICROPARTICULATED WHEY PROTEIN CURRENT AND FUTURE MARKET VOLUME SHARE REGIONAL ANALYSIS, 2025–2034, (USD MILLION)
FIGURE 112 GCC COUNTRIES MICROPARTICULATED WHEY PROTEIN CURRENT AND FUTURE TYPE ANALYSIS, 2025–2034, (USD MILLION)
FIGURE 113 GCC COUNTRIES MICROPARTICULATED WHEY PROTEIN CURRENT AND FUTURE END USER ANALYSIS, 2025–2034, (USD MILLION)
FIGURE 114 SAUDI ARABIA MICROPARTICULATED WHEY PROTEIN CURRENT AND FUTURE TYPE ANALYSIS, 2025–2034, (USD MILLION)
FIGURE 115 SAUDI ARABIA MICROPARTICULATED WHEY PROTEIN CURRENT AND FUTURE END USER ANALYSIS, 2025–2034, (USD MILLION)
FIGURE 116 UAE MICROPARTICULATED WHEY PROTEIN CURRENT AND FUTURE TYPE ANALYSIS, 2025–2034, (USD MILLION)
FIGURE 117 UAE MICROPARTICULATED WHEY PROTEIN CURRENT AND FUTURE END USER ANALYSIS, 2025–2034, (USD MILLION)
FIGURE 118 BAHRAIN MICROPARTICULATED WHEY PROTEIN CURRENT AND FUTURE TYPE ANALYSIS, 2025–2034, (USD MILLION)
FIGURE 119 BAHRAIN MICROPARTICULATED WHEY PROTEIN CURRENT AND FUTURE END USER ANALYSIS, 2025–2034, (USD MILLION)
FIGURE 120 KUWAIT MICROPARTICULATED WHEY PROTEIN CURRENT AND FUTURE TYPE ANALYSIS, 2025–2034, (USD MILLION)
FIGURE 121 KUWAIT MICROPARTICULATED WHEY PROTEIN CURRENT AND FUTURE END USER ANALYSIS, 2025–2034, (USD MILLION)
FIGURE 122 OMAN MICROPARTICULATED WHEY PROTEIN CURRENT AND FUTURE TYPE ANALYSIS, 2025–2034, (USD MILLION)
FIGURE 123 OMAN MICROPARTICULATED WHEY PROTEIN CURRENT AND FUTURE END USER ANALYSIS, 2025–2034, (USD MILLION)
FIGURE 124 QATAR MICROPARTICULATED WHEY PROTEIN CURRENT AND FUTURE TYPE ANALYSIS, 2025–2034, (USD MILLION)
FIGURE 125 QATAR MICROPARTICULATED WHEY PROTEIN CURRENT AND FUTURE END USER ANALYSIS, 2025–2034, (USD MILLION)
FIGURE 126 EGYPT MICROPARTICULATED WHEY PROTEIN CURRENT AND FUTURE TYPE ANALYSIS, 2025–2034, (USD MILLION)
FIGURE 127 EGYPT MICROPARTICULATED WHEY PROTEIN CURRENT AND FUTURE END USER ANALYSIS, 2025–2034, (USD MILLION)
FIGURE 128 NIGERIA MICROPARTICULATED WHEY PROTEIN CURRENT AND FUTURE TYPE ANALYSIS, 2025–2034, (USD MILLION)
FIGURE 129 NIGERIA MICROPARTICULATED WHEY PROTEIN CURRENT AND FUTURE END USER ANALYSIS, 2025–2034, (USD MILLION)
FIGURE 130 SOUTH AFRICA MICROPARTICULATED WHEY PROTEIN CURRENT AND FUTURE TYPE ANALYSIS, 2025–2034, (USD MILLION)
FIGURE 131 SOUTH AFRICA MICROPARTICULATED WHEY PROTEIN CURRENT AND FUTURE END USER ANALYSIS, 2025–2034, (USD MILLION)
FIGURE 132 ISRAEL MICROPARTICULATED WHEY PROTEIN CURRENT AND FUTURE TYPE ANALYSIS, 2025–2034, (USD MILLION)
FIGURE 133 ISRAEL MICROPARTICULATED WHEY PROTEIN CURRENT AND FUTURE END USER ANALYSIS, 2025–2034, (USD MILLION)
FIGURE 134 REST OF MEA MICROPARTICULATED WHEY PROTEIN CURRENT AND FUTURE TYPE ANALYSIS, 2025–2034, (USD MILLION)
FIGURE 135 REST OF MEA MICROPARTICULATED WHEY PROTEIN CURRENT AND FUTURE END USER ANALYSIS, 2025–2034, (USD MILLION)
FIGURE 136 U. S. MARKET SHARE ANALYSIS BY TYPE (2024)
FIGURE 137 U. S. MARKET SHARE ANALYSIS BY END USER (2024)
FIGURE 138 CANADA MARKET SHARE ANALYSIS BY TYPE (2024)
FIGURE 139 CANADA MARKET SHARE ANALYSIS BY END USER (2024)
FIGURE 140 MEXICO MARKET SHARE ANALYSIS BY TYPE (2024)
FIGURE 141 MEXICO MARKET SHARE ANALYSIS BY END USER (2024)
FIGURE 142 CHINA MARKET SHARE ANALYSIS BY TYPE (2024)
FIGURE 143 CHINA MARKET SHARE ANALYSIS BY END USER (2024)
FIGURE 144 JAPAN MARKET SHARE ANALYSIS BY TYPE (2024)
FIGURE 145 JAPAN MARKET SHARE ANALYSIS BY END USER (2024)
FIGURE 146 INDIA MARKET SHARE ANALYSIS BY TYPE (2024)
FIGURE 147 INDIA MARKET SHARE ANALYSIS BY END USER (2024)
FIGURE 148 SOUTH KOREA MARKET SHARE ANALYSIS BY TYPE (2024)
FIGURE 149 SOUTH KOREA MARKET SHARE ANALYSIS BY END USER (2024)
FIGURE 150 SAUDI ARABIA MARKET SHARE ANALYSIS BY TYPE (2024)
FIGURE 151 SAUDI ARABIA MARKET SHARE ANALYSIS BY END USER (2024)
FIGURE 152 UAE MARKET SHARE ANALYSIS BY TYPE (2024)
FIGURE 153 UAE MARKET SHARE ANALYSIS BY END USER (2024)
FIGURE 154 EGYPT MARKET SHARE ANALYSIS BY TYPE (2024)
FIGURE 155 EGYPT MARKET SHARE ANALYSIS BY END USER (2024)
FIGURE 156 NIGERIA MARKET SHARE ANALYSIS BY TYPE (2024)
FIGURE 157 NIGERIA MARKET SHARE ANALYSIS BY END USER (2024)
FIGURE 158 SOUTH AFRICA MARKET SHARE ANALYSIS BY TYPE (2024)
FIGURE 159 SOUTH AFRICA MARKET SHARE ANALYSIS BY END USER (2024)
FIGURE 160 GERMANY MARKET SHARE ANALYSIS BY TYPE (2024)
FIGURE 161 GERMANY MARKET SHARE ANALYSIS BY END USER (2024)
FIGURE 162 FRANCE MARKET SHARE ANALYSIS BY TYPE (2024)
FIGURE 163 FRANCE MARKET SHARE ANALYSIS BY END USER (2024)
FIGURE 164 UK MARKET SHARE ANALYSIS BY TYPE (2024)
FIGURE 165 UK MARKET SHARE ANALYSIS BY END USER (2024)
FIGURE 166 SPAIN MARKET SHARE ANALYSIS BY TYPE (2024)
FIGURE 167 SPAIN MARKET SHARE ANALYSIS BY END USER (2024)
FIGURE 168 ITALY MARKET SHARE ANALYSIS BY TYPE (2024)
FIGURE 169 ITALY MARKET SHARE ANALYSIS BY END USER (2024)
FIGURE 170 BRAZIL MARKET SHARE ANALYSIS BY TYPE (2024)
FIGURE 171 BRAZIL MARKET SHARE ANALYSIS BY END USER (2024)
FIGURE 172 ARGENTINA MARKET SHARE ANALYSIS BY TYPE (2024)
FIGURE 173 ARGENTINA MARKET SHARE ANALYSIS BY END USER (2024)
FIGURE 174 COLUMBIA MARKET SHARE ANALYSIS BY TYPE (2024)
FIGURE 175 COLUMBIA MARKET SHARE ANALYSIS BY END USER (2024)
FIGURE 176 GLOBAL MICROPARTICULATED WHEY PROTEIN CURRENT AND FUTURE MARKET KEY COUNTRY LEVEL ANALYSIS, 2024–2034, (USD MILLION)
FIGURE 177 FINANCIAL OVERVIEW:
Key Player Analysis
Arla Foods Ingredients: Arla Foods Ingredients remains a market leader in the microparticulated whey protein segment, leveraging its vertically integrated supply chain and established presence in functional dairy ingredients. The company’s Lacprodan® range, which includes MWP tailored for medical nutrition, RTD beverages, and sports applications, continues to expand its footprint across Europe, North America, and Asia. In 2025, Arla’s functional protein division reported a 9.1% year-over-year revenue increase, with MWP contributing significantly to growth in the clinical nutrition and healthy aging sectors.
Strategically, Arla has invested in sustainability-driven manufacturing at its Denmark-based facility, reducing water usage per ton of protein output by 18% since 2022. It continues to prioritize R&D partnerships with regional dairy processors and nutrition labs to develop low-lactose, high-digestibility protein solutions. Its strong European regulatory alignment and traceable sourcing offer competitive differentiation, particularly in high-compliance markets such as Germany and the Nordic region.
Carbery: Carbery positions itself as an innovator in high-performance whey solutions, with a growing share in the microparticulated segment through its Optipep® and Carbelac® lines. While traditionally strong in hydrolyzed proteins, the company is expanding its reach into functional beverage and convenience food applications using microparticulated variants. In 2025, Carbery reported a 6.4% CAGR across its whey protein segment, with targeted growth in Asia-Pacific markets.
The company’s recent capital investment in advanced filtration and particle reduction technologies has improved solubility and sensory quality, addressing long-standing challenges in RTD formulation. Carbery maintains a strong B2B focus, partnering with co-manufacturers and private label brands to deliver customized whey-based ingredients. Its Ireland-based operations provide an EU-compliant manufacturing hub with strong access to export markets across Asia and the Middle East.
CP Kelco: CP Kelco operates as a niche player in the microparticulated whey protein market but holds strategic value through its expertise in texture and functional ingredient systems. The company integrates MWP into broader formulation platforms that include hydrocolloids and stabilizers, giving it a differentiated position in texture-sensitive applications such as high-protein yogurts and RTD beverages. CP Kelco's strength lies in formulation co-development, often working directly with global F&B majors to support product stability and mouthfeel.
In 2025, the company expanded its technical application labs in Singapore and São Paulo to service APAC and LATAM markets, supporting localized product adaptation. Though not a volume leader in MWP, CP Kelco’s integration capabilities make it a preferred partner for manufacturers needing turnkey formulation solutions. Its value proposition is rooted in cross-functional expertise rather than commodity protein sales.
Fonterra Future Dairy Private Limited: Fonterra Future Dairy positions itself as a challenger in the microparticulated whey protein space, leveraging its strong dairy heritage and expanding presence in South and Southeast Asia. A joint venture between Fonterra and Future Group, the company focuses on high-protein consumer products tailored to Indian market dynamics. In 2025, Fonterra’s South Asia division recorded 11.3% growth in protein ingredient sales, with MWP applications in fortified dairy beverages driving volume.
Fonterra has invested in local processing capabilities to improve cost-efficiency and reduce lead times in India and Indonesia. Its localized sourcing and distribution model offers an advantage in price-sensitive markets. The company is also exploring hybrid formulations that combine dairy and plant proteins, aiming to meet regional dietary trends. With strong retail partnerships and government-aligned nutrition initiatives, Fonterra Future Dairy is positioned to scale rapidly in emerging markets where awareness of functional proteins is on the rise.
Market Key Players
MILEI GmbH
Sure Protein WPC550 (NZMP)
Carbery
Leprino Foods
Nutra Solutions
Fonterra Future Dairy Private Limited
Sooro Renner
The Good Scents Company
CP Kelco
FrieslandCampina Ingredients
Arla Foods Ingredients
Makers Nutrition, LLC
NMZP
Driver:
Rising Demand for High-Protein Functional Foods
In 2025, the global demand for functional, high-protein foods continues to rise, driven by lifestyle changes and growing awareness around nutrition. Consumers are prioritizing protein intake for muscle maintenance, metabolic health, and satiety. Microparticulated Whey Protein (MWP), with its superior digestibility and clean-label profile, is increasingly used in product lines targeting active consumers and wellness-focused segments. Its solubility and neutral flavor make it ideal for ready-to-drink beverages, clinical nutrition, and protein-fortified snacks. With 67% of new launches in the sports nutrition category featuring whey-based ingredients in the past year, MWP is playing a critical role in premium product positioning across global markets.
Mainstream Adoption of MWP for Diet and Product Differentiation
As protein becomes a core element of mainstream diets—not just for athletes—MWP is gaining traction in both retail and institutional channels. This demand shift supports product differentiation in saturated categories and drives higher margins for manufacturers. The ingredient’s ability to meet multiple dietary needs, including lactose-reduced and low-fat formulations, positions it as a strategic asset in long-term portfolio development.
Restraint:
High Production Costs Limiting Price Competitiveness
Despite rising demand, the high production cost of microparticulated whey protein remains a barrier to broader adoption. The process requires specific thermal and mechanical conditions—often 90°C and 140 bar pressure—which drive up energy use and operational costs. These inputs raise average production expenses by 10–15% compared to conventional whey protein concentrates. For price-sensitive markets and lower-margin categories like protein bars or mass-market beverages, this makes MWP less competitive against alternatives such as soy, rice, or pea protein.
Low Awareness in Emerging Markets and Regulatory Complexity
In addition, inconsistent consumer awareness in emerging regions limits uptake. While urban consumers in North America and Western Europe are familiar with the nutritional benefits of MWP, awareness in Latin America, Southeast Asia, and parts of the Middle East remains limited. Without clear labeling and consumer education, the perceived value of MWP is diluted, affecting its retail performance. Regulatory complexity across international markets—particularly for pharmaceutical or clinical uses—further adds to time-to-market and compliance costs.
Opportunity:
Expanding Use in Clinical Nutrition and Sports Recovery
MWP’s expanding use in clinical nutrition, sports recovery, and functional beverages presents a multi-billion-dollar opportunity. As of 2025, over 32% of global sports nutrition products include microparticulated proteins, driven by their high bioavailability and quick absorption. Emerging demand in medical nutrition—for example, post-operative recovery or elderly muscle maintenance—offers strong growth potential, particularly as aging populations drive demand for digestible, high-quality protein sources. The pharma-grade segment is expected to grow at a CAGR of over 9.5% through 2030.
Hybrid Protein Formulations Unlocking New Product Innovations
Additionally, manufacturers are finding growth in hybrid formulations that combine MWP with plant-based proteins. This strategy appeals to flexitarians and health-focused consumers looking for both performance and ingredient variety. The ability to incorporate MWP into high-protein smoothies, baked snacks, and shelf-stable beverages without altering flavor or mouthfeel allows companies to expand into new formats. This application flexibility, combined with consumer demand for multi-functional ingredients, offers a scalable entry point for new product development and private-label expansion.
Trend:
Clean-Label Movement Driving Adoption of MWP
The shift toward clean-label nutrition and functional ingredients is shaping product development across all segments. In 2025, 61% of protein-enhanced product launches now carry clean-label claims such as “no artificial additives” or “naturally processed.” Microparticulated whey protein fits this demand, offering manufacturers a functional ingredient that aligns with label transparency and dietary compliance.
Advances in Processing Technology Enhancing Product Performance
At the same time, processing technology for MWP has advanced significantly. New microfiltration and thermal control techniques have improved particle uniformity and reduced the grainy texture often cited as a drawback. These innovations enhance mouthfeel in ready-to-drink formats and extend shelf life, enabling manufacturers to enter categories like clinical beverages and shelf-stable meal replacements. The result is a broader addressable market with higher repeat purchase rates. As the line between food and health supplements continues to blur, MWP stands out as a versatile protein source capable of supporting both consumer preference and regulatory compliance.
Recent Developments
Dec 2024 – Arla Foods Ingredients: Arla launched a new clinical-grade microparticulated whey protein ingredient under its Lacprodan® portfolio, targeting medical nutrition and elderly care markets. The product supports high protein concentration in low-volume applications and is expected to generate over USD 22 million in incremental revenue by end-2025. This move reinforces Arla’s leadership in high-value, compliant nutritional segments.
Feb 2025 – CP Kelco: CP Kelco announced a co-development agreement with a Southeast Asian beverage manufacturer to integrate microparticulated whey protein into shelf-stable, high-protein drink formats. The partnership will support rollout across 4 regional markets with an expected reach of over 12 million consumers. This strengthens CP Kelco’s foothold in texture-modified protein applications across emerging economies.
Apr 2025 – Fonterra Future Dairy: Fonterra completed expansion of its Maharashtra facility in India to include local production of microparticulated whey protein for domestic RTD and dairy applications. The plant adds 8,000 metric tons of annual capacity and cuts import reliance by 40%. This enhances Fonterra’s cost position and supply chain resilience in South Asia’s price-sensitive market.
Jul 2025 – Carbery Group: Carbery introduced a patented microfiltration process that reduces grittiness in MWP-based RTD beverages by 60%, based on internal sensory panel scores. The new process is now integrated across its Ballineen plant in Ireland, with output targeting the EU and U.S. markets. This supports Carbery’s strategy to grow in high-margin functional beverage categories.
Sep 2025 – FrieslandCampina Ingredients: FrieslandCampina announced a licensing agreement with a Japanese pharmaceutical company to supply pharma-grade microparticulated whey protein for use in post-operative nutrition formulas. The five-year deal is valued at over USD 35 million. This marks FrieslandCampina’s entry into regulated medical applications, expanding its role beyond traditional food and sports nutrition sectors.