Mobile Hospitals Market Size, Growth Outlook | 14.5% CAGR
Global Mobile Hospitals Market Size, Share & Analysis By Type (Accident & Emergency Care Facility, General Surgery Facility, Diagnostics & Imaging Facility, Specialized Surgery Facility, Dental & Ophthalmic Facility, Others), By Function (Observation, Therapy /Treatment, Consultation, Intensive Care, Others), Industry Outlook, Government Initiatives & Forecast 2025–2034
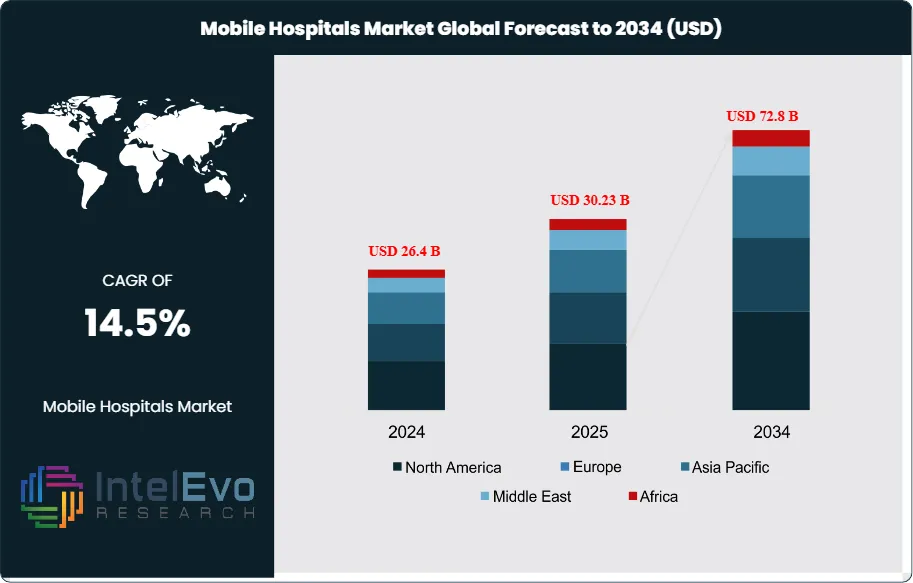
The Mobile Hospitals Market is estimated at USD 26.4 billion in 2024 and is on track to reach approximately USD 72.8 billion by 2034, implying a strong compound annual growth rate of about 14.5% over 2025–2034. Growing demand for rapid-deployment healthcare infrastructure—especially in disaster zones, military operations, rural communities, and epidemic response—is accelerating the adoption of mobile hospitals worldwide. Governments, NGOs, and private healthcare operators are increasingly shifting toward modular, AI-enabled clinical units that can be deployed in hours instead of months. As global health emergencies rise, mobile hospitals are becoming a cornerstone of resilient healthcare systems. The surge in telemedicine, point-of-care diagnostics, and solar-powered medical units is further reshaping the market landscape. With investments in defense healthcare, rural health missions, and emergency preparedness increasing globally, the demand curve is expected to strengthen even faster in the coming decade.
The market has expanded significantly in recent years as healthcare systems face rising pressure from natural disasters, armed conflicts, pandemics, and remote-area needs. Between 2018 and 2022, mobile hospital deployments increased by over 40% across conflict zones and underserved rural areas. The growing demand for scalable, fast-response medical infrastructure has reshaped investment strategies among healthcare providers, NGOs, and defense agencies. Governments across North America, Europe, and Asia have allocated increased public health budgets to mobile units, especially following COVID-19, which highlighted gaps in rapid-deployment care models.
Key growth drivers include the rising frequency of climate-related disasters, conflict-induced displacement, and the global focus on emergency preparedness. Demand-side factors are fueled by rising populations in underserved regions and limited access to permanent healthcare facilities. Supply-side improvements—particularly in modular engineering, rapid transport capabilities, and compact medical technology—are accelerating adoption. However, the market faces challenges such as high deployment costs, complex logistics, and varying cross-border regulatory frameworks.
Technology is central to market expansion. Advances in telemedicine, AI-powered diagnostics, and compact life support systems have transformed mobile hospitals into fully functional care hubs. Newer models now integrate digital health records, real-time patient monitoring, and remote consultation capabilities. Automation of sterilization and patient tracking also reduces manpower requirements and improves efficiency.
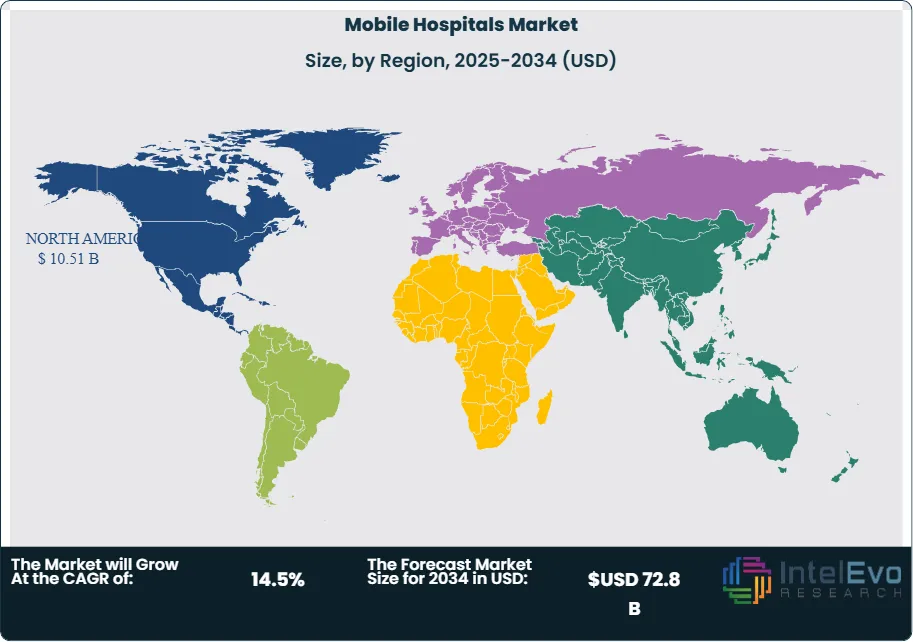
North America leads in market share due to strong public health infrastructure, military applications, and FEMA-backed funding initiatives. Europe follows, with increased deployments in Eastern European border zones. Meanwhile, Asia Pacific is emerging as a high-growth region, driven by government investments in disaster-prone countries such as India, Indonesia, and the Philippines. Sub-Saharan Africa is also gaining investor attention, with multi-stakeholder collaborations focused on maternal health and epidemic response.
Looking ahead, investor interest is expected to concentrate around modular hospital platforms, AI-integrated diagnostics, and mobile ICUs tailored for extreme conditions. The combination of rising emergency healthcare demand and portable medical technology will continue to define the market's trajectory through 2034.
Key Takeaways
Market Growth: The global mobile hospitals market is projected to grow from USD 26.4 billion in 2024 to USD 72.8 billion by 2034, registering a CAGR of 14.5% over the forecast period. Growth is driven by rising demand for emergency response infrastructure, especially in disaster-prone and underserved regions.
Application: The Accident & Emergency Care Facility segment led the market in 2023, capturing over 27.5% of total revenue. This is attributed to the increasing need for rapid medical deployment in conflict zones, natural disaster areas, and large-scale public events.
Service Type: Therapy/Treatment Services accounted for the highest share by service in 2023 at 29.8%, driven by demand for mobile surgical units, outpatient care, and chronic disease management in regions lacking permanent facilities.
Driver: Government-backed initiatives and military investments are fueling growth. In 2023, North America alone invested over USD 8.3 billion in mobile healthcare units, with FEMA and the U.S. Department of Defense expanding mobile ICU and triage capabilities.
Restraint: High capital costs and complex logistics remain key barriers. Initial deployment of modular hospitals can exceed USD 1 million per unit, limiting adoption in low-income countries without international aid or NGO partnerships.
Opportunity: The Asia Pacific region presents high-growth potential, with mobile healthcare demand accelerating in India, China, and Southeast Asia. The region is forecast to grow at a CAGR above the global average, supported by disaster response programs and rural healthcare initiatives.
Trend: Integration of digital diagnostics, telemedicine, and AI-driven triage is transforming mobile hospitals into connected care hubs. Key players are incorporating remote monitoring and EHR platforms to reduce dependency on on-site specialists.
Regional Analysis: North America held the largest market share in 2023 at 39.8%, driven by established infrastructure and emergency preparedness funding. Asia Pacific is emerging rapidly due to infrastructure gaps, rising population density, and climate-related disaster risk.
Type Analysis
The Accident & Emergency Care Facility segment accounted for the largest share of the mobile hospitals market in 2023, capturing over 27.5% of total revenue. This dominance reflects the growing global need for rapid-response medical infrastructure in conflict zones, disaster-affected regions, and areas with minimal healthcare access. These mobile units are designed for urgent interventions, equipped with trauma care, life-saving equipment, and emergency personnel, making them indispensable during crises. The increasing frequency of natural disasters and armed conflicts has driven investments from both government and humanitarian organizations in this segment.
General Surgery Facilities also contribute significantly to market demand. These units serve populations in remote or underserved locations where permanent surgical infrastructure is absent or overwhelmed. They enable critical interventions such as appendectomies, hernia repairs, and wound debridement. Their utility is especially evident during public health emergencies or large-scale events, where traditional hospitals face capacity constraints. In many regions, they function as the only viable surgical solution during times of infrastructural failure or displacement.
The Diagnostics & Imaging Facility segment addresses the critical need for on-site diagnostic capabilities in mobile formats. These units provide X-ray, ultrasound, and basic laboratory services, enabling early diagnosis and treatment planning in field conditions. They are increasingly adopted by military units, NGOs, and public health agencies in response to disease outbreaks or trauma scenarios. The demand for mobile diagnostics is rising as healthcare systems shift toward decentralized models.
Specialized Surgery Facilities, although smaller in market share, provide focused care in areas like orthopedics, cardiovascular surgery, or neurosurgery. These high-complexity units are typically deployed in regions where specialist access is limited or during medical missions. Their role is growing as portable surgical technologies become more advanced and compact.
Dental and Ophthalmic Facilities cater to niche but essential healthcare needs. These units are crucial in rural settings where access to eye exams or dental procedures is non-existent. With rising awareness of oral and visual health, this segment is expected to grow steadily, especially in low-income regions supported by public health campaigns.
The Other Facilities segment includes mobile units dedicated to maternal care, mental health, pediatric services, and chronic disease management. This category reflects the market’s diversification and responsiveness to specific healthcare demands in vulnerable populations.
Function Analysis
The Therapy/Treatment function dominated the mobile hospitals market in 2023, accounting for more than 29.8% of the total share. These units play a critical role in administering wound care, medications, surgical aftercare, and chronic disease management in field conditions. Their flexibility and wide range of services make them the backbone of mobile medical deployments across conflict zones, disaster sites, and rural health missions.
Observation Units serve as intermediate care spaces for patients who require monitoring without intensive interventions. These units support post-operative recovery, infection monitoring, and chronic disease observation. Their importance is rising in mobile deployments where referral to full-scale hospitals is delayed or impractical. Governments and aid organizations increasingly deploy observation-focused units during outbreaks to isolate and monitor suspected cases.
Consultation Facilities enable general healthcare services such as medical check-ups, preventive care, and disease counseling. These mobile clinics bridge significant gaps in primary care, especially in regions lacking medical personnel. With the rise of non-communicable diseases and growing emphasis on prevention, consultation functions are seeing increased deployment in both urban and remote settings.
The Intensive Care segment, though smaller in market share, is vital for handling severe trauma and critical care cases. These mobile ICUs are equipped with ventilators, monitoring systems, and trained personnel, providing high-acuity care in transit or near-crisis zones. Demand for mobile intensive care surged during the COVID-19 pandemic and remains elevated due to ongoing disaster preparedness strategies.
Other Functional Units include specialized services such as mental health support, maternity care, pediatric health, and infectious disease control. Their growing presence illustrates how the mobile hospital market is expanding beyond acute and emergency care to include long-term and community health services.
End-Use Analysis
The Residential Building sector is the leading end-use category for mobile hospitals, driven by rising demand for healthcare in refugee camps, disaster shelters, and remote settlements. These units serve populations displaced by climate events, war, or infrastructure failure, offering essential care near temporary living quarters. Their use has increased notably in regions experiencing prolonged humanitarian crises.
Commercial Buildings, including large corporate campuses, event venues, and temporary work sites, also utilize mobile hospitals. Organizations operating in remote locations—such as oil rigs, mining operations, and construction megaprojects—require onsite medical care to reduce evacuation costs and ensure workforce safety. This end-use category is expected to grow as companies seek to manage occupational health risks proactively.
Industrial Buildings, such as factories and logistics hubs, are adopting mobile medical units to support workplace health, especially in high-risk industries. Onsite healthcare solutions improve emergency response times and reduce productivity loss from health-related incidents. With stricter occupational health regulations, this segment is projected to expand in both developed and developing economies.
Regional Analysis
North America retained its position as the dominant market in 2023, accounting for 39.8% of global revenue, or USD 8.3 billion. The region benefits from well-established emergency response systems, defense sector funding, and high adoption of advanced mobile technologies. Public agencies like FEMA and the U.S. Department of Defense continue to deploy mobile hospitals for natural disaster response, pandemic control, and military operations. Technological integration, including mobile CT scans and telemedicine-enabled units, also supports market maturity.
Asia Pacific is emerging as the fastest-growing region through 2030, driven by healthcare access gaps, population growth, and disaster vulnerability. Countries such as India, China, and the Philippines are investing heavily in mobile healthcare infrastructure for both rural outreach and urban emergency preparedness. Strategic initiatives by local governments, along with partnerships with international health organizations, are accelerating deployment. The region is expected to outpace global average growth rates, with double-digit CAGR projections through the end of the forecast period.
Europe follows closely, with significant deployments in Eastern Europe and border regions supporting refugee flows and humanitarian response. EU funding initiatives and civil protection programs have supported procurement of mobile medical infrastructure, especially for member states facing cross-border health challenges.
Latin America and the Middle East & Africa are gaining investor attention, particularly in underserved rural areas and post-conflict zones. Mobile hospitals in these regions often rely on NGO funding and international aid, with growing interest from public-private partnerships aiming to fill healthcare delivery gaps.
By Type (Accident & Emergency Care Facility, General Surgery Facility, Diagnostics & Imaging Facility, Specialized Surgery Facility, Dental & Ophthalmic Facility, Others), By Function (Observation, Therapy /Treatment, Consultation, Intensive Care, Others)
Research Methodology
Primary Research- 100 Interviews of Stakeholders
Secondary Research
Desk Research
Regional scope
North America (United States, Canada, Mexico)
Latin America (Brazil, Argentina, Columbia)
East Asia And Pacific (China, Japan, South Korea, Australia, Cambodia, Fiji, Indonesia)
Sea And South Asia (India, Singapore, Thailand, Taiwan, Malaysia)
Eastern Europe (Poland, Russia, Czech Republic, Romania)
Western Europe (Germany, U.K., France, Spain, Itlay)
Middle East & Africa (GCC Countries, Egypt, Nigeria, South Africa, Israel)
Competitive Landscape
Vanguard Healthcare Solutions, EMS Healthcare Ltd., CGS Premier, Saba Palaye, Coastal Community Health Services, La Clinica Health Centers, Vetter GmbH, U-PROJECT, Alvo Medical, Aspen Medical, Lamboo Mobile Medical, Other Key Players
Customization Scope
Customization for segments, region/country-level will be provided. Moreover, additional customization can be done based on the requirements.
Pricing and Purchase Options
Avail customized purchase options to meet your exact research needs. We have three licenses to opt for: Single User License, Multi-User License (Up to 5 Users), Corporate Use License (Unlimited User and Printable PDF).
TABLE OF CONTENTS
1. EXECUTIVE SUMMARY
1.1. MARKET SNAPSHOT
1.2. KEY FINDINGS & INSIGHTS
1.3. ANALYST RECOMMENDATIONS
1.4. FUTURE OUTLOOK
2. RESEARCH METHODOLOGY
2.1. MARKET DEFINITION & SCOPE
2.2. RESEARCH OBJECTIVES: PRIMARY & SECONDARY DATA SOURCES
2.3. DATA COLLECTION SOURCES
2.3.1. COVERAGE OF 100+ PRIMARY RESEARCH/CONSULTATION CALLS WITH INDUSTRY STAKEHOLDERS
FIGURE 17 NORTH AMERICA MOBILE HOSPITALS CURRENT AND FUTURE TYPE ANALYSIS, 2025–2034, (USD MILLION)
FIGURE 18 NORTH AMERICA MOBILE HOSPITALS CURRENT AND FUTURE END USER ANALYSIS, 2025–2034, (USD MILLION)
FIGURE 19 MARKET SHARE BY COUNTRY
FIGURE 20 LATIN AMERICA MOBILE HOSPITALS CURRENT AND FUTURE TYPE ANALYSIS, 2025–2034, (USD MILLION)
FIGURE 21 LATIN AMERICA MOBILE HOSPITALS CURRENT AND FUTURE END USER ANALYSIS, 2025–2034, (USD MILLION)
FIGURE 22 MARKET SHARE BY COUNTRY
FIGURE 23 EASTERN EUROPE MOBILE HOSPITALS CURRENT AND FUTURE TYPE ANALYSIS, 2025–2034, (USD MILLION)
FIGURE 24 EASTERN EUROPE MOBILE HOSPITALS CURRENT AND FUTURE END USER ANALYSIS, 2025–2034, (USD MILLION)
FIGURE 25 MARKET SHARE BY COUNTRY
FIGURE 26 WESTERN EUROPE MOBILE HOSPITALS CURRENT AND FUTURE TYPE ANALYSIS, 2025–2034, (USD MILLION)
FIGURE 27 WESTERN EUROPE MOBILE HOSPITALS CURRENT AND FUTURE END USER ANALYSIS, 2025–2034, (USD MILLION)
FIGURE 28 MARKET SHARE BY COUNTRY
FIGURE 29 EAST ASIA AND PACIFIC MOBILE HOSPITALS CURRENT AND FUTURE TYPE ANALYSIS, 2025–2034, (USD MILLION)
FIGURE 30 EAST ASIA AND PACIFIC MOBILE HOSPITALS CURRENT AND FUTURE END USER ANALYSIS, 2025–2034, (USD MILLION)
FIGURE 31 MARKET SHARE BY COUNTRY
FIGURE 32 SEA AND SOUTH ASIA MOBILE HOSPITALS CURRENT AND FUTURE TYPE ANALYSIS, 2025–2034, (USD MILLION)
FIGURE 33 SEA AND SOUTH ASIA MOBILE HOSPITALS CURRENT AND FUTURE END USER ANALYSIS, 2025–2034, (USD MILLION)
FIGURE 34 MARKET SHARE BY COUNTRY
FIGURE 35 MIDDLE EAST AND AFRICA MOBILE HOSPITALS CURRENT AND FUTURE TYPE ANALYSIS, 2025–2034, (USD MILLION)
FIGURE 36 MIDDLE EAST AND AFRICA MOBILE HOSPITALS CURRENT AND FUTURE END USER ANALYSIS, 2025–2034, (USD MILLION)
FIGURE 37 NORTH AMERICA MOBILE HOSPITALS CURRENT AND FUTURE MARKET VOLUME SHARE REGIONAL ANALYSIS, 2025–2034, (USD MILLION)
FIGURE 38 U.S. MOBILE HOSPITALS CURRENT AND FUTURE TYPE ANALYSIS, 2025–2034, (USD MILLION)
FIGURE 39 U.S. MOBILE HOSPITALS CURRENT AND FUTURE END USER ANALYSIS, 2025–2034, (USD MILLION)
FIGURE 40 CANADA MOBILE HOSPITALS CURRENT AND FUTURE TYPE ANALYSIS, 2025–2034, (USD MILLION)
FIGURE 41 CANADA MOBILE HOSPITALS CURRENT AND FUTURE END USER ANALYSIS, 2025–2034, (USD MILLION)
FIGURE 42 LATIN AMERICA MOBILE HOSPITALS CURRENT AND FUTURE MARKET VOLUME SHARE REGIONAL ANALYSIS, 2025–2034, (USD MILLION)
FIGURE 43 MEXICO MOBILE HOSPITALS CURRENT AND FUTURE TYPE ANALYSIS, 2025–2034, (USD MILLION)
FIGURE 44 MEXICO MOBILE HOSPITALS CURRENT AND FUTURE END USER ANALYSIS, 2025–2034, (USD MILLION)
FIGURE 45 BRAZIL MOBILE HOSPITALS CURRENT AND FUTURE TYPE ANALYSIS, 2025–2034, (USD MILLION)
FIGURE 46 BRAZIL MOBILE HOSPITALS CURRENT AND FUTURE END USER ANALYSIS, 2025–2034, (USD MILLION)
FIGURE 47 ARGENTINA MOBILE HOSPITALS CURRENT AND FUTURE TYPE ANALYSIS, 2025–2034, (USD MILLION)
FIGURE 48 ARGENTINA MOBILE HOSPITALS CURRENT AND FUTURE END USER ANALYSIS, 2025–2034, (USD MILLION)
FIGURE 49 COLUMBIA MOBILE HOSPITALS CURRENT AND FUTURE TYPE ANALYSIS, 2025–2034, (USD MILLION)
FIGURE 50 COLUMBIA MOBILE HOSPITALS CURRENT AND FUTURE END USER ANALYSIS, 2025–2034, (USD MILLION)
FIGURE 51 REST OF LATIN AMERICA MOBILE HOSPITALS CURRENT AND FUTURE TYPE ANALYSIS, 2025–2034, (USD MILLION)
FIGURE 52 REST OF LATIN AMERICA MOBILE HOSPITALS CURRENT AND FUTURE END USER ANALYSIS, 2025–2034, (USD MILLION)
FIGURE 53 EASTERN EUROPE MOBILE HOSPITALS CURRENT AND FUTURE MARKET VOLUME SHARE REGIONAL ANALYSIS, 2025–2034, (USD MILLION)
FIGURE 54 POLAND MOBILE HOSPITALS CURRENT AND FUTURE TYPE ANALYSIS, 2025–2034, (USD MILLION)
FIGURE 55 POLAND MOBILE HOSPITALS CURRENT AND FUTURE END USER ANALYSIS, 2025–2034, (USD MILLION)
FIGURE 56 RUSSIA MOBILE HOSPITALS CURRENT AND FUTURE TYPE ANALYSIS, 2025–2034, (USD MILLION)
FIGURE 57 RUSSIA MOBILE HOSPITALS CURRENT AND FUTURE END USER ANALYSIS, 2025–2034, (USD MILLION)
FIGURE 58 CZECH REPUBLIC MOBILE HOSPITALS CURRENT AND FUTURE TYPE ANALYSIS, 2025–2034, (USD MILLION)
FIGURE 59 CZECH REPUBLIC MOBILE HOSPITALS CURRENT AND FUTURE END USER ANALYSIS, 2025–2034, (USD MILLION)
FIGURE 60 ROMANIA MOBILE HOSPITALS CURRENT AND FUTURE TYPE ANALYSIS, 2025–2034, (USD MILLION)
FIGURE 61 ROMANIA MOBILE HOSPITALS CURRENT AND FUTURE END USER ANALYSIS, 2025–2034, (USD MILLION)
FIGURE 62 REST OF EASTERN EUROPE MOBILE HOSPITALS CURRENT AND FUTURE TYPE ANALYSIS, 2025–2034, (USD MILLION)
FIGURE 63 REST OF EASTERN EUROPE MOBILE HOSPITALS CURRENT AND FUTURE END USER ANALYSIS, 2025–2034, (USD MILLION)
FIGURE 64 WESTERN EUROPE MOBILE HOSPITALS CURRENT AND FUTURE MARKET VOLUME SHARE REGIONAL ANALYSIS, 2025–2034, (USD MILLION)
FIGURE 65 GERMANY MOBILE HOSPITALS CURRENT AND FUTURE TYPE ANALYSIS, 2025–2034, (USD MILLION)
FIGURE 66 GERMANY MOBILE HOSPITALS CURRENT AND FUTURE END USER ANALYSIS, 2025–2034, (USD MILLION)
FIGURE 67 FRANCE MOBILE HOSPITALS CURRENT AND FUTURE TYPE ANALYSIS, 2025–2034, (USD MILLION)
FIGURE 68 FRANCE MOBILE HOSPITALS CURRENT AND FUTURE END USER ANALYSIS, 2025–2034, (USD MILLION)
FIGURE 69 UK MOBILE HOSPITALS CURRENT AND FUTURE TYPE ANALYSIS, 2025–2034, (USD MILLION)
FIGURE 70 UK MOBILE HOSPITALS CURRENT AND FUTURE END USER ANALYSIS, 2025–2034, (USD MILLION)
FIGURE 71 SPAIN MOBILE HOSPITALS CURRENT AND FUTURE TYPE ANALYSIS, 2025–2034, (USD MILLION)
FIGURE 72 SPAIN MOBILE HOSPITALS CURRENT AND FUTURE END USER ANALYSIS, 2025–2034, (USD MILLION)
FIGURE 73 ITALY MOBILE HOSPITALS CURRENT AND FUTURE TYPE ANALYSIS, 2025–2034, (USD MILLION)
FIGURE 74 ITALY MOBILE HOSPITALS CURRENT AND FUTURE END USER ANALYSIS, 2025–2034, (USD MILLION)
FIGURE 75 REST OF WESTERN EUROPE MOBILE HOSPITALS CURRENT AND FUTURE TYPE ANALYSIS, 2025–2034, (USD MILLION)
FIGURE 76 REST OF WESTERN EUROPE MOBILE HOSPITALS CURRENT AND FUTURE END USER ANALYSIS, 2025–2034, (USD MILLION)
FIGURE 77 EAST ASIA AND PACIFIC MOBILE HOSPITALS CURRENT AND FUTURE MARKET VOLUME SHARE REGIONAL ANALYSIS, 2025–2034, (USD MILLION)
FIGURE 78 CHINA MOBILE HOSPITALS CURRENT AND FUTURE TYPE ANALYSIS, 2025–2034, (USD MILLION)
FIGURE 79 CHINA MOBILE HOSPITALS CURRENT AND FUTURE END USER ANALYSIS, 2025–2034, (USD MILLION)
FIGURE 80 JAPAN MOBILE HOSPITALS CURRENT AND FUTURE TYPE ANALYSIS, 2025–2034, (USD MILLION)
FIGURE 81 JAPAN MOBILE HOSPITALS CURRENT AND FUTURE END USER ANALYSIS, 2025–2034, (USD MILLION)
FIGURE 82 AUSTRALIA MOBILE HOSPITALS CURRENT AND FUTURE TYPE ANALYSIS, 2025–2034, (USD MILLION)
FIGURE 83 AUSTRALIA MOBILE HOSPITALS CURRENT AND FUTURE END USER ANALYSIS, 2025–2034, (USD MILLION)
FIGURE 84 CAMBODIA MOBILE HOSPITALS CURRENT AND FUTURE TYPE ANALYSIS, 2025–2034, (USD MILLION)
FIGURE 85 CAMBODIA MOBILE HOSPITALS CURRENT AND FUTURE END USER ANALYSIS, 2025–2034, (USD MILLION)
FIGURE 86 FIJI MOBILE HOSPITALS CURRENT AND FUTURE TYPE ANALYSIS, 2025–2034, (USD MILLION)
FIGURE 87 FIJI MOBILE HOSPITALS CURRENT AND FUTURE END USER ANALYSIS, 2025–2034, (USD MILLION)
FIGURE 88 INDONESIA MOBILE HOSPITALS CURRENT AND FUTURE TYPE ANALYSIS, 2025–2034, (USD MILLION)
FIGURE 89 INDONESIA MOBILE HOSPITALS CURRENT AND FUTURE END USER ANALYSIS, 2025–2034, (USD MILLION)
FIGURE 90 SOUTH KOREA MOBILE HOSPITALS CURRENT AND FUTURE TYPE ANALYSIS, 2025–2034, (USD MILLION)
FIGURE 91 SOUTH KOREA MOBILE HOSPITALS CURRENT AND FUTURE END USER ANALYSIS, 2025–2034, (USD MILLION)
FIGURE 92 REST OF EAST ASIA AND PACIFIC MOBILE HOSPITALS CURRENT AND FUTURE TYPE ANALYSIS, 2025–2034, (USD MILLION)
FIGURE 93 REST OF EAST ASIA AND PACIFIC MOBILE HOSPITALS CURRENT AND FUTURE END USER ANALYSIS, 2025–2034, (USD MILLION)
FIGURE 94 SEA AND SOUTH ASIA MOBILE HOSPITALS CURRENT AND FUTURE MARKET VOLUME SHARE REGIONAL ANALYSIS, 2025–2034, (USD MILLION)
FIGURE 95 BANGLADESH MOBILE HOSPITALS CURRENT AND FUTURE TYPE ANALYSIS, 2025–2034, (USD MILLION)
FIGURE 96 BANGLADESH MOBILE HOSPITALS CURRENT AND FUTURE END USER ANALYSIS, 2025–2034, (USD MILLION)
FIGURE 97 NEW ZEALAND MOBILE HOSPITALS CURRENT AND FUTURE TYPE ANALYSIS, 2025–2034, (USD MILLION)
FIGURE 98 NEW ZEALAND MOBILE HOSPITALS CURRENT AND FUTURE END USER ANALYSIS, 2025–2034, (USD MILLION)
FIGURE 99 INDIA MOBILE HOSPITALS CURRENT AND FUTURE TYPE ANALYSIS, 2025–2034, (USD MILLION)
FIGURE 100 INDIA MOBILE HOSPITALS CURRENT AND FUTURE END USER ANALYSIS, 2025–2034, (USD MILLION)
FIGURE 101 SINGAPORE MOBILE HOSPITALS CURRENT AND FUTURE TYPE ANALYSIS, 2025–2034, (USD MILLION)
FIGURE 102 SINGAPORE MOBILE HOSPITALS CURRENT AND FUTURE END USER ANALYSIS, 2025–2034, (USD MILLION)
FIGURE 103 THAILAND MOBILE HOSPITALS CURRENT AND FUTURE TYPE ANALYSIS, 2025–2034, (USD MILLION)
FIGURE 104 THAILAND MOBILE HOSPITALS CURRENT AND FUTURE END USER ANALYSIS, 2025–2034, (USD MILLION)
FIGURE 105 TAIWAN MOBILE HOSPITALS CURRENT AND FUTURE TYPE ANALYSIS, 2025–2034, (USD MILLION)
FIGURE 106 TAIWAN MOBILE HOSPITALS CURRENT AND FUTURE END USER ANALYSIS, 2025–2034, (USD MILLION)
FIGURE 107 MALAYSIA MOBILE HOSPITALS CURRENT AND FUTURE TYPE ANALYSIS, 2025–2034, (USD MILLION)
FIGURE 108 MALAYSIA MOBILE HOSPITALS CURRENT AND FUTURE END USER ANALYSIS, 2025–2034, (USD MILLION)
FIGURE 109 REST OF SEA AND SOUTH ASIA MOBILE HOSPITALS CURRENT AND FUTURE TYPE ANALYSIS, 2025–2034, (USD MILLION)
FIGURE 110 REST OF SEA AND SOUTH ASIA MOBILE HOSPITALS CURRENT AND FUTURE END USER ANALYSIS, 2025–2034, (USD MILLION)
FIGURE 111 MIDDLE EAST AND AFRICA MOBILE HOSPITALS CURRENT AND FUTURE MARKET VOLUME SHARE REGIONAL ANALYSIS, 2025–2034, (USD MILLION)
FIGURE 112 GCC COUNTRIES MOBILE HOSPITALS CURRENT AND FUTURE TYPE ANALYSIS, 2025–2034, (USD MILLION)
FIGURE 113 GCC COUNTRIES MOBILE HOSPITALS CURRENT AND FUTURE END USER ANALYSIS, 2025–2034, (USD MILLION)
FIGURE 114 SAUDI ARABIA MOBILE HOSPITALS CURRENT AND FUTURE TYPE ANALYSIS, 2025–2034, (USD MILLION)
FIGURE 115 SAUDI ARABIA MOBILE HOSPITALS CURRENT AND FUTURE END USER ANALYSIS, 2025–2034, (USD MILLION)
FIGURE 116 UAE MOBILE HOSPITALS CURRENT AND FUTURE TYPE ANALYSIS, 2025–2034, (USD MILLION)
FIGURE 117 UAE MOBILE HOSPITALS CURRENT AND FUTURE END USER ANALYSIS, 2025–2034, (USD MILLION)
FIGURE 118 BAHRAIN MOBILE HOSPITALS CURRENT AND FUTURE TYPE ANALYSIS, 2025–2034, (USD MILLION)
FIGURE 119 BAHRAIN MOBILE HOSPITALS CURRENT AND FUTURE END USER ANALYSIS, 2025–2034, (USD MILLION)
FIGURE 120 KUWAIT MOBILE HOSPITALS CURRENT AND FUTURE TYPE ANALYSIS, 2025–2034, (USD MILLION)
FIGURE 121 KUWAIT MOBILE HOSPITALS CURRENT AND FUTURE END USER ANALYSIS, 2025–2034, (USD MILLION)
FIGURE 122 OMAN MOBILE HOSPITALS CURRENT AND FUTURE TYPE ANALYSIS, 2025–2034, (USD MILLION)
FIGURE 123 OMAN MOBILE HOSPITALS CURRENT AND FUTURE END USER ANALYSIS, 2025–2034, (USD MILLION)
FIGURE 124 QATAR MOBILE HOSPITALS CURRENT AND FUTURE TYPE ANALYSIS, 2025–2034, (USD MILLION)
FIGURE 125 QATAR MOBILE HOSPITALS CURRENT AND FUTURE END USER ANALYSIS, 2025–2034, (USD MILLION)
FIGURE 126 EGYPT MOBILE HOSPITALS CURRENT AND FUTURE TYPE ANALYSIS, 2025–2034, (USD MILLION)
FIGURE 127 EGYPT MOBILE HOSPITALS CURRENT AND FUTURE END USER ANALYSIS, 2025–2034, (USD MILLION)
FIGURE 128 NIGERIA MOBILE HOSPITALS CURRENT AND FUTURE TYPE ANALYSIS, 2025–2034, (USD MILLION)
FIGURE 129 NIGERIA MOBILE HOSPITALS CURRENT AND FUTURE END USER ANALYSIS, 2025–2034, (USD MILLION)
FIGURE 130 SOUTH AFRICA MOBILE HOSPITALS CURRENT AND FUTURE TYPE ANALYSIS, 2025–2034, (USD MILLION)
FIGURE 131 SOUTH AFRICA MOBILE HOSPITALS CURRENT AND FUTURE END USER ANALYSIS, 2025–2034, (USD MILLION)
FIGURE 132 ISRAEL MOBILE HOSPITALS CURRENT AND FUTURE TYPE ANALYSIS, 2025–2034, (USD MILLION)
FIGURE 133 ISRAEL MOBILE HOSPITALS CURRENT AND FUTURE END USER ANALYSIS, 2025–2034, (USD MILLION)
FIGURE 134 REST OF MEA MOBILE HOSPITALS CURRENT AND FUTURE TYPE ANALYSIS, 2025–2034, (USD MILLION)
FIGURE 135 REST OF MEA MOBILE HOSPITALS CURRENT AND FUTURE END USER ANALYSIS, 2025–2034, (USD MILLION)
FIGURE 136 U. S. MARKET SHARE ANALYSIS BY TYPE (2024)
FIGURE 137 U. S. MARKET SHARE ANALYSIS BY END USER (2024)
FIGURE 138 CANADA MARKET SHARE ANALYSIS BY TYPE (2024)
FIGURE 139 CANADA MARKET SHARE ANALYSIS BY END USER (2024)
FIGURE 140 MEXICO MARKET SHARE ANALYSIS BY TYPE (2024)
FIGURE 141 MEXICO MARKET SHARE ANALYSIS BY END USER (2024)
FIGURE 142 CHINA MARKET SHARE ANALYSIS BY TYPE (2024)
FIGURE 143 CHINA MARKET SHARE ANALYSIS BY END USER (2024)
FIGURE 144 JAPAN MARKET SHARE ANALYSIS BY TYPE (2024)
FIGURE 145 JAPAN MARKET SHARE ANALYSIS BY END USER (2024)
FIGURE 146 INDIA MARKET SHARE ANALYSIS BY TYPE (2024)
FIGURE 147 INDIA MARKET SHARE ANALYSIS BY END USER (2024)
FIGURE 148 SOUTH KOREA MARKET SHARE ANALYSIS BY TYPE (2024)
FIGURE 149 SOUTH KOREA MARKET SHARE ANALYSIS BY END USER (2024)
FIGURE 150 SAUDI ARABIA MARKET SHARE ANALYSIS BY TYPE (2024)
FIGURE 151 SAUDI ARABIA MARKET SHARE ANALYSIS BY END USER (2024)
FIGURE 152 UAE MARKET SHARE ANALYSIS BY TYPE (2024)
FIGURE 153 UAE MARKET SHARE ANALYSIS BY END USER (2024)
FIGURE 154 EGYPT MARKET SHARE ANALYSIS BY TYPE (2024)
FIGURE 155 EGYPT MARKET SHARE ANALYSIS BY END USER (2024)
FIGURE 156 NIGERIA MARKET SHARE ANALYSIS BY TYPE (2024)
FIGURE 157 NIGERIA MARKET SHARE ANALYSIS BY END USER (2024)
FIGURE 158 SOUTH AFRICA MARKET SHARE ANALYSIS BY TYPE (2024)
FIGURE 159 SOUTH AFRICA MARKET SHARE ANALYSIS BY END USER (2024)
FIGURE 160 GERMANY MARKET SHARE ANALYSIS BY TYPE (2024)
FIGURE 161 GERMANY MARKET SHARE ANALYSIS BY END USER (2024)
FIGURE 162 FRANCE MARKET SHARE ANALYSIS BY TYPE (2024)
FIGURE 163 FRANCE MARKET SHARE ANALYSIS BY END USER (2024)
FIGURE 164 UK MARKET SHARE ANALYSIS BY TYPE (2024)
FIGURE 165 UK MARKET SHARE ANALYSIS BY END USER (2024)
FIGURE 166 SPAIN MARKET SHARE ANALYSIS BY TYPE (2024)
FIGURE 167 SPAIN MARKET SHARE ANALYSIS BY END USER (2024)
FIGURE 168 ITALY MARKET SHARE ANALYSIS BY TYPE (2024)
FIGURE 169 ITALY MARKET SHARE ANALYSIS BY END USER (2024)
FIGURE 170 BRAZIL MARKET SHARE ANALYSIS BY TYPE (2024)
FIGURE 171 BRAZIL MARKET SHARE ANALYSIS BY END USER (2024)
FIGURE 172 ARGENTINA MARKET SHARE ANALYSIS BY TYPE (2024)
FIGURE 173 ARGENTINA MARKET SHARE ANALYSIS BY END USER (2024)
FIGURE 174 COLUMBIA MARKET SHARE ANALYSIS BY TYPE (2024)
FIGURE 175 COLUMBIA MARKET SHARE ANALYSIS BY END USER (2024)
FIGURE 176 GLOBAL MOBILE HOSPITALS CURRENT AND FUTURE MARKET KEY COUNTRY LEVEL ANALYSIS, 2024–2034, (USD MILLION)
FIGURE 177 FINANCIAL OVERVIEW:
Key Player Analysis
Alvo Medical: Alvo Medical positions itself as a niche player in the mobile hospitals market, with a strong focus on modular medical infrastructure and surgical environments. The company’s mobile solutions are engineered to meet international clinical standards, particularly for operating rooms and diagnostic units. Alvo’s presence is most prominent in Central and Eastern Europe, where it supplies modular units to both public and private sector clients.
Strategically, Alvo Medical has concentrated on advancing smart integration within mobile units. In 2024, the company expanded its “Alvo Integra” platform to mobile operating theatres, enabling digital control of surgical lighting, airflow, and diagnostics. This technology alignment with smart hospital trends positions the company well for markets demanding precision and automation. Its collaboration with health ministries in Poland and Romania has driven steady contract wins, particularly in EU-funded regional health programs.
Aspen Medical: Aspen Medical is a market leader, widely recognized for its large-scale deployments of mobile medical facilities in conflict zones, disaster sites, and underserved communities. Headquartered in Australia, the company operates globally and maintains contracts with organizations such as the United Nations, the Australian Department of Defence, and the World Health Organization. Aspen’s strength lies in rapid deployment and operational capability across complex environments.
In 2025, Aspen continues to scale its modular field hospital program, offering full-service units equipped with trauma care, diagnostics, and isolation wards. The company has invested in AI-enabled triage systems and remote patient monitoring tools, reflecting its alignment with global digital health priorities. With operations in over 20 countries and a reputation for reliability under pressure, Aspen holds significant market share in humanitarian and government contracts across Asia Pacific, the Middle East, and Sub-Saharan Africa.
CGS Premier: CGS Premier operates as a challenger in the mobile healthcare market, specializing in high-performance transportable medical units tailored for both commercial and emergency applications. The company’s strength lies in its custom-engineered platforms that support rapid assembly and field adaptability. While based in the U.S., CGS Premier has expanded its footprint across North America and is exploring growth opportunities in Latin America and Southeast Asia.
In 2024, CGS Premier launched a series of hybrid mobile diagnostic labs designed to support outbreak containment and public health screening. These units integrate solar power and off-grid capability, which has positioned the company as a preferred vendor in remote deployment scenarios. Strategic partnerships with logistics firms and healthcare operators have enhanced CGS’s delivery timelines and after-service support, giving it a competitive edge in time-sensitive contracts.
Saba Palaye: Saba Palaye remains a regional innovator, with a stronghold in the Middle East and North Africa mobile hospital market. Known for its modular clinics and surgical units, the company serves both civilian and defense sector clients. It has carved a niche by customizing mobile facilities for extreme climate conditions, particularly in desert and semi-arid environments.
In 2025, Saba Palaye is actively expanding its portfolio through public-private partnerships in Gulf countries. Its recent collaboration with the Saudi Ministry of Health includes the delivery of 80 mobile diagnostic units as part of the country’s rural healthcare initiative. The company differentiates itself through localized engineering, Arabic-language interface systems, and region-specific compliance, making it a preferred supplier in culturally and climatically distinct markets.
Market Key Players
Vanguard Healthcare Solutions
EMS Healthcare Ltd.
CGS Premier
Saba Palaye
Coastal Community Health Services
La Clinica Health Centers
Vetter GmbH
U-PROJECT
Alvo Medical
Aspen Medical
Lamboo Mobile Medical
Other Key Players
Driver:
Escalating Crises Fuel Demand for Rapid-Deployment Medical Units
As of 2025, the growing frequency of climate-related disasters, conflict zones, and mass displacement events continues to drive demand for rapid-deployment medical infrastructure. Mobile hospitals have become essential tools in emergency response, enabling on-site care in regions without permanent facilities. In the last two years alone, over 60% of humanitarian medical deployments included mobile hospital units. Governments and relief agencies are scaling investment, with public health authorities in the U.S., China, and India increasing mobile healthcare allocations by over 25% year-on-year. The strategic role of mobile hospitals in crisis settings is now embedded in national emergency preparedness frameworks.
Digital Health Innovations Expand Mobile Hospital Capabilities
Advances in digital health are further enhancing mobile hospital utility. Integrated telemedicine platforms, AI-assisted triage, and compact diagnostic equipment have expanded the scope of treatment beyond basic care. These technologies allow mobile units to operate semi-autonomously while maintaining real-time connectivity with centralized hospitals. As mobile units become more technologically enabled, their function is shifting from temporary relief to a core component of decentralized healthcare delivery.
Despite growing adoption, mobile hospitals face structural and operational constraints that limit market scalability. One of the most persistent challenges is the global shortage of qualified healthcare professionals willing or able to operate in mobile environments. As of 2025, over 30% of mobile deployments report staffing gaps, particularly for surgical and diagnostic roles. This constraint directly impacts service quality and deployment capacity in high-demand areas.
Poor System Integration Reduces Care Continuity and Efficiency
Another significant restraint lies in fragmented integration with national healthcare systems. Many mobile units operate outside formal hospital networks, which complicates patient record sharing, follow-up care, and supply chain logistics. The result is reduced continuity of care and inefficiencies in patient management. These limitations pose a risk to long-term adoption, especially in countries where health system interoperability remains underdeveloped.
Opportunity:
High-Growth Potential in Emerging and Underserved Regions
Emerging economies, particularly in Asia Pacific and Sub-Saharan Africa, present strong growth potential for mobile hospitals through 2030. With rural populations exceeding 2.5 billion and limited brick-and-mortar infrastructure, mobile healthcare offers a faster, more cost-effective solution. India, for example, has committed to deploying over 3,000 mobile health units under its National Health Mission, targeting underserved regions with high disease burdens.
Rising Geriatric Population Boosts Demand for Mobile Care Solutions
Geriatric care is another expanding opportunity. The population aged 65+ is expected to reach over 1.1 billion globally by 2030, according to UN projections. This demographic shift is accelerating demand for mobile services that deliver chronic disease management, home-based care, and routine screening. Investors and service providers that can offer modular, age-friendly mobile units stand to benefit from rising demand in both urban and rural settings.
Trend:
Shift Toward Decentralized, Preventive, and Chronic Care Models
The mobile hospitals market is increasingly shaped by the shift toward decentralized and preventive healthcare. Rising rates of chronic conditions, including diabetes, hypertension, and COPD, are driving demand for recurring and location-flexible treatment options. Mobile clinics are adapting by integrating chronic disease management programs and remote monitoring tools, enabling continuity of care without the need for hospital visits.
Government Funding and Global Partnerships Accelerate Adoption
Governments are reinforcing this trend through direct funding and strategic donations. In 2024, multiple African nations received mobile clinics through multilateral health partnerships, with support from China, the WHO, and the Global Fund. Additionally, global healthcare spending is projected to grow at 6.2% CAGR through 2028, with mobile infrastructure receiving an increasing share. These developments are pushing mobile hospitals into the mainstream, transforming them from emergency stopgaps into a permanent feature of the healthcare delivery landscape.
Recent Developments
Dec 2024 – Aspen Medical: Aspen Medical signed a five-year framework agreement with the World Health Organization to deploy 120 modular mobile hospitals across East and West Africa. The deal, valued at over USD 140 million, includes emergency and surgical units. This strengthens Aspen’s leadership in humanitarian and institutional healthcare deployments.
Feb 2025 – CGS Premier: CGS Premier launched a hybrid-powered diagnostic trailer series with integrated solar arrays and backup fuel cells. The units reduce fuel consumption by 30% and are designed for off-grid deployment. This move improves the company’s competitiveness in energy-constrained regions and supports growing sustainability requirements in procurement contracts.
Apr 2025 – Alvo Medical: Alvo Medical expanded into Southeast Asia through a distribution partnership with a Thai healthcare conglomerate. The deal covers modular surgical units and diagnostic platforms across five ASEAN countries, with initial deployment targeting 20 units. This broadens Alvo’s regional footprint and accelerates its access to high-growth markets.
Jul 2025 – Saba Palaye: Saba Palaye secured a contract with the United Arab Emirates’ Ministry of Health to deliver 50 mobile diagnostic clinics equipped with Arabic-language AI triage systems. The deal is expected to generate USD 65 million in revenue over three years. This reinforces Saba Palaye’s specialization in culturally localized mobile solutions.
Sep 2025 – Medtronic: Medtronic entered the mobile hospitals market through a joint venture with a U.S.-based logistics firm, focusing on mobile chronic disease management units for rural North America. The pilot program will deploy 35 mobile clinics by early 2026. This marks a significant new entrant and intensifies competition in the North American segment.