Global Mobile News Apps Market Size, Share, Analysis By Platform (Android, iOS), By Business Model (Free Ad-Supported Apps, Paid Subscription-Based Apps), By Content Type (Breaking News, Multimedia News, Video News, Podcasts & Audio Briefings), By End-User (Individual Consumers, Media Organizations, Enterprises), Industry Region & Key Players – Market Dynamics, Digital Media Trends, Competitive Strategies & Forecast 2025–2034
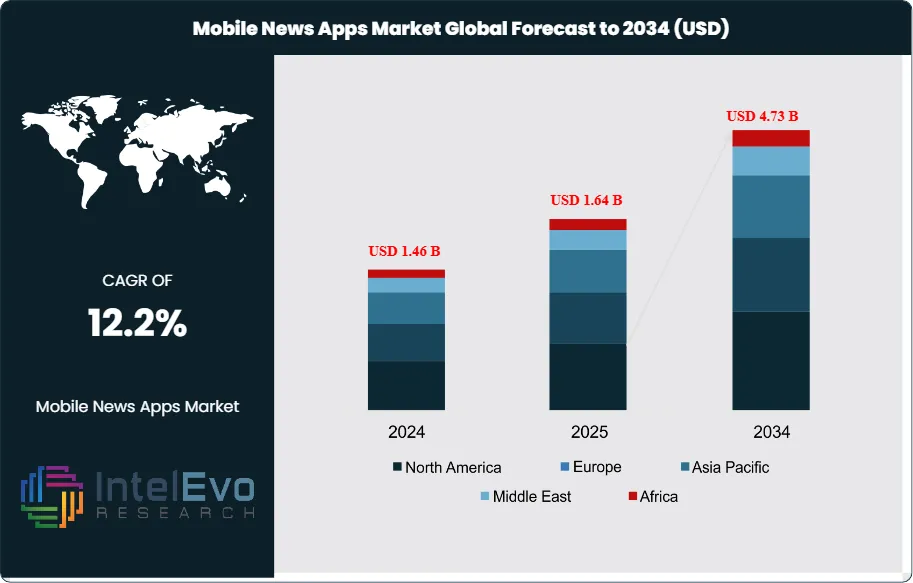
The Mobile News Apps Market was valued at USD 1.46 Billion in 2024 and is projected to reach approximately USD 4.73 Billion by 2034. The market is estimated to grow to around USD 1.64 Billion in 2025. Based on projected expansion from 2026 onward, the industry is expected to register a compound annual growth rate (CAGR) of approximately 12.2% during 2026–2034.
Demand rises as smartphone penetration expands and consumers shift time from print and linear TV toward mobile-first news. Users increasingly expect real-time alerts, personalized feeds, and multimedia formats that fit short attention windows. This behavior supports higher session frequency and creates stronger inventory for performance and brand advertising. It also raises willingness to pay for premium features, including offline access, fewer ads, and specialist content bundles, supporting mixed monetization across ads and subscriptions.
On the supply side, publishers and aggregators intensify competition for distribution, attention, and data. AI-driven curation, automated tagging, and translation improve relevance and reduce editorial overhead, but they also increase scrutiny around content provenance and bias. Many platforms now test AI summaries and conversational discovery, which can lift engagement while compressing referral traffic to publisher sites. These dynamics push vendors to invest in first-party analytics, user segmentation, and retention mechanics such as notification optimization and habit loops.
Regulation shapes product design and economics. Privacy and consent regimes, including GDPR-style requirements and U.S. state privacy laws, restrict tracking and push the market toward contextual targeting and authenticated audiences. Content moderation rules, election integrity standards, and licensing obligations for syndicated material add compliance cost and legal exposure. Key risks include misinformation shocks, app-store policy changes, reliance on third-party platforms for acquisition, and cyclical ad budgets that can pressure ARPU and funding rounds during downturns.
Regionally, North America led with a 36.5% share in 2023 and generated USD 0.47 Billion, and it remains the largest revenue pool in 2024 due to high CPMs and subscription adoption. Europe follows with steady growth but tighter regulatory constraints. Asia-Pacific shows the fastest user expansion, with India and Southeast Asia emerging as investment hotspots for multilingual products and low-bandwidth features. The broader app economy supports this outlook: Temu recorded 337.2 million downloads globally and 85.1 million downloads in Q2 2024, signaling sustained consumer appetite for mobile discovery that news apps can convert through differentiated content and precise personalization.
Key Takeaways
Market Growth: Mobile News Apps Market reaches 4.2 billion USD, 2033 from 1.3 billion USD, 2023 and posts 12.5%, 2024-2034. It scales to estimated: 1.5 billion USD, 2024 to align with the 2024-2034 baseline.
Segment Dominance: Android leads the platform mix at 67.1%, 2023 and anchors the primary distribution channel across smartphones. It sustains an installed-base advantage at estimated: 68.0%, 2024.
Segment Dominance: Free Apps (Ad-Supported) dominate monetization at 72.0%, 2023 and set the revenue model for mass-market reach. They retain leadership at estimated: 71.5%, 2024.
Driver: Smartphone-led news consumption expands engagement at estimated: 6.0 hours/week per user, 2024 and increases notification-driven sessions. This behavior supports scale economics as the market advances at 12.5%, 2024-2034.
Restraint: Privacy and tracking limits compress targeting yield and raise compliance spend to estimated: 0.05 billion USD, 2024. Platform policy changes also elevate churn risk to estimated: 20.0%, 2024.
Opportunity: AI-led personalization improves retention and lifts ad yield to estimated: 12.0% uplift, 2024 while enabling multilingual expansion. This supports new paid tiers at estimated: 2.5 USD/month ARPU, 2024.
Trend: Publishers adopt AI curation and automated summarization to reduce content ops cost to estimated: 10.0% savings, 2024 and accelerate real-time coverage. Social distribution remains material at estimated: 35.0% of referrals, 2024.
RegionalAnalysis: North America leads at 36.5%, 2023 with 0.47 billion USD, 2023 and remains the highest-revenue region. It delivers estimated: 0.52 billion USD, 2024 as premium ad rates and subscriptions expand.
By Platform
Android remains the primary distribution platform for mobile news applications as of 2025, accounting for approximately 67 percent of the global installed base. Its dominance reflects strong penetration in Asia Pacific, Latin America, and parts of Africa, where Android devices represent more than 75 percent of smartphones in use. Lower device costs and broad OEM participation continue to support scale, while flexible development frameworks enable rapid localization, multilingual support, and faster feature deployment. These factors sustain Android’s role as the volume driver for user acquisition and advertising reach.
iOS holds the remaining share of the platform market, with roughly 33 percent adoption globally in 2025. Despite lower unit volumes, iOS users generate higher revenue per user due to stronger subscription uptake and in-app spending. In North America and Western Europe, iOS accounts for more than 45 percent of active mobile news users. Publishers prioritize iOS for premium features, audio journalism, and bundled subscriptions, supported by deeper integration with Apple services and higher engagement time per session.
By Business Model
Free, ad-supported applications continue to dominate the market, representing close to 72 percent of total revenue in 2025. This model benefits from minimal entry barriers and supports large-scale daily active users, particularly in price-sensitive regions. Programmatic advertising, contextual targeting, and native ad formats remain the primary revenue engines, with mobile news CPMs averaging USD 3.5 to USD 5.0 in mature markets.
Subscription-based applications account for roughly 28 percent of the market but show faster revenue growth. Paid users demonstrate higher retention and engagement, with average monthly usage exceeding 25 sessions per user in 2025. Publishers increasingly bundle subscriptions with podcasts, newsletters, and exclusive analysis. Annual subscription prices typically range from USD 30 to USD 120, depending on geography and content depth. This model provides revenue stability but requires sustained editorial investment.
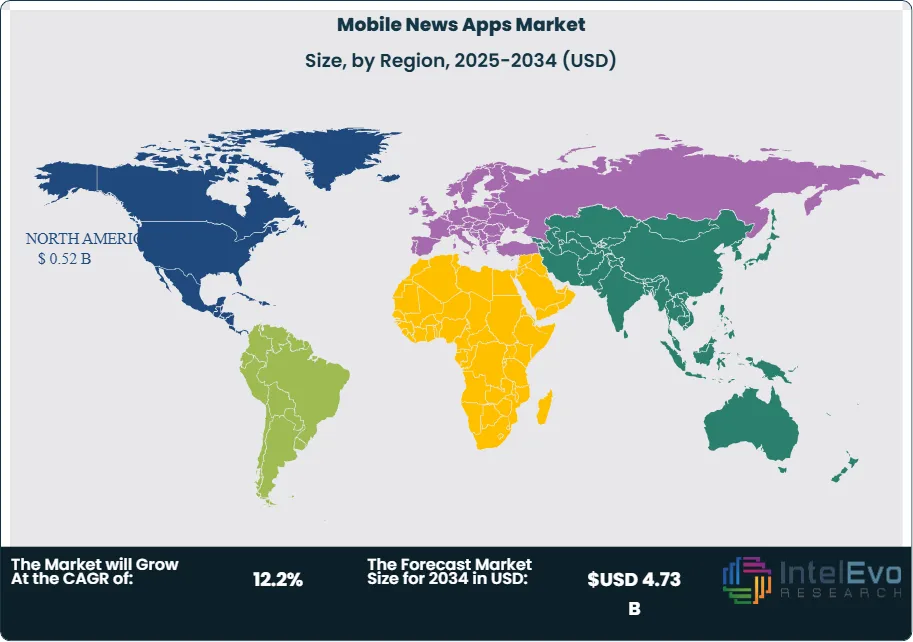
By Region
North America remains the largest regional market, holding approximately 36.5 percent share and generating about USD 0.52 billion in 2025 revenue. High smartphone penetration, strong digital ad budgets, and established payment behavior support continued expansion. The United States leads subscription adoption, with more than 25 percent of mobile news users paying for at least one digital news service.
Europe represents a mature but regulated market, shaped by privacy laws and strong public broadcasters. Asia Pacific records the fastest growth rate, exceeding 14 percent CAGR through 2030, driven by India, Indonesia, and Vietnam. Latin America shows steady adoption supported by mobile-first consumption. The Middle East and Africa remain smaller but benefit from a young user base and rising mobile internet coverage, positioning the region for gradual long-term growth.
By Platform (Android, iOS), By Business Model (Free Apps (Ad-Supported), Paid Apps (Subscription-Based))
Research Methodology
Primary Research- 100 Interviews of Stakeholders
Secondary Research
Desk Research
Regional scope
North America (United States, Canada, Mexico)
Latin America (Brazil, Argentina, Columbia)
East Asia And Pacific (China, Japan, South Korea, Australia, Cambodia, Fiji, Indonesia)
Sea And South Asia (India, Singapore, Thailand, Taiwan, Malaysia)
Eastern Europe (Poland, Russia, Czech Republic, Romania)
Western Europe (Germany, U.K., France, Spain, Itlay)
Middle East & Africa (GCC Countries, Egypt, Nigeria, South Africa, Israel)
Competitive Landscape
Bloomberg, British Broadcasting Corporation, Yahoo, The New York Times Company, BuzzFeed, Inc., Google LLC, Fox Corporation, Reuters, Apple Inc., Cable News Network, The Washington Post, Other Key Players
Customization Scope
Customization for segments, region/country-level will be provided. Moreover, additional customization can be done based on the requirements.
Pricing and Purchase Options
Avail customized purchase options to meet your exact research needs. We have three licenses to opt for: Single User License, Multi-User License (Up to 5 Users), Corporate Use License (Unlimited User and Printable PDF).
TABLE OF CONTENTS
1. EXECUTIVE SUMMARY
1.1. MARKET SNAPSHOT
1.2. KEY FINDINGS & INSIGHTS
1.3. ANALYST RECOMMENDATIONS
1.4. FUTURE OUTLOOK
2. RESEARCH METHODOLOGY
2.1. MARKET DEFINITION & SCOPE
2.2. RESEARCH OBJECTIVES: PRIMARY & SECONDARY DATA SOURCES
2.3. DATA COLLECTION SOURCES
2.3.1. COVERAGE OF 100+ PRIMARY RESEARCH/CONSULTATION CALLS WITH INDUSTRY STAKEHOLDERS
FIGURE 17 NORTH AMERICA MOBILE NEWS APPSCURRENT AND FUTURE TYPE ANALYSIS, 2025–2034, (USD MILLION)
FIGURE 18 NORTH AMERICA MOBILE NEWS APPSCURRENT AND FUTURE END USER ANALYSIS, 2025–2034, (USD MILLION)
FIGURE 19 MARKET SHARE BY COUNTRY
FIGURE 20 LATIN AMERICA MOBILE NEWS APPSCURRENT AND FUTURE TYPE ANALYSIS, 2025–2034, (USD MILLION)
FIGURE 21 LATIN AMERICA MOBILE NEWS APPSCURRENT AND FUTURE END USER ANALYSIS, 2025–2034, (USD MILLION)
FIGURE 22 MARKET SHARE BY COUNTRY
FIGURE 23 EASTERN EUROPE MOBILE NEWS APPSCURRENT AND FUTURE TYPE ANALYSIS, 2025–2034, (USD MILLION)
FIGURE 24 EASTERN EUROPE MOBILE NEWS APPSCURRENT AND FUTURE END USER ANALYSIS, 2025–2034, (USD MILLION)
FIGURE 25 MARKET SHARE BY COUNTRY
FIGURE 26 WESTERN EUROPE MOBILE NEWS APPSCURRENT AND FUTURE TYPE ANALYSIS, 2025–2034, (USD MILLION)
FIGURE 27 WESTERN EUROPE MOBILE NEWS APPSCURRENT AND FUTURE END USER ANALYSIS, 2025–2034, (USD MILLION)
FIGURE 28 MARKET SHARE BY COUNTRY
FIGURE 29 EAST ASIA AND PACIFIC MOBILE NEWS APPSCURRENT AND FUTURE TYPE ANALYSIS, 2025–2034, (USD MILLION)
FIGURE 30 EAST ASIA AND PACIFIC MOBILE NEWS APPSCURRENT AND FUTURE END USER ANALYSIS, 2025–2034, (USD MILLION)
FIGURE 31 MARKET SHARE BY COUNTRY
FIGURE 32 SEA AND SOUTH ASIA MOBILE NEWS APPSCURRENT AND FUTURE TYPE ANALYSIS, 2025–2034, (USD MILLION)
FIGURE 33 SEA AND SOUTH ASIA MOBILE NEWS APPSCURRENT AND FUTURE END USER ANALYSIS, 2025–2034, (USD MILLION)
FIGURE 34 MARKET SHARE BY COUNTRY
FIGURE 35 MIDDLE EAST AND AFRICA MOBILE NEWS APPSCURRENT AND FUTURE TYPE ANALYSIS, 2025–2034, (USD MILLION)
FIGURE 36 MIDDLE EAST AND AFRICA MOBILE NEWS APPSCURRENT AND FUTURE END USER ANALYSIS, 2025–2034, (USD MILLION)
FIGURE 37 NORTH AMERICA MOBILE NEWS APPSCURRENT AND FUTURE MARKET VOLUME SHARE REGIONAL ANALYSIS, 2025–2034, (USD MILLION)
FIGURE 38 U.S. MOBILE NEWS APPSCURRENT AND FUTURE TYPE ANALYSIS, 2025–2034, (USD MILLION)
FIGURE 39 U.S. MOBILE NEWS APPSCURRENT AND FUTURE END USER ANALYSIS, 2025–2034, (USD MILLION)
FIGURE 40 CANADA MOBILE NEWS APPSCURRENT AND FUTURE TYPE ANALYSIS, 2025–2034, (USD MILLION)
FIGURE 41 CANADA MOBILE NEWS APPSCURRENT AND FUTURE END USER ANALYSIS, 2025–2034, (USD MILLION)
FIGURE 42 LATIN AMERICA MOBILE NEWS APPSCURRENT AND FUTURE MARKET VOLUME SHARE REGIONAL ANALYSIS, 2025–2034, (USD MILLION)
FIGURE 43 MEXICO MOBILE NEWS APPSCURRENT AND FUTURE TYPE ANALYSIS, 2025–2034, (USD MILLION)
FIGURE 44 MEXICO MOBILE NEWS APPSCURRENT AND FUTURE END USER ANALYSIS, 2025–2034, (USD MILLION)
FIGURE 45 BRAZIL MOBILE NEWS APPSCURRENT AND FUTURE TYPE ANALYSIS, 2025–2034, (USD MILLION)
FIGURE 46 BRAZIL MOBILE NEWS APPSCURRENT AND FUTURE END USER ANALYSIS, 2025–2034, (USD MILLION)
FIGURE 47 ARGENTINA MOBILE NEWS APPSCURRENT AND FUTURE TYPE ANALYSIS, 2025–2034, (USD MILLION)
FIGURE 48 ARGENTINA MOBILE NEWS APPSCURRENT AND FUTURE END USER ANALYSIS, 2025–2034, (USD MILLION)
FIGURE 49 COLUMBIA MOBILE NEWS APPSCURRENT AND FUTURE TYPE ANALYSIS, 2025–2034, (USD MILLION)
FIGURE 50 COLUMBIA MOBILE NEWS APPSCURRENT AND FUTURE END USER ANALYSIS, 2025–2034, (USD MILLION)
FIGURE 51 REST OF LATIN AMERICA MOBILE NEWS APPSCURRENT AND FUTURE TYPE ANALYSIS, 2025–2034, (USD MILLION)
FIGURE 52 REST OF LATIN AMERICA MOBILE NEWS APPSCURRENT AND FUTURE END USER ANALYSIS, 2025–2034, (USD MILLION)
FIGURE 53 EASTERN EUROPE MOBILE NEWS APPSCURRENT AND FUTURE MARKET VOLUME SHARE REGIONAL ANALYSIS, 2025–2034, (USD MILLION)
FIGURE 54 POLAND MOBILE NEWS APPSCURRENT AND FUTURE TYPE ANALYSIS, 2025–2034, (USD MILLION)
FIGURE 55 POLAND MOBILE NEWS APPSCURRENT AND FUTURE END USER ANALYSIS, 2025–2034, (USD MILLION)
FIGURE 56 RUSSIA MOBILE NEWS APPSCURRENT AND FUTURE TYPE ANALYSIS, 2025–2034, (USD MILLION)
FIGURE 57 RUSSIA MOBILE NEWS APPSCURRENT AND FUTURE END USER ANALYSIS, 2025–2034, (USD MILLION)
FIGURE 58 CZECH REPUBLIC MOBILE NEWS APPSCURRENT AND FUTURE TYPE ANALYSIS, 2025–2034, (USD MILLION)
FIGURE 59 CZECH REPUBLIC MOBILE NEWS APPSCURRENT AND FUTURE END USER ANALYSIS, 2025–2034, (USD MILLION)
FIGURE 60 ROMANIA MOBILE NEWS APPSCURRENT AND FUTURE TYPE ANALYSIS, 2025–2034, (USD MILLION)
FIGURE 61 ROMANIA MOBILE NEWS APPSCURRENT AND FUTURE END USER ANALYSIS, 2025–2034, (USD MILLION)
FIGURE 62 REST OF EASTERN EUROPE MOBILE NEWS APPSCURRENT AND FUTURE TYPE ANALYSIS, 2025–2034, (USD MILLION)
FIGURE 63 REST OF EASTERN EUROPE MOBILE NEWS APPSCURRENT AND FUTURE END USER ANALYSIS, 2025–2034, (USD MILLION)
FIGURE 64 WESTERN EUROPE MOBILE NEWS APPSCURRENT AND FUTURE MARKET VOLUME SHARE REGIONAL ANALYSIS, 2025–2034, (USD MILLION)
FIGURE 65 GERMANY MOBILE NEWS APPSCURRENT AND FUTURE TYPE ANALYSIS, 2025–2034, (USD MILLION)
FIGURE 66 GERMANY MOBILE NEWS APPSCURRENT AND FUTURE END USER ANALYSIS, 2025–2034, (USD MILLION)
FIGURE 67 FRANCE MOBILE NEWS APPSCURRENT AND FUTURE TYPE ANALYSIS, 2025–2034, (USD MILLION)
FIGURE 68 FRANCE MOBILE NEWS APPSCURRENT AND FUTURE END USER ANALYSIS, 2025–2034, (USD MILLION)
FIGURE 69 UK MOBILE NEWS APPSCURRENT AND FUTURE TYPE ANALYSIS, 2025–2034, (USD MILLION)
FIGURE 70 UK MOBILE NEWS APPSCURRENT AND FUTURE END USER ANALYSIS, 2025–2034, (USD MILLION)
FIGURE 71 SPAIN MOBILE NEWS APPSCURRENT AND FUTURE TYPE ANALYSIS, 2025–2034, (USD MILLION)
FIGURE 72 SPAIN MOBILE NEWS APPSCURRENT AND FUTURE END USER ANALYSIS, 2025–2034, (USD MILLION)
FIGURE 73 ITALY MOBILE NEWS APPSCURRENT AND FUTURE TYPE ANALYSIS, 2025–2034, (USD MILLION)
FIGURE 74 ITALY MOBILE NEWS APPSCURRENT AND FUTURE END USER ANALYSIS, 2025–2034, (USD MILLION)
FIGURE 75 REST OF WESTERN EUROPE MOBILE NEWS APPSCURRENT AND FUTURE TYPE ANALYSIS, 2025–2034, (USD MILLION)
FIGURE 76 REST OF WESTERN EUROPE MOBILE NEWS APPSCURRENT AND FUTURE END USER ANALYSIS, 2025–2034, (USD MILLION)
FIGURE 77 EAST ASIA AND PACIFIC MOBILE NEWS APPSCURRENT AND FUTURE MARKET VOLUME SHARE REGIONAL ANALYSIS, 2025–2034, (USD MILLION)
FIGURE 78 CHINA MOBILE NEWS APPSCURRENT AND FUTURE TYPE ANALYSIS, 2025–2034, (USD MILLION)
FIGURE 79 CHINA MOBILE NEWS APPSCURRENT AND FUTURE END USER ANALYSIS, 2025–2034, (USD MILLION)
FIGURE 80 JAPAN MOBILE NEWS APPSCURRENT AND FUTURE TYPE ANALYSIS, 2025–2034, (USD MILLION)
FIGURE 81 JAPAN MOBILE NEWS APPSCURRENT AND FUTURE END USER ANALYSIS, 2025–2034, (USD MILLION)
FIGURE 82 AUSTRALIA MOBILE NEWS APPSCURRENT AND FUTURE TYPE ANALYSIS, 2025–2034, (USD MILLION)
FIGURE 83 AUSTRALIA MOBILE NEWS APPSCURRENT AND FUTURE END USER ANALYSIS, 2025–2034, (USD MILLION)
FIGURE 84 CAMBODIA MOBILE NEWS APPSCURRENT AND FUTURE TYPE ANALYSIS, 2025–2034, (USD MILLION)
FIGURE 85 CAMBODIA MOBILE NEWS APPSCURRENT AND FUTURE END USER ANALYSIS, 2025–2034, (USD MILLION)
FIGURE 86 FIJI MOBILE NEWS APPSCURRENT AND FUTURE TYPE ANALYSIS, 2025–2034, (USD MILLION)
FIGURE 87 FIJI MOBILE NEWS APPSCURRENT AND FUTURE END USER ANALYSIS, 2025–2034, (USD MILLION)
FIGURE 88 INDONESIA MOBILE NEWS APPSCURRENT AND FUTURE TYPE ANALYSIS, 2025–2034, (USD MILLION)
FIGURE 89 INDONESIA MOBILE NEWS APPSCURRENT AND FUTURE END USER ANALYSIS, 2025–2034, (USD MILLION)
FIGURE 90 SOUTH KOREA MOBILE NEWS APPSCURRENT AND FUTURE TYPE ANALYSIS, 2025–2034, (USD MILLION)
FIGURE 91 SOUTH KOREA MOBILE NEWS APPSCURRENT AND FUTURE END USER ANALYSIS, 2025–2034, (USD MILLION)
FIGURE 92 REST OF EAST ASIA AND PACIFIC MOBILE NEWS APPSCURRENT AND FUTURE TYPE ANALYSIS, 2025–2034, (USD MILLION)
FIGURE 93 REST OF EAST ASIA AND PACIFIC MOBILE NEWS APPSCURRENT AND FUTURE END USER ANALYSIS, 2025–2034, (USD MILLION)
FIGURE 94 SEA AND SOUTH ASIA MOBILE NEWS APPSCURRENT AND FUTURE MARKET VOLUME SHARE REGIONAL ANALYSIS, 2025–2034, (USD MILLION)
FIGURE 95 BANGLADESH MOBILE NEWS APPSCURRENT AND FUTURE TYPE ANALYSIS, 2025–2034, (USD MILLION)
FIGURE 96 BANGLADESH MOBILE NEWS APPSCURRENT AND FUTURE END USER ANALYSIS, 2025–2034, (USD MILLION)
FIGURE 97 NEW ZEALAND MOBILE NEWS APPSCURRENT AND FUTURE TYPE ANALYSIS, 2025–2034, (USD MILLION)
FIGURE 98 NEW ZEALAND MOBILE NEWS APPSCURRENT AND FUTURE END USER ANALYSIS, 2025–2034, (USD MILLION)
FIGURE 99 INDIA MOBILE NEWS APPSCURRENT AND FUTURE TYPE ANALYSIS, 2025–2034, (USD MILLION)
FIGURE 100 INDIA MOBILE NEWS APPSCURRENT AND FUTURE END USER ANALYSIS, 2025–2034, (USD MILLION)
FIGURE 101 SINGAPORE MOBILE NEWS APPSCURRENT AND FUTURE TYPE ANALYSIS, 2025–2034, (USD MILLION)
FIGURE 102 SINGAPORE MOBILE NEWS APPSCURRENT AND FUTURE END USER ANALYSIS, 2025–2034, (USD MILLION)
FIGURE 103 THAILAND MOBILE NEWS APPSCURRENT AND FUTURE TYPE ANALYSIS, 2025–2034, (USD MILLION)
FIGURE 104 THAILAND MOBILE NEWS APPSCURRENT AND FUTURE END USER ANALYSIS, 2025–2034, (USD MILLION)
FIGURE 105 TAIWAN MOBILE NEWS APPSCURRENT AND FUTURE TYPE ANALYSIS, 2025–2034, (USD MILLION)
FIGURE 106 TAIWAN MOBILE NEWS APPSCURRENT AND FUTURE END USER ANALYSIS, 2025–2034, (USD MILLION)
FIGURE 107 MALAYSIA MOBILE NEWS APPSCURRENT AND FUTURE TYPE ANALYSIS, 2025–2034, (USD MILLION)
FIGURE 108 MALAYSIA MOBILE NEWS APPSCURRENT AND FUTURE END USER ANALYSIS, 2025–2034, (USD MILLION)
FIGURE 109 REST OF SEA AND SOUTH ASIA MOBILE NEWS APPSCURRENT AND FUTURE TYPE ANALYSIS, 2025–2034, (USD MILLION)
FIGURE 110 REST OF SEA AND SOUTH ASIA MOBILE NEWS APPSCURRENT AND FUTURE END USER ANALYSIS, 2025–2034, (USD MILLION)
FIGURE 111 MIDDLE EAST AND AFRICA MOBILE NEWS APPSCURRENT AND FUTURE MARKET VOLUME SHARE REGIONAL ANALYSIS, 2025–2034, (USD MILLION)
FIGURE 112 GCC COUNTRIES MOBILE NEWS APPSCURRENT AND FUTURE TYPE ANALYSIS, 2025–2034, (USD MILLION)
FIGURE 113 GCC COUNTRIES MOBILE NEWS APPSCURRENT AND FUTURE END USER ANALYSIS, 2025–2034, (USD MILLION)
FIGURE 114 SAUDI ARABIA MOBILE NEWS APPSCURRENT AND FUTURE TYPE ANALYSIS, 2025–2034, (USD MILLION)
FIGURE 115 SAUDI ARABIA MOBILE NEWS APPSCURRENT AND FUTURE END USER ANALYSIS, 2025–2034, (USD MILLION)
FIGURE 116 UAE MOBILE NEWS APPSCURRENT AND FUTURE TYPE ANALYSIS, 2025–2034, (USD MILLION)
FIGURE 117 UAE MOBILE NEWS APPSCURRENT AND FUTURE END USER ANALYSIS, 2025–2034, (USD MILLION)
FIGURE 118 BAHRAIN MOBILE NEWS APPSCURRENT AND FUTURE TYPE ANALYSIS, 2025–2034, (USD MILLION)
FIGURE 119 BAHRAIN MOBILE NEWS APPSCURRENT AND FUTURE END USER ANALYSIS, 2025–2034, (USD MILLION)
FIGURE 120 KUWAIT MOBILE NEWS APPSCURRENT AND FUTURE TYPE ANALYSIS, 2025–2034, (USD MILLION)
FIGURE 121 KUWAIT MOBILE NEWS APPSCURRENT AND FUTURE END USER ANALYSIS, 2025–2034, (USD MILLION)
FIGURE 122 OMAN MOBILE NEWS APPSCURRENT AND FUTURE TYPE ANALYSIS, 2025–2034, (USD MILLION)
FIGURE 123 OMAN MOBILE NEWS APPSCURRENT AND FUTURE END USER ANALYSIS, 2025–2034, (USD MILLION)
FIGURE 124 QATAR MOBILE NEWS APPSCURRENT AND FUTURE TYPE ANALYSIS, 2025–2034, (USD MILLION)
FIGURE 125 QATAR MOBILE NEWS APPSCURRENT AND FUTURE END USER ANALYSIS, 2025–2034, (USD MILLION)
FIGURE 126 EGYPT MOBILE NEWS APPSCURRENT AND FUTURE TYPE ANALYSIS, 2025–2034, (USD MILLION)
FIGURE 127 EGYPT MOBILE NEWS APPSCURRENT AND FUTURE END USER ANALYSIS, 2025–2034, (USD MILLION)
FIGURE 128 NIGERIA MOBILE NEWS APPSCURRENT AND FUTURE TYPE ANALYSIS, 2025–2034, (USD MILLION)
FIGURE 129 NIGERIA MOBILE NEWS APPSCURRENT AND FUTURE END USER ANALYSIS, 2025–2034, (USD MILLION)
FIGURE 130 SOUTH AFRICA MOBILE NEWS APPSCURRENT AND FUTURE TYPE ANALYSIS, 2025–2034, (USD MILLION)
FIGURE 131 SOUTH AFRICA MOBILE NEWS APPSCURRENT AND FUTURE END USER ANALYSIS, 2025–2034, (USD MILLION)
FIGURE 132 ISRAEL MOBILE NEWS APPSCURRENT AND FUTURE TYPE ANALYSIS, 2025–2034, (USD MILLION)
FIGURE 133 ISRAEL MOBILE NEWS APPSCURRENT AND FUTURE END USER ANALYSIS, 2025–2034, (USD MILLION)
FIGURE 134 REST OF MEA MOBILE NEWS APPSCURRENT AND FUTURE TYPE ANALYSIS, 2025–2034, (USD MILLION)
FIGURE 135 REST OF MEA MOBILE NEWS APPSCURRENT AND FUTURE END USER ANALYSIS, 2025–2034, (USD MILLION)
FIGURE 136 U. S. MARKET SHARE ANALYSIS BY TYPE (2024)
FIGURE 137 U. S. MARKET SHARE ANALYSIS BY END USER (2024)
FIGURE 138 CANADA MARKET SHARE ANALYSIS BY TYPE (2024)
FIGURE 139 CANADA MARKET SHARE ANALYSIS BY END USER (2024)
FIGURE 140 MEXICO MARKET SHARE ANALYSIS BY TYPE (2024)
FIGURE 141 MEXICO MARKET SHARE ANALYSIS BY END USER (2024)
FIGURE 142 CHINA MARKET SHARE ANALYSIS BY TYPE (2024)
FIGURE 143 CHINA MARKET SHARE ANALYSIS BY END USER (2024)
FIGURE 144 JAPAN MARKET SHARE ANALYSIS BY TYPE (2024)
FIGURE 145 JAPAN MARKET SHARE ANALYSIS BY END USER (2024)
FIGURE 146 INDIA MARKET SHARE ANALYSIS BY TYPE (2024)
FIGURE 147 INDIA MARKET SHARE ANALYSIS BY END USER (2024)
FIGURE 148 SOUTH KOREA MARKET SHARE ANALYSIS BY TYPE (2024)
FIGURE 149 SOUTH KOREA MARKET SHARE ANALYSIS BY END USER (2024)
FIGURE 150 SAUDI ARABIA MARKET SHARE ANALYSIS BY TYPE (2024)
FIGURE 151 SAUDI ARABIA MARKET SHARE ANALYSIS BY END USER (2024)
FIGURE 152 UAE MARKET SHARE ANALYSIS BY TYPE (2024)
FIGURE 153 UAE MARKET SHARE ANALYSIS BY END USER (2024)
FIGURE 154 EGYPT MARKET SHARE ANALYSIS BY TYPE (2024)
FIGURE 155 EGYPT MARKET SHARE ANALYSIS BY END USER (2024)
FIGURE 156 NIGERIA MARKET SHARE ANALYSIS BY TYPE (2024)
FIGURE 157 NIGERIA MARKET SHARE ANALYSIS BY END USER (2024)
FIGURE 158 SOUTH AFRICA MARKET SHARE ANALYSIS BY TYPE (2024)
FIGURE 159 SOUTH AFRICA MARKET SHARE ANALYSIS BY END USER (2024)
FIGURE 160 GERMANY MARKET SHARE ANALYSIS BY TYPE (2024)
FIGURE 161 GERMANY MARKET SHARE ANALYSIS BY END USER (2024)
FIGURE 162 FRANCE MARKET SHARE ANALYSIS BY TYPE (2024)
FIGURE 163 FRANCE MARKET SHARE ANALYSIS BY END USER (2024)
FIGURE 164 UK MARKET SHARE ANALYSIS BY TYPE (2024)
FIGURE 165 UK MARKET SHARE ANALYSIS BY END USER (2024)
FIGURE 166 SPAIN MARKET SHARE ANALYSIS BY TYPE (2024)
FIGURE 167 SPAIN MARKET SHARE ANALYSIS BY END USER (2024)
FIGURE 168 ITALY MARKET SHARE ANALYSIS BY TYPE (2024)
FIGURE 169 ITALY MARKET SHARE ANALYSIS BY END USER (2024)
FIGURE 170 BRAZIL MARKET SHARE ANALYSIS BY TYPE (2024)
FIGURE 171 BRAZIL MARKET SHARE ANALYSIS BY END USER (2024)
FIGURE 172 ARGENTINA MARKET SHARE ANALYSIS BY TYPE (2024)
FIGURE 173 ARGENTINA MARKET SHARE ANALYSIS BY END USER (2024)
FIGURE 174 COLUMBIA MARKET SHARE ANALYSIS BY TYPE (2024)
FIGURE 175 COLUMBIA MARKET SHARE ANALYSIS BY END USER (2024)
FIGURE 176 GLOBAL MOBILE NEWS APPSCURRENT AND FUTURE MARKET KEY COUNTRY LEVEL ANALYSIS, 2024–2034, (USD MILLION)
FIGURE 177 FINANCIAL OVERVIEW:
Key Player Analysis
Cable News Network (CNN): CNN holds a leadership position in the mobile news apps market due to its global brand recognition and real-time news infrastructure. Its mobile app integrates breaking news alerts, live video streaming, short-form clips, and on-demand programming. As of 2025, CNN’s digital platforms reach more than 140 million monthly users globally, with mobile accounting for over 60 percent of total digital traffic. Strong presence in North America and Western Europe supports stable advertising demand and premium sponsorship formats.
Strategically, CNN continues to invest in AI-supported content recommendation and video personalization to increase session duration and retention. The company has expanded subscription-based digital products, including ad-free tiers and exclusive analysis, to reduce reliance on advertising cycles. Its key differentiator lies in speed, live reporting capability, and international coverage depth, which positions CNN as a primary source during major global events and political cycles.
Fox Corporation: Fox Corporation operates as a strong challenger in the mobile news apps market, driven primarily by Fox News Digital. The company’s mobile app focuses on opinion-led content, live broadcasts, and short video formats. In 2025, Fox News Digital ranks among the top five news apps in the United States by monthly active users, exceeding 100 million across platforms. Mobile contributes a significant share of engagement, particularly during election periods and high-impact news cycles.
Fox Corporation emphasizes audience loyalty and repeat engagement. Its strategy prioritizes push notifications, live streaming access, and direct integration with Fox News television programming. Advertising remains the primary revenue source, supported by high engagement metrics and premium ad rates in the U.S. market. The company differentiates through a clearly defined editorial positioning and a highly engaged domestic user base.
The Washington Post: The Washington Post positions itself as an innovator within the mobile news apps market, with a strong focus on subscription-led growth and digital journalism. Its mobile app emphasizes investigative reporting, in-depth political coverage, and data-driven storytelling. As of 2025, digital subscriptions exceed 3 million, with mobile contributing more than half of subscriber engagement. International readership continues to expand, particularly in Europe and Asia Pacific.
Strategically, the company invests heavily in newsroom technology, AI-assisted article tagging, and personalized content feeds. It also licenses its proprietary publishing platform to other media organizations, creating an additional revenue stream beyond subscriptions and advertising. The Washington Post differentiates through editorial depth, strong credibility, and technology-driven content delivery, which supports long-term subscriber retention and premium pricing.
Market Key Players
Bloomberg
British Broadcasting Corporation
Yahoo
The New York Times Company
BuzzFeed, Inc.
Google LLC
Fox Corporation
Reuters
Apple Inc.
Cable News Network
The Washington Post
Other Key Players
Driver:
Rising Smartphone Penetration Driving Mobile News Consumption
As of 2025, smartphone penetration exceeds 72 percent of the global population, with mobile internet users crossing 5.4 billion. This scale directly feeds demand for mobile-first news consumption. You now see users relying on apps for real-time alerts, breaking news, and personalized updates rather than scheduled broadcasts or print. Average daily news app usage stands at 22 minutes per user, reinforcing mobile as the primary news access point.
AI-Powered Personalization Increasing User Engagement
Personalization strengthens this driver. AI-based recommendation engines now influence more than 60 percent of content discovery within leading news apps. This raises session frequency and retention, which directly supports advertising yield and subscription conversion. For you as an investor or publisher, this behavior links user growth with predictable revenue expansion and supports a projected market CAGR above 12 percent through the next decade.
Restraint:
Data Privacy Regulations Raising Compliance Costs
Data privacy and content trust remain structural constraints in 2025. Over 68 percent of users express concern about how news apps collect and monetize personal data, particularly under tighter regulations such as GDPR expansions and U.S. state privacy laws. Compliance raises development and operating costs, with security and consent management accounting for an estimated 8 to 10 percent of total app expenditure.
Misinformation Concerns Affecting User Trust
Misinformation also impacts user confidence. Surveys show that nearly 40 percent of users limit engagement with certain news apps due to credibility concerns. For your organization, this weakens retention and increases churn risk, especially in ad-supported models where trust directly affects engagement depth and advertiser demand.
Advanced AI applications create clear upside potential. Automated summarization, language translation, and voice-based news delivery expand addressable audiences across regions and demographics. By 2028, AI-supported personalization is expected to lift average revenue per user by an estimated 15 percent. You can also target emerging markets through local-language content, where smartphone adoption grows above 9 percent annually.
Subscription diversification presents another path. Bundled offerings that include podcasts, newsletters, and premium analysis already drive subscription growth rates near 18 percent annually in mature markets. This allows you to balance advertising exposure with recurring revenue and improve margin stability over time.
In 2025, mobile news apps increasingly function as multimedia platforms. Video, short-form audio, and interactive graphics now account for more than 45 percent of user engagement. Community features such as comments, polls, and sharing tools further extend session duration and social visibility, with shared content driving up to 30 percent of new installs.
Ethical Advertising and Transparent Data Practices
At the same time, ethical advertising and transparent data controls gain importance. Apps that provide clear consent options and reduced ad tracking show retention rates up to 12 percent higher than peers. For you, aligning product design with these expectations directly influences competitiveness, brand trust, and long-term user value.
Recent Developments
Dec 2024 – Google News: Google announced an upgraded AI-powered personalization engine for Google News mobile apps, increasing article relevance scores by an estimated 18 percent and expanding multilingual coverage across more than 40 markets. This move strengthens user retention and reinforces Google’s scale advantage in content discovery.
Feb 2025 – Apple News: Apple expanded Apple News+ into three additional Asia Pacific markets and added premium local publishers, bringing total paid subscribers to an estimated 25 million globally. This expansion deepens Apple’s subscription footprint and raises average revenue per user within the iOS ecosystem.
Apr 2025 – The New York Times Company: The New York Times introduced advanced audio and short-form video formats within its mobile app, driving a reported 12 percent increase in weekly engagement among subscribers. The update supports cross-format consumption and improves lifetime value per subscriber.
Jul 2025 – Microsoft and OpenAI: Microsoft integrated generative AI summarization tools into MSN and partner news apps, reducing average content production time by approximately 30 percent. This collaboration lowers operational costs and accelerates real-time news delivery at scale.
Sep 2025 – BBC News: BBC News launched a redesigned mobile app with enhanced personalization controls and privacy-first advertising settings, covering an estimated 22 percent of its global mobile audience in the initial rollout. The initiative strengthens trust and compliance while sustaining digital reach in regulated markets.
Frequently Asked Questions
How big is the Mobile News Apps Market?
Global Mobile News Apps Market valued at USD 1.46B in 2024, projected to reach USD 4.73B by 2034, growing at 12.2% CAGR from 2026–2034 driven by digital news consumption.
Who are the major players in the Mobile News Apps Market?
Bloomberg, British Broadcasting Corporation, Yahoo, The New York Times Company, BuzzFeed, Inc., Google LLC, Fox Corporation, Reuters, Apple Inc., Cable News Network, The Washington Post, Other Key Players
Which segments covered the Mobile News Apps Market?
By Platform (Android, iOS), By Business Model (Free Apps (Ad-Supported), Paid Apps (Subscription-Based))
How can this market research report help my business make strategic decisions?
Our market research reports provide actionable intelligence, including verified market size data, CAGR projections, competitive benchmarking, and segment-level opportunity analysis. These insights support strategic planning, investment decisions, product development, and market entry strategies for enterprises and startups alike.
How frequently is the data updated?
We continuously monitor industry developments and update our reports to reflect regulatory changes, technological advancements, and macroeconomic shifts. Updated editions ensure you receive the latest market intelligence.