Mobility As A Service Maas Market Size, Growth, Share|CAGR of 18.71%
Global Mobility As A Service Maas Market Size, Share, Analysis Report By Service Type (Ride Hailing & Sharing, Public Transportation, Car Sharing & Rental, Bike & E-Scooter Sharing) Business Model (B2C, B2B, B2G) Transportation Mode (Multi-Modal Integration, Single-Mode Platforms, Micro-Mobility Focus) Application (Personal Mobility , Logistics Applications) Industry Region & Key Players-Industry Segment Overview, Market Dynamics, Competitive Strategies, Trends & Forecast 2025-2034
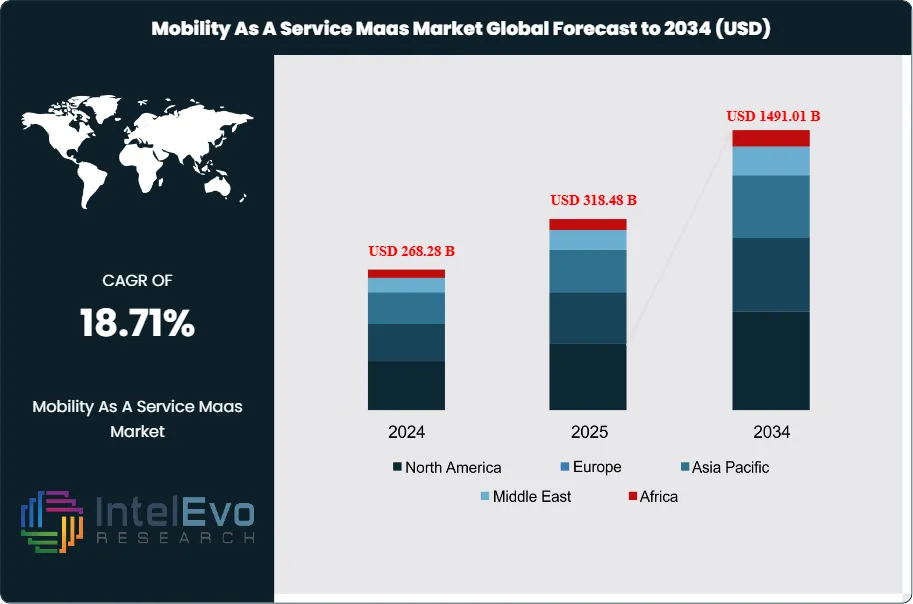
The Mobility As A Service Maas Market size is expected to be worth around USD 1491.01 Billion by 2034, from USD 268.28 Billion in 2024, growing at a CAGR of 18.71% during the forecast period from 2024 to 2034. Mobility as a Service (MaaS) represents an integrated digital platform that combines various transportation services into a single accessible on-demand service. MaaS platforms integrate public transit, ride-sharing, bike-sharing, car-sharing, e-scooters, and other mobility options through unified mobile applications, enabling users to plan, book, and pay for multimodal journeys. The market encompasses software platforms, hardware infrastructure, payment systems, and data analytics solutions that facilitate seamless urban mobility experiences across B2B, B2C, and B2G segments.
The MaaS market is driven by rapid urbanization, increasing traffic congestion, and growing environmental consciousness driving demand for sustainable transportation alternatives. Digital transformation initiatives, smartphone proliferation, and advances in IoT, AI, and big data analytics enable sophisticated mobility orchestration. Government initiatives promoting smart city development, carbon emission reduction targets, and public-private partnerships in transportation infrastructure further accelerate market adoption. The shift from vehicle ownership to access-based mobility models fundamentally transforms urban transportation ecosystems.
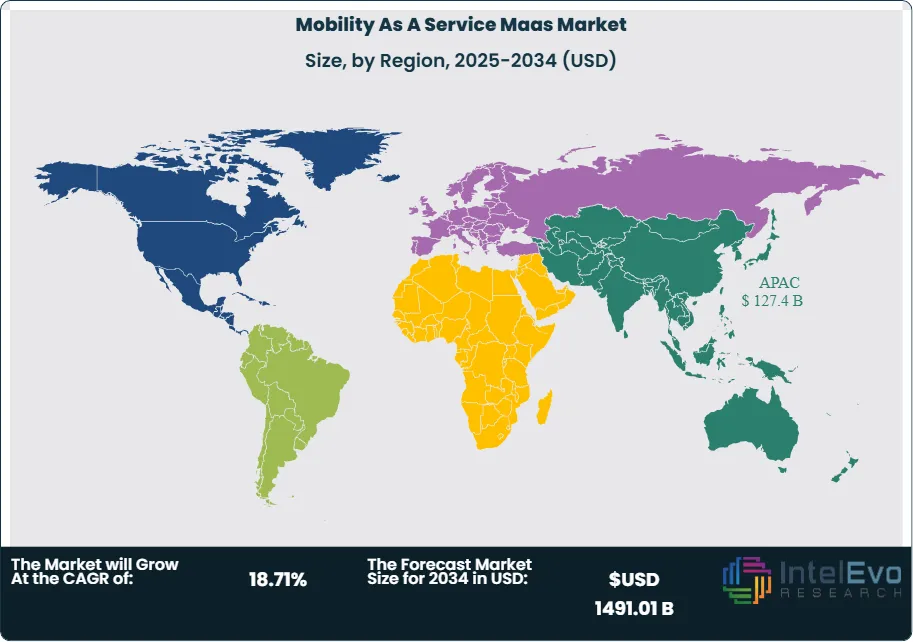
Europe leads the global MaaS market, driven by advanced public transportation infrastructure, supportive regulatory frameworks, and early adoption in cities like Helsinki, Stockholm, and Vienna. North America follows with strong growth in ride-sharing integration and smart city initiatives in major metropolitan areas. Asia-Pacific represents the fastest-growing region, fueled by rapid urbanization, smartphone penetration, and government investments in smart transportation in countries like Singapore, Japan, and South Korea. Latin America and Middle East & Africa show emerging potential through urban mobility challenges driving innovative solutions.
COVID-19 initially disrupted the MaaS market through reduced public transportation usage and social distancing requirements. However, the pandemic accelerated digital transformation in transportation, increased demand for contactless payment solutions, and highlighted the importance of flexible, on-demand mobility options. Post-pandemic recovery has seen renewed focus on sustainable transportation, health-conscious mobility choices, and integration of safety protocols into MaaS platforms, ultimately strengthening long-term market prospects.
Geopolitical tensions have affected technology supply chains and data privacy regulations, influencing MaaS platform development and deployment. Trade policies impact cross-border technology partnerships and component availability for smart transportation infrastructure. However, government stimulus packages for green recovery and smart city development have provided significant investment opportunities, while regional regulatory harmonization efforts facilitate MaaS platform scalability across borders.
Key Takeaways
Market Growth: The Mobility as a Service Maas Market is expected to reach USD 1491.01 Billion by 2034, driven by rapid urbanization, increasing traffic congestion, and the urgent need for sustainable transportation solutions.
ServiceTypeDominance: Ride hailing & sharing leads market share due to market maturity and established user familiarity.
BusinessModelDominance: B2C dominates, driven by direct consumer engagement and scalable revenue models.
TransportationModeDominance: Multi-modal integration leads, driven by comprehensive journey optimization and user preference for seamless experiences.
ApplicationDominance: Personal mobility applications dominate, owing to increasing consumer focus on personal transportation.
Driver: Urbanization & smart city development and sustainability consciousness accelerate growth through infrastructure investment and environmental awareness driving alternative transportation adoption.
Restraint: Integration complexity & regulatory challenges and high infrastructure costs create barriers through technical difficulties and significant capital requirements.
Opportunity: Emerging markets expansion and AI-powered optimization offer growth potential through untapped urban markets and enhanced efficiency through intelligent routing and demand prediction.
Trend: Autonomous vehicle integration and subscription-based models are reshaping the market by enabling future mobility paradigms and predictable revenue streams.
RegionalAnalysis: Asia-Pacific leads with significant share owing to massive urban population and advanced digital infrastructure.
Service Type Analysis:
Ride Hailing & Sharing maintains its dominant market position through established user behavior patterns, extensive geographic coverage, and mature platform ecosystems that have evolved over years of market presence. The segment's leadership stems from first-mover advantages in digital mobility transformation, comprehensive driver networks that ensure reliable service availability, and continuous technology innovation that enhances user experiences and operational efficiency. Public Transportation integration represents a significant secondary market segment, driven by government initiatives promoting sustainable mobility solutions and substantial infrastructure investments supporting multimodal transportation systems. This segment benefits from growing environmental consciousness among consumers and cost-effectiveness advantages for regular commuters seeking affordable daily transportation options.
Business Model Analysis:
B2C (Business-to-Consumer) Leads With over 50% Market Share In Mobility As A Service Maas Market. B2C Business Models maintain market leadership through direct consumer engagement strategies and scalable revenue generation models built on individual user transactions. This segment leverages network effects where increased user participation enhances service quality and availability for all participants, creating a self-reinforcing growth cycle. The model benefits from extensive data collection capabilities that enable detailed user behavior analysis, preferences tracking, and usage pattern identification, which inform strategic decision-making and service optimization. Personalized service delivery becomes possible through this data-driven approach, allowing platforms to customize experiences, recommendations, and pricing strategies to individual user needs and preferences.
Transportation Mode Analysis:
Multi-Modal Integration maintains market leadership through comprehensive journey optimization capabilities that seamlessly combine various transportation options within unified digital platforms. This approach delivers significant competitive differentiation by offering users complete end-to-end travel solutions that eliminate the complexity of coordinating multiple transportation services independently. The enhanced user value proposition stems from seamless intermodal transfers that enable smooth transitions between different transportation modes, reducing travel time, improving convenience, and providing cost-effective routing options that optimize for user preferences including time, cost, and environmental impact.
Application Analysis:
Personal Mobility Leads With more than 65% Market Share In Mobility As A Service Maas Market. Personal mobility applications maintain commanding market dominance, reflecting consumer-centric platform development strategies and evolving individual transportation preferences. This leadership position stems from significant urbanization trends, transforming lifestyle patterns, and the growing consumer preference for flexible transportation solutions that eliminate the need for traditional vehicle ownership. Personal mobility platforms excel by delivering comprehensive journey planning capabilities, real-time tracking systems, and seamlessly integrated payment solutions that resonate with modern consumer expectations for convenience and efficiency.
Region Analysis:
Asia-Pacific dominates the global MaaS market with the largest revenue share, driven by massive urban populations, advanced smartphone penetration, and supportive government policies. China leads regional growth through extensive platform ecosystems, substantial venture capital investments, and comprehensive smart city initiatives. Southeast Asian markets benefit from super-app development, integrating multiple services within single platforms to serve diverse mobility needs. North America maintains a significant market position with mature technological infrastructure, high disposable incomes, and established ride-hailing platforms. Europe follows closely with strong regulatory frameworks promoting sustainable transportation and extensive public transit integration capabilities. Latin America and Middle East Africa represent emerging markets with substantial growth potential driven by rapid urbanization, increasing smartphone adoption, and infrastructure development investments. Regional variations in regulatory approaches, infrastructure maturity, and consumer preferences create diverse market dynamics requiring localized platform strategies and service offerings.
Service Type (Ride Hailing & Sharing, Public Transportation, Car Sharing & Rental, Bike & E-Scooter Sharing); Business Model (B2C (Business-to-Consumer), B2B (Business-to-Business), B2G (Business-to-Government)); Transportation Mode (Multi-Modal Integration, Single-Mode Platforms, Micro-Mobility Focus); Application (Personal Mobility , Logistics Applications)
Research Methodology
Primary Research- 100 Interviews of Stakeholders
Secondary Research
Desk Research
Regional scope
North America (United States, Canada, Mexico)
Latin America (Brazil, Argentina, Columbia)
East Asia And Pacific (China, Japan, South Korea, Australia, Cambodia, Fiji, Indonesia)
Sea And South Asia (India, Singapore, Thailand, Taiwan, Malaysia)
Eastern Europe (Poland, Russia, Czech Republic, Romania)
Western Europe (Germany, U.K., France, Spain, Itlay)
Middle East & Africa (GCC Countries, Egypt, Nigeria, South Africa, Israel)
Competitive Landscape
Uber Technologies, Didi Chuxing, Lyft, Grab, Ola Cabs, Whim, Citymapper, Moovit, Via Transportation, FREE2MOVE, SkedGo, Zipcar, Bird/Lime, Gojek, Grab, BlaBlaCar.
Customization Scope
Customization for segments, region/country-level will be provided. Moreover, additional customization can be done based on the requirements.
Pricing and Purchase Options
Avail customized purchase options to meet your exact research needs. We have three licenses to opt for: Single User License, Multi-User License (Up to 5 Users), Corporate Use License (Unlimited User and Printable PDF).
TABLE OF CONTENTS
1. EXECUTIVE SUMMARY
1.1. MARKET SNAPSHOT
1.2. KEY FINDINGS & INSIGHTS
1.3. ANALYST RECOMMENDATIONS
1.4. FUTURE OUTLOOK
2. RESEARCH METHODOLOGY
2.1. MARKET DEFINITION & SCOPE
2.2. RESEARCH OBJECTIVES: PRIMARY & SECONDARY DATA SOURCES
2.3. DATA COLLECTION SOURCES
2.3.1. COVERAGE OF 100+ PRIMARY RESEARCH/CONSULTATION CALLS WITH INDUSTRY STAKEHOLDERS
FIGURE 17 NORTH AMERICA MOBILITY AS A SERVICE MAAS CURRENT AND FUTURE TYPE ANALYSIS, 2025–2034, (USD MILLION)
FIGURE 18 NORTH AMERICA MOBILITY AS A SERVICE MAAS CURRENT AND FUTURE END USER ANALYSIS, 2025–2034, (USD MILLION)
FIGURE 19 MARKET SHARE BY COUNTRY
FIGURE 20 LATIN AMERICA MOBILITY AS A SERVICE MAAS CURRENT AND FUTURE TYPE ANALYSIS, 2025–2034, (USD MILLION)
FIGURE 21 LATIN AMERICA MOBILITY AS A SERVICE MAAS CURRENT AND FUTURE END USER ANALYSIS, 2025–2034, (USD MILLION)
FIGURE 22 MARKET SHARE BY COUNTRY
FIGURE 23 EASTERN EUROPE MOBILITY AS A SERVICE MAAS CURRENT AND FUTURE TYPE ANALYSIS, 2025–2034, (USD MILLION)
FIGURE 24 EASTERN EUROPE MOBILITY AS A SERVICE MAAS CURRENT AND FUTURE END USER ANALYSIS, 2025–2034, (USD MILLION)
FIGURE 25 MARKET SHARE BY COUNTRY
FIGURE 26 WESTERN EUROPE MOBILITY AS A SERVICE MAAS CURRENT AND FUTURE TYPE ANALYSIS, 2025–2034, (USD MILLION)
FIGURE 27 WESTERN EUROPE MOBILITY AS A SERVICE MAAS CURRENT AND FUTURE END USER ANALYSIS, 2025–2034, (USD MILLION)
FIGURE 28 MARKET SHARE BY COUNTRY
FIGURE 29 EAST ASIA AND PACIFIC MOBILITY AS A SERVICE MAAS CURRENT AND FUTURE TYPE ANALYSIS, 2025–2034, (USD MILLION)
FIGURE 30 EAST ASIA AND PACIFIC MOBILITY AS A SERVICE MAAS CURRENT AND FUTURE END USER ANALYSIS, 2025–2034, (USD MILLION)
FIGURE 31 MARKET SHARE BY COUNTRY
FIGURE 32 SEA AND SOUTH ASIA MOBILITY AS A SERVICE MAAS CURRENT AND FUTURE TYPE ANALYSIS, 2025–2034, (USD MILLION)
FIGURE 33 SEA AND SOUTH ASIA MOBILITY AS A SERVICE MAAS CURRENT AND FUTURE END USER ANALYSIS, 2025–2034, (USD MILLION)
FIGURE 34 MARKET SHARE BY COUNTRY
FIGURE 35 MIDDLE EAST AND AFRICA MOBILITY AS A SERVICE MAAS CURRENT AND FUTURE TYPE ANALYSIS, 2025–2034, (USD MILLION)
FIGURE 36 MIDDLE EAST AND AFRICA MOBILITY AS A SERVICE MAAS CURRENT AND FUTURE END USER ANALYSIS, 2025–2034, (USD MILLION)
FIGURE 37 NORTH AMERICA MOBILITY AS A SERVICE MAAS CURRENT AND FUTURE MARKET VOLUME SHARE REGIONAL ANALYSIS, 2025–2034, (USD MILLION)
FIGURE 38 U.S. MOBILITY AS A SERVICE MAAS CURRENT AND FUTURE TYPE ANALYSIS, 2025–2034, (USD MILLION)
FIGURE 39 U.S. MOBILITY AS A SERVICE MAAS CURRENT AND FUTURE END USER ANALYSIS, 2025–2034, (USD MILLION)
FIGURE 40 CANADA MOBILITY AS A SERVICE MAAS CURRENT AND FUTURE TYPE ANALYSIS, 2025–2034, (USD MILLION)
FIGURE 41 CANADA MOBILITY AS A SERVICE MAAS CURRENT AND FUTURE END USER ANALYSIS, 2025–2034, (USD MILLION)
FIGURE 42 LATIN AMERICA MOBILITY AS A SERVICE MAAS CURRENT AND FUTURE MARKET VOLUME SHARE REGIONAL ANALYSIS, 2025–2034, (USD MILLION)
FIGURE 43 MEXICO MOBILITY AS A SERVICE MAAS CURRENT AND FUTURE TYPE ANALYSIS, 2025–2034, (USD MILLION)
FIGURE 44 MEXICO MOBILITY AS A SERVICE MAAS CURRENT AND FUTURE END USER ANALYSIS, 2025–2034, (USD MILLION)
FIGURE 45 BRAZIL MOBILITY AS A SERVICE MAAS CURRENT AND FUTURE TYPE ANALYSIS, 2025–2034, (USD MILLION)
FIGURE 46 BRAZIL MOBILITY AS A SERVICE MAAS CURRENT AND FUTURE END USER ANALYSIS, 2025–2034, (USD MILLION)
FIGURE 47 ARGENTINA MOBILITY AS A SERVICE MAAS CURRENT AND FUTURE TYPE ANALYSIS, 2025–2034, (USD MILLION)
FIGURE 48 ARGENTINA MOBILITY AS A SERVICE MAAS CURRENT AND FUTURE END USER ANALYSIS, 2025–2034, (USD MILLION)
FIGURE 49 COLUMBIA MOBILITY AS A SERVICE MAAS CURRENT AND FUTURE TYPE ANALYSIS, 2025–2034, (USD MILLION)
FIGURE 50 COLUMBIA MOBILITY AS A SERVICE MAAS CURRENT AND FUTURE END USER ANALYSIS, 2025–2034, (USD MILLION)
FIGURE 51 REST OF LATIN AMERICA MOBILITY AS A SERVICE MAAS CURRENT AND FUTURE TYPE ANALYSIS, 2025–2034, (USD MILLION)
FIGURE 52 REST OF LATIN AMERICA MOBILITY AS A SERVICE MAAS CURRENT AND FUTURE END USER ANALYSIS, 2025–2034, (USD MILLION)
FIGURE 53 EASTERN EUROPE MOBILITY AS A SERVICE MAAS CURRENT AND FUTURE MARKET VOLUME SHARE REGIONAL ANALYSIS, 2025–2034, (USD MILLION)
FIGURE 54 POLAND MOBILITY AS A SERVICE MAAS CURRENT AND FUTURE TYPE ANALYSIS, 2025–2034, (USD MILLION)
FIGURE 55 POLAND MOBILITY AS A SERVICE MAAS CURRENT AND FUTURE END USER ANALYSIS, 2025–2034, (USD MILLION)
FIGURE 56 RUSSIA MOBILITY AS A SERVICE MAAS CURRENT AND FUTURE TYPE ANALYSIS, 2025–2034, (USD MILLION)
FIGURE 57 RUSSIA MOBILITY AS A SERVICE MAAS CURRENT AND FUTURE END USER ANALYSIS, 2025–2034, (USD MILLION)
FIGURE 58 CZECH REPUBLIC MOBILITY AS A SERVICE MAAS CURRENT AND FUTURE TYPE ANALYSIS, 2025–2034, (USD MILLION)
FIGURE 59 CZECH REPUBLIC MOBILITY AS A SERVICE MAAS CURRENT AND FUTURE END USER ANALYSIS, 2025–2034, (USD MILLION)
FIGURE 60 ROMANIA MOBILITY AS A SERVICE MAAS CURRENT AND FUTURE TYPE ANALYSIS, 2025–2034, (USD MILLION)
FIGURE 61 ROMANIA MOBILITY AS A SERVICE MAAS CURRENT AND FUTURE END USER ANALYSIS, 2025–2034, (USD MILLION)
FIGURE 62 REST OF EASTERN EUROPE MOBILITY AS A SERVICE MAAS CURRENT AND FUTURE TYPE ANALYSIS, 2025–2034, (USD MILLION)
FIGURE 63 REST OF EASTERN EUROPE MOBILITY AS A SERVICE MAAS CURRENT AND FUTURE END USER ANALYSIS, 2025–2034, (USD MILLION)
FIGURE 64 WESTERN EUROPE MOBILITY AS A SERVICE MAAS CURRENT AND FUTURE MARKET VOLUME SHARE REGIONAL ANALYSIS, 2025–2034, (USD MILLION)
FIGURE 65 GERMANY MOBILITY AS A SERVICE MAAS CURRENT AND FUTURE TYPE ANALYSIS, 2025–2034, (USD MILLION)
FIGURE 66 GERMANY MOBILITY AS A SERVICE MAAS CURRENT AND FUTURE END USER ANALYSIS, 2025–2034, (USD MILLION)
FIGURE 67 FRANCE MOBILITY AS A SERVICE MAAS CURRENT AND FUTURE TYPE ANALYSIS, 2025–2034, (USD MILLION)
FIGURE 68 FRANCE MOBILITY AS A SERVICE MAAS CURRENT AND FUTURE END USER ANALYSIS, 2025–2034, (USD MILLION)
FIGURE 69 UK MOBILITY AS A SERVICE MAAS CURRENT AND FUTURE TYPE ANALYSIS, 2025–2034, (USD MILLION)
FIGURE 70 UK MOBILITY AS A SERVICE MAAS CURRENT AND FUTURE END USER ANALYSIS, 2025–2034, (USD MILLION)
FIGURE 71 SPAIN MOBILITY AS A SERVICE MAAS CURRENT AND FUTURE TYPE ANALYSIS, 2025–2034, (USD MILLION)
FIGURE 72 SPAIN MOBILITY AS A SERVICE MAAS CURRENT AND FUTURE END USER ANALYSIS, 2025–2034, (USD MILLION)
FIGURE 73 ITALY MOBILITY AS A SERVICE MAAS CURRENT AND FUTURE TYPE ANALYSIS, 2025–2034, (USD MILLION)
FIGURE 74 ITALY MOBILITY AS A SERVICE MAAS CURRENT AND FUTURE END USER ANALYSIS, 2025–2034, (USD MILLION)
FIGURE 75 REST OF WESTERN EUROPE MOBILITY AS A SERVICE MAAS CURRENT AND FUTURE TYPE ANALYSIS, 2025–2034, (USD MILLION)
FIGURE 76 REST OF WESTERN EUROPE MOBILITY AS A SERVICE MAAS CURRENT AND FUTURE END USER ANALYSIS, 2025–2034, (USD MILLION)
FIGURE 77 EAST ASIA AND PACIFIC MOBILITY AS A SERVICE MAAS CURRENT AND FUTURE MARKET VOLUME SHARE REGIONAL ANALYSIS, 2025–2034, (USD MILLION)
FIGURE 78 CHINA MOBILITY AS A SERVICE MAAS CURRENT AND FUTURE TYPE ANALYSIS, 2025–2034, (USD MILLION)
FIGURE 79 CHINA MOBILITY AS A SERVICE MAAS CURRENT AND FUTURE END USER ANALYSIS, 2025–2034, (USD MILLION)
FIGURE 80 JAPAN MOBILITY AS A SERVICE MAAS CURRENT AND FUTURE TYPE ANALYSIS, 2025–2034, (USD MILLION)
FIGURE 81 JAPAN MOBILITY AS A SERVICE MAAS CURRENT AND FUTURE END USER ANALYSIS, 2025–2034, (USD MILLION)
FIGURE 82 AUSTRALIA MOBILITY AS A SERVICE MAAS CURRENT AND FUTURE TYPE ANALYSIS, 2025–2034, (USD MILLION)
FIGURE 83 AUSTRALIA MOBILITY AS A SERVICE MAAS CURRENT AND FUTURE END USER ANALYSIS, 2025–2034, (USD MILLION)
FIGURE 84 CAMBODIA MOBILITY AS A SERVICE MAAS CURRENT AND FUTURE TYPE ANALYSIS, 2025–2034, (USD MILLION)
FIGURE 85 CAMBODIA MOBILITY AS A SERVICE MAAS CURRENT AND FUTURE END USER ANALYSIS, 2025–2034, (USD MILLION)
FIGURE 86 FIJI MOBILITY AS A SERVICE MAAS CURRENT AND FUTURE TYPE ANALYSIS, 2025–2034, (USD MILLION)
FIGURE 87 FIJI MOBILITY AS A SERVICE MAAS CURRENT AND FUTURE END USER ANALYSIS, 2025–2034, (USD MILLION)
FIGURE 88 INDONESIA MOBILITY AS A SERVICE MAAS CURRENT AND FUTURE TYPE ANALYSIS, 2025–2034, (USD MILLION)
FIGURE 89 INDONESIA MOBILITY AS A SERVICE MAAS CURRENT AND FUTURE END USER ANALYSIS, 2025–2034, (USD MILLION)
FIGURE 90 SOUTH KOREA MOBILITY AS A SERVICE MAAS CURRENT AND FUTURE TYPE ANALYSIS, 2025–2034, (USD MILLION)
FIGURE 91 SOUTH KOREA MOBILITY AS A SERVICE MAAS CURRENT AND FUTURE END USER ANALYSIS, 2025–2034, (USD MILLION)
FIGURE 92 REST OF EAST ASIA AND PACIFIC MOBILITY AS A SERVICE MAAS CURRENT AND FUTURE TYPE ANALYSIS, 2025–2034, (USD MILLION)
FIGURE 93 REST OF EAST ASIA AND PACIFIC MOBILITY AS A SERVICE MAAS CURRENT AND FUTURE END USER ANALYSIS, 2025–2034, (USD MILLION)
FIGURE 94 SEA AND SOUTH ASIA MOBILITY AS A SERVICE MAAS CURRENT AND FUTURE MARKET VOLUME SHARE REGIONAL ANALYSIS, 2025–2034, (USD MILLION)
FIGURE 95 BANGLADESH MOBILITY AS A SERVICE MAAS CURRENT AND FUTURE TYPE ANALYSIS, 2025–2034, (USD MILLION)
FIGURE 96 BANGLADESH MOBILITY AS A SERVICE MAAS CURRENT AND FUTURE END USER ANALYSIS, 2025–2034, (USD MILLION)
FIGURE 97 NEW ZEALAND MOBILITY AS A SERVICE MAAS CURRENT AND FUTURE TYPE ANALYSIS, 2025–2034, (USD MILLION)
FIGURE 98 NEW ZEALAND MOBILITY AS A SERVICE MAAS CURRENT AND FUTURE END USER ANALYSIS, 2025–2034, (USD MILLION)
FIGURE 99 INDIA MOBILITY AS A SERVICE MAAS CURRENT AND FUTURE TYPE ANALYSIS, 2025–2034, (USD MILLION)
FIGURE 100 INDIA MOBILITY AS A SERVICE MAAS CURRENT AND FUTURE END USER ANALYSIS, 2025–2034, (USD MILLION)
FIGURE 101 SINGAPORE MOBILITY AS A SERVICE MAAS CURRENT AND FUTURE TYPE ANALYSIS, 2025–2034, (USD MILLION)
FIGURE 102 SINGAPORE MOBILITY AS A SERVICE MAAS CURRENT AND FUTURE END USER ANALYSIS, 2025–2034, (USD MILLION)
FIGURE 103 THAILAND MOBILITY AS A SERVICE MAAS CURRENT AND FUTURE TYPE ANALYSIS, 2025–2034, (USD MILLION)
FIGURE 104 THAILAND MOBILITY AS A SERVICE MAAS CURRENT AND FUTURE END USER ANALYSIS, 2025–2034, (USD MILLION)
FIGURE 105 TAIWAN MOBILITY AS A SERVICE MAAS CURRENT AND FUTURE TYPE ANALYSIS, 2025–2034, (USD MILLION)
FIGURE 106 TAIWAN MOBILITY AS A SERVICE MAAS CURRENT AND FUTURE END USER ANALYSIS, 2025–2034, (USD MILLION)
FIGURE 107 MALAYSIA MOBILITY AS A SERVICE MAAS CURRENT AND FUTURE TYPE ANALYSIS, 2025–2034, (USD MILLION)
FIGURE 108 MALAYSIA MOBILITY AS A SERVICE MAAS CURRENT AND FUTURE END USER ANALYSIS, 2025–2034, (USD MILLION)
FIGURE 109 REST OF SEA AND SOUTH ASIA MOBILITY AS A SERVICE MAAS CURRENT AND FUTURE TYPE ANALYSIS, 2025–2034, (USD MILLION)
FIGURE 110 REST OF SEA AND SOUTH ASIA MOBILITY AS A SERVICE MAAS CURRENT AND FUTURE END USER ANALYSIS, 2025–2034, (USD MILLION)
FIGURE 111 MIDDLE EAST AND AFRICA MOBILITY AS A SERVICE MAAS CURRENT AND FUTURE MARKET VOLUME SHARE REGIONAL ANALYSIS, 2025–2034, (USD MILLION)
FIGURE 112 GCC COUNTRIES MOBILITY AS A SERVICE MAAS CURRENT AND FUTURE TYPE ANALYSIS, 2025–2034, (USD MILLION)
FIGURE 113 GCC COUNTRIES MOBILITY AS A SERVICE MAAS CURRENT AND FUTURE END USER ANALYSIS, 2025–2034, (USD MILLION)
FIGURE 114 SAUDI ARABIA MOBILITY AS A SERVICE MAAS CURRENT AND FUTURE TYPE ANALYSIS, 2025–2034, (USD MILLION)
FIGURE 115 SAUDI ARABIA MOBILITY AS A SERVICE MAAS CURRENT AND FUTURE END USER ANALYSIS, 2025–2034, (USD MILLION)
FIGURE 116 UAE MOBILITY AS A SERVICE MAAS CURRENT AND FUTURE TYPE ANALYSIS, 2025–2034, (USD MILLION)
FIGURE 117 UAE MOBILITY AS A SERVICE MAAS CURRENT AND FUTURE END USER ANALYSIS, 2025–2034, (USD MILLION)
FIGURE 118 BAHRAIN MOBILITY AS A SERVICE MAAS CURRENT AND FUTURE TYPE ANALYSIS, 2025–2034, (USD MILLION)
FIGURE 119 BAHRAIN MOBILITY AS A SERVICE MAAS CURRENT AND FUTURE END USER ANALYSIS, 2025–2034, (USD MILLION)
FIGURE 120 KUWAIT MOBILITY AS A SERVICE MAAS CURRENT AND FUTURE TYPE ANALYSIS, 2025–2034, (USD MILLION)
FIGURE 121 KUWAIT MOBILITY AS A SERVICE MAAS CURRENT AND FUTURE END USER ANALYSIS, 2025–2034, (USD MILLION)
FIGURE 122 OMAN MOBILITY AS A SERVICE MAAS CURRENT AND FUTURE TYPE ANALYSIS, 2025–2034, (USD MILLION)
FIGURE 123 OMAN MOBILITY AS A SERVICE MAAS CURRENT AND FUTURE END USER ANALYSIS, 2025–2034, (USD MILLION)
FIGURE 124 QATAR MOBILITY AS A SERVICE MAAS CURRENT AND FUTURE TYPE ANALYSIS, 2025–2034, (USD MILLION)
FIGURE 125 QATAR MOBILITY AS A SERVICE MAAS CURRENT AND FUTURE END USER ANALYSIS, 2025–2034, (USD MILLION)
FIGURE 126 EGYPT MOBILITY AS A SERVICE MAAS CURRENT AND FUTURE TYPE ANALYSIS, 2025–2034, (USD MILLION)
FIGURE 127 EGYPT MOBILITY AS A SERVICE MAAS CURRENT AND FUTURE END USER ANALYSIS, 2025–2034, (USD MILLION)
FIGURE 128 NIGERIA MOBILITY AS A SERVICE MAAS CURRENT AND FUTURE TYPE ANALYSIS, 2025–2034, (USD MILLION)
FIGURE 129 NIGERIA MOBILITY AS A SERVICE MAAS CURRENT AND FUTURE END USER ANALYSIS, 2025–2034, (USD MILLION)
FIGURE 130 SOUTH AFRICA MOBILITY AS A SERVICE MAAS CURRENT AND FUTURE TYPE ANALYSIS, 2025–2034, (USD MILLION)
FIGURE 131 SOUTH AFRICA MOBILITY AS A SERVICE MAAS CURRENT AND FUTURE END USER ANALYSIS, 2025–2034, (USD MILLION)
FIGURE 132 ISRAEL MOBILITY AS A SERVICE MAAS CURRENT AND FUTURE TYPE ANALYSIS, 2025–2034, (USD MILLION)
FIGURE 133 ISRAEL MOBILITY AS A SERVICE MAAS CURRENT AND FUTURE END USER ANALYSIS, 2025–2034, (USD MILLION)
FIGURE 134 REST OF MEA MOBILITY AS A SERVICE MAAS CURRENT AND FUTURE TYPE ANALYSIS, 2025–2034, (USD MILLION)
FIGURE 135 REST OF MEA MOBILITY AS A SERVICE MAAS CURRENT AND FUTURE END USER ANALYSIS, 2025–2034, (USD MILLION)
FIGURE 136 U. S. MARKET SHARE ANALYSIS BY TYPE (2024)
FIGURE 137 U. S. MARKET SHARE ANALYSIS BY END USER (2024)
FIGURE 138 CANADA MARKET SHARE ANALYSIS BY TYPE (2024)
FIGURE 139 CANADA MARKET SHARE ANALYSIS BY END USER (2024)
FIGURE 140 MEXICO MARKET SHARE ANALYSIS BY TYPE (2024)
FIGURE 141 MEXICO MARKET SHARE ANALYSIS BY END USER (2024)
FIGURE 142 CHINA MARKET SHARE ANALYSIS BY TYPE (2024)
FIGURE 143 CHINA MARKET SHARE ANALYSIS BY END USER (2024)
FIGURE 144 JAPAN MARKET SHARE ANALYSIS BY TYPE (2024)
FIGURE 145 JAPAN MARKET SHARE ANALYSIS BY END USER (2024)
FIGURE 146 INDIA MARKET SHARE ANALYSIS BY TYPE (2024)
FIGURE 147 INDIA MARKET SHARE ANALYSIS BY END USER (2024)
FIGURE 148 SOUTH KOREA MARKET SHARE ANALYSIS BY TYPE (2024)
FIGURE 149 SOUTH KOREA MARKET SHARE ANALYSIS BY END USER (2024)
FIGURE 150 SAUDI ARABIA MARKET SHARE ANALYSIS BY TYPE (2024)
FIGURE 151 SAUDI ARABIA MARKET SHARE ANALYSIS BY END USER (2024)
FIGURE 152 UAE MARKET SHARE ANALYSIS BY TYPE (2024)
FIGURE 153 UAE MARKET SHARE ANALYSIS BY END USER (2024)
FIGURE 154 EGYPT MARKET SHARE ANALYSIS BY TYPE (2024)
FIGURE 155 EGYPT MARKET SHARE ANALYSIS BY END USER (2024)
FIGURE 156 NIGERIA MARKET SHARE ANALYSIS BY TYPE (2024)
FIGURE 157 NIGERIA MARKET SHARE ANALYSIS BY END USER (2024)
FIGURE 158 SOUTH AFRICA MARKET SHARE ANALYSIS BY TYPE (2024)
FIGURE 159 SOUTH AFRICA MARKET SHARE ANALYSIS BY END USER (2024)
FIGURE 160 GERMANY MARKET SHARE ANALYSIS BY TYPE (2024)
FIGURE 161 GERMANY MARKET SHARE ANALYSIS BY END USER (2024)
FIGURE 162 FRANCE MARKET SHARE ANALYSIS BY TYPE (2024)
FIGURE 163 FRANCE MARKET SHARE ANALYSIS BY END USER (2024)
FIGURE 164 UK MARKET SHARE ANALYSIS BY TYPE (2024)
FIGURE 165 UK MARKET SHARE ANALYSIS BY END USER (2024)
FIGURE 166 SPAIN MARKET SHARE ANALYSIS BY TYPE (2024)
FIGURE 167 SPAIN MARKET SHARE ANALYSIS BY END USER (2024)
FIGURE 168 ITALY MARKET SHARE ANALYSIS BY TYPE (2024)
FIGURE 169 ITALY MARKET SHARE ANALYSIS BY END USER (2024)
FIGURE 170 BRAZIL MARKET SHARE ANALYSIS BY TYPE (2024)
FIGURE 171 BRAZIL MARKET SHARE ANALYSIS BY END USER (2024)
FIGURE 172 ARGENTINA MARKET SHARE ANALYSIS BY TYPE (2024)
FIGURE 173 ARGENTINA MARKET SHARE ANALYSIS BY END USER (2024)
FIGURE 174 COLUMBIA MARKET SHARE ANALYSIS BY TYPE (2024)
FIGURE 175 COLUMBIA MARKET SHARE ANALYSIS BY END USER (2024)
FIGURE 176 GLOBAL MOBILITY AS A SERVICE MAAS CURRENT AND FUTURE MARKET KEY COUNTRY LEVEL ANALYSIS, 2024–2034, (USD MILLION)
FIGURE 177 FINANCIAL OVERVIEW:
Key Players Analysis:
Uber Technologies Inc.: Uber maintains its position as a global market leader in the MaaS space with extensive international presence, diversified service offerings, and advanced technological capabilities. The company's platform spans ride-hailing, food delivery, freight services, and micro-mobility solutions, creating a comprehensive mobility ecosystem. Uber's competitive advantages include sophisticated algorithmic routing, dynamic pricing capabilities, and extensive driver and vehicle networks across numerous global markets. The company's continuous investment in autonomous vehicle development, electric vehicle partnerships, and platform expansion demonstrates strategic commitment to long-term market leadership. Uber's financial resources and technological expertise enable rapid market entry and service diversification.
Didi Chuxing Technology Co.: Didi Chuxing dominates the Asian MaaS market with particularly strong positions in China and expanding presence throughout Southeast Asia and other emerging markets. The company leverages deep local market knowledge, regulatory relationships, and tailored service offerings to maintain competitive advantages in complex Asian markets. Didi's super-app approach integrates multiple transportation and lifestyle services within a single platform, creating high user engagement and retention rates. The company's focus on technological innovation, including artificial intelligence and autonomous vehicle development, positions it for future growth opportunities. Strategic partnerships with local operators and government entities enable market expansion while navigating diverse regulatory environments.
Lyft Inc.: Lyft focuses primarily on the North American market with strong brand recognition, user loyalty, and differentiated service experiences that emphasize community engagement and social responsibility. The company's platform integration capabilities and partnerships with public transit systems create comprehensive urban mobility solutions. Lyft's commitment to electric vehicle adoption, driver support programs, and sustainable transportation initiatives appeals to environmentally conscious consumers and municipalities. The company's strategic focus on core markets enables deep market penetration and operational efficiency while maintaining service quality and user satisfaction.
Grab Holdings Limited: Grab operates as Southeast Asia's leading super-app platform, combining ride-hailing, food delivery, digital payments, and financial services within an integrated ecosystem. The company's localized approach addresses specific regional needs, cultural preferences, and regulatory requirements across diverse Southeast Asian markets. Grab's extensive service portfolio creates multiple revenue streams and high user engagement levels that support market leadership. Strategic partnerships with regional governments, financial institutions, and technology providers enable comprehensive service offerings and market expansion capabilities.
Ola Cabs (ANI Technologies): Ola Cabs leads the Indian MaaS market with extensive domestic coverage, localized service offerings, and deep understanding of Indian consumer preferences and market dynamics. The company's diverse vehicle categories, from auto-rickshaws to luxury cars, address varied transportation needs and price sensitivity levels. Ola's expansion into electric vehicles, micro-mobility solutions, and adjacent markets like food delivery demonstrates strategic growth initiatives. The company's technological capabilities and operational expertise enable efficient service delivery across India's complex and diverse transportation landscape.
Market Key Players
Uber Technologies
Didi Chuxing
Lyft
Grab
Ola Cabs
Whim
Citymapper
Moovit
Via Transportation
FREE2MOVE
SkedGo
Zipcar
Bird/Lime
Gojek
Grab
BlaBlaCar
Driver:
Urbanization & Smart City Development:
Rapid global urbanization, with over 68% of the world's population expected to live in cities by 2050, creates unprecedented demand for efficient, integrated transportation solutions. Urban congestion, limited parking availability, and environmental concerns drive cities to adopt comprehensive mobility strategies that reduce private vehicle dependency. Government investments in smart city infrastructure, IoT sensors, and digital platforms enable sophisticated traffic management and multimodal integration. Examples include Singapore's Smart Nation initiative, Barcelona's smart city program, and Amsterdam's comprehensive mobility strategy. These initiatives create favorable conditions for MaaS adoption through public-private partnerships, regulatory support, and infrastructure investments that facilitate seamless mobility experiences.
Growing environmental awareness and stringent government regulations targeting carbon emission reductions drive adoption of shared and sustainable transportation alternatives. Cities worldwide implement low-emission zones, congestion pricing, and carbon neutrality targets that favor integrated mobility solutions over private vehicle ownership. Corporate sustainability commitments and ESG requirements influence business travel policies and employee transportation programs. Electric vehicle integration, renewable energy adoption, and circular economy principles enhance MaaS platform attractiveness. The European Green Deal, California's emissions standards, and China's carbon neutrality goals create regulatory frameworks that accelerate sustainable mobility adoption and MaaS platform development.
Restrain:
Integration Complexity & Regulatory Challenges:
MaaS platforms face significant technical challenges integrating diverse transportation systems, payment methods, and data formats across multiple service providers. Regulatory fragmentation across jurisdictions creates compliance complexities, particularly for cross-border operations and data privacy requirements. Different transportation authorities maintain separate systems, standards, and protocols that resist integration efforts. Legacy infrastructure limitations, varying API capabilities, and data sharing restrictions impede seamless platform development. Regulatory uncertainty regarding liability, safety standards, and operating licenses creates investment hesitancy. The fragmented nature of urban transportation governance, with multiple stakeholders and competing interests, slows policy development and platform implementation.
High Infrastructure Costs & Digital Divide:
MaaS platform development requires significant upfront investments in technology infrastructure, system integration, and partnership agreements across multiple transportation providers. Smaller cities and developing regions lack the financial resources and technical capabilities necessary for comprehensive MaaS implementation. The digital divide affects user adoption, particularly among older demographics and lower-income populations who may lack smartphone access or digital literacy skills. Infrastructure maintenance costs, ongoing technology updates, and customer support requirements create sustained financial commitments. Rural and suburban areas face particular challenges due to limited transportation options, lower population density, and reduced economic viability for integrated mobility services.
Opportunities:
Emerging Markets Expansion:
Developing countries in Asia-Pacific, Latin America, and Africa present significant growth opportunities as urbanization accelerates and smartphone penetration increases. These markets often lack established transportation infrastructure, creating opportunities for leapfrogging to integrated digital mobility solutions. Growing middle-class populations, increasing environmental awareness, and government investments in smart city development create favorable conditions for MaaS adoption. Local partnerships with transportation providers, adaptation to regional mobility patterns, and culturally appropriate service designs enable market penetration. The addressable market in emerging economies exceeds $8 billion by 2030, with countries like India, Brazil, and Indonesia leading adoption. Mobile-first strategies and localized payment systems facilitate rapid user acquisition in these markets.
Artificial intelligence, machine learning, and predictive analytics enable unprecedented optimization of transportation networks, demand forecasting, and personalized service delivery. AI-powered routing algorithms, dynamic pricing models, and predictive maintenance capabilities enhance operational efficiency and user experiences. The integration of autonomous vehicles into MaaS platforms represents a transformative opportunity, enabling fully integrated, on-demand transportation ecosystems. Partnerships with AV manufacturers, technology development in edge computing, and regulatory engagement for autonomous transportation create competitive advantages.
Trends:
Autonomous Vehicle Integration & Future Mobility:
The gradual deployment of autonomous vehicles is reshaping MaaS platforms through integration of self-driving cars, shuttles, and delivery vehicles into comprehensive mobility ecosystems. AV integration enables 24/7 service availability, reduces operational costs, and expands service coverage to previously underserved areas. MaaS platforms are developing partnerships with autonomous vehicle manufacturers, testing integrated services in controlled environments, and preparing regulatory frameworks for widespread AV adoption. This trend transforms mobility from human-operated services to AI-orchestrated transportation networks, enabling unprecedented efficiency and accessibility. The timeline for significant AV integration spans 2025-2035, with early deployment in specific corridors and gradual expansion to comprehensive urban coverage.
Subscription-Based Models & Mobility Budgets:
The shift toward subscription-based MaaS offerings provides users with predictable monthly mobility budgets while ensuring stable revenue streams for platform operators. Corporate mobility allowances, government transportation vouchers, and family mobility plans create new market segments and pricing strategies. Subscription models enable better demand forecasting, user retention, and cross-selling opportunities across transportation modes. Integration with employer benefits, insurance products, and urban planning initiatives expands subscription model applications. This trend reflects broader economic shifts toward access-based consumption and predictable service pricing.
Recent Development
In February 2025: Uber has introduced Uber Saarthi, a groundbreaking private car rideshare service in Assam, marking the first initiative of its kind in India. This innovative service allows private vehicle owners to join the Uber platform and provide rides using their personal cars, representing a significant departure from traditional taxi operations that require commercially registered vehicles with yellow number plates.
In November 2024: May Mobility, a leading autonomous vehicle technology company, has established a comprehensive multi-year collaboration with Lyft, one of North America's largest transportation networks, to integrate autonomous vehicles directly into the Lyft platform. This groundbreaking partnership represents May Mobility's strategic entry into the ride-sharing industry and marks a significant milestone in the evolution of autonomous transportation services.
Frequently Asked Questions
How big is the Mobility As A Service Maas Market?
The MaaS Market is set to skyrocket from USD 268.28 Bn in 2024 to USD 1491.01 Bn by 2034, growing at a strong CAGR of 18.71% from 2024–2034.
Who are the major players in the Mobility As A Service Maas Market?
Uber Technologies, Didi Chuxing, Lyft, Grab, Ola Cabs, Whim, Citymapper, Moovit, Via Transportation, FREE2MOVE, SkedGo, Zipcar, Bird/Lime, Gojek, Grab, BlaBlaCar.
Which segments covered the Mobility As A Service Maas Market?
Service Type (Ride Hailing & Sharing, Public Transportation, Car Sharing & Rental, Bike & E-Scooter Sharing); Business Model (B2C (Business-to-Consumer), B2B (Business-to-Business), B2G (Business-to-Government)); Transportation Mode (Multi-Modal Integration, Single-Mode Platforms, Micro-Mobility Focus); Application (Personal Mobility , Logistics Applications)
How can this market research report help my business make strategic decisions?
Our market research reports provide actionable intelligence, including verified market size data, CAGR projections, competitive benchmarking, and segment-level opportunity analysis. These insights support strategic planning, investment decisions, product development, and market entry strategies for enterprises and startups alike.
How frequently is the data updated?
We continuously monitor industry developments and update our reports to reflect regulatory changes, technological advancements, and macroeconomic shifts. Updated editions ensure you receive the latest market intelligence.

 Aerospace And Defence
 Agriculture
 Automotive And Transportation
 Banking And Finance
 Business
 Chemicals And Materials
 Consumer And Retail
 Electronics And Semiconductors
 Food And Beverages
 Machinery & Equipments
 Manufacturing And Construction
 Medical Devices
 Others
 Pharmaceuticals And Healthcare
 Power And Energy
 Sports
 Technology

 Business Model (B2C, B2B, B2G) Transportation Mode (Multi-Modal Integration, Single-Mode Platforms, Micro-Mobility Focus) Application (Personal Mobility , Logistics Applications) Industry Region & Key Players-Industry Segment Overview, Market Dynamics, Competitive Strategies, Trends & Forecast 2025-2034")
 Business Model (B2C, B2B, B2G) Transportation Mode (Multi-Modal Integration, Single-Mode Platforms, Micro-Mobility Focus) Application (Personal Mobility , Logistics Applications) Industry Region & Key Players-Industry Segment Overview, Market Dynamics, Competitive Strategies, Trends & Forecast 2025-2034")
 Business Model (B2C, B2B, B2G) Transportation Mode (Multi-Modal Integration, Single-Mode Platforms, Micro-Mobility Focus) Application (Personal Mobility , Logistics Applications) Industry Region & Key Players-Industry Segment Overview, Market Dynamics, Competitive Strategies, Trends & Forecast 2025-2034")
 Business Model (B2C, B2B, B2G) Transportation Mode (Multi-Modal Integration, Single-Mode Platforms, Micro-Mobility Focus) Application (Personal Mobility , Logistics Applications) Industry Region & Key Players-Industry Segment Overview, Market Dynamics, Competitive Strategies, Trends & Forecast 2025-2034")

