Global Moringa Products Market Size, Share & Analysis By Product (Leaf Powder, Tea, Oil, Seeds), By Distribution Channel (Online, Offline) Industry Growth Drivers, Clean-Label Trends, Regional Outlook & Forecast 2025–2034
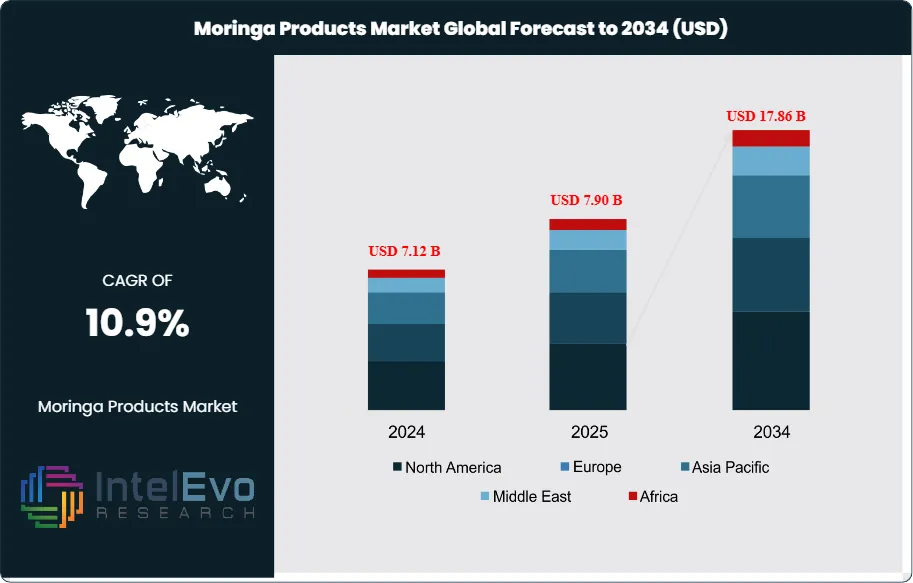
The Moringa Products Market was valued at approximately USD 7.12 Billion in 2024 and is projected to reach nearly USD 17.86 Billion by 2034, growing at an estimated CAGR of around 10.9% from 2025 to 2034. Rising demand for plant-based nutrition, clean-label supplements, and functional superfoods is accelerating global moringa adoption. With expanding applications across nutraceuticals, skincare, beverages, and fortified foods, moringa is emerging as a mainstream wellness powerhouse. Strong consumer interest in immunity-boosting and antioxidant-rich products continues to push market momentum worldwide.
The market’s expansion reflects the mainstreaming of moringa oleifera as a multifunctional “superfood” and bioactive ingredient across dietary supplements, functional foods, beauty, and wellness. After steady, mid-single-digit gains through the late 2010s, growth accelerated post-pandemic as consumers prioritized preventive health, clean labels, and plant-based nutrition; from 2024 to 2034 the sector is set to add approximately USD 7.4 billion in incremental revenue. Product portfolios have widened from traditional leaf powders into capsules, teas, fortified snacks, and seed-oil–based cosmetics, with an indicative 2024 mix of powders (≈45–50% of value), oils (≈20–25%), and finished nutraceutical formats (≈15–20%). Digitalization continues to reshape go-to-market dynamics, with online channels estimated to account for 35–40% of retail value sales, propelled by direct-to-consumer brands and subscription programs.
Demand-side momentum stems from rising supplement penetration (notably immunity, anti-inflammatory, and metabolic health claims), urbanization, and growing acceptance of botanicals as complementary therapies. On the supply side, expanded certified-organic acreage and improved post-harvest handling are lifting yields and consistency, although quality variability and adulteration remain industry pain points. Regulatory ambiguity—particularly around permissible claims and “novel food” classifications—poses compliance costs and time-to-market risks, while climate sensitivity in key producing belts introduces agronomic volatility.
Technological advances are enhancing efficacy and trust. Supercritical CO₂ extraction and membrane filtration are improving bioactive concentration and stability; microencapsulation extends shelf life and masks taste in functional beverages; AI-enabled agronomy and precision irrigation raise farm productivity by an estimated 10–15%; and blockchain-based traceability is gaining traction to verify origin, organic credentials, and fair-trade practices. Regionally, Asia Pacific leads supply, with industry estimates indicating India accounts for roughly two-thirds of global leaf-powder exports, while North America and Western Europe are consumption hotspots supported by premium retail and e-commerce. Africa and Latin America represent emerging investment corridors, combining favorable agro-climates with supportive value-addition policies. Looking ahead, vertical integration, certification-led premiumization, and clinically substantiated formulations are expected to underpin resilient high-single- to low-double-digit growth through 2034 despite regulatory and climate-related headwinds.
Key Takeaways
Market Growth: The global market reached USD 7.12 Billion in 2024 and is projected to hit USD 17.86 Billion by 2034 (CAGR 10.9%), adding ~USD 7.4 billion in incremental revenue as preventive health, clean-label nutrition, and organic remedies broaden consumer adoption.
Product Type: Leaf Powder leads with ~31% revenue share in 2024, buoyed by versatility across smoothies, capsules, teas, and bakery fortification and its favorable price-to-nutrition ratio versus concentrates and isolates.
Distribution Channel: Offline retail (supermarkets, pharmacies, specialty stores) accounts for ~68% of sales in 2024 due to product trust, pharmacist recommendation, and impulse purchasing, while online holds ~32% and is expanding at double-digit rates via DTC and subscription models.
Driver: Expanding use in dietary supplements and functional foods—supported by rising health awareness and the shift toward organic medication—remains the primary demand engine, with brands such as Organic India, Himalaya Wellness, and Moringa Connect accelerating SKU rollout and distribution reach.
Restraint: Regulatory variability and safety-driven restrictions in select markets (e.g., Brazil) constrain penetration and elevate compliance costs, often extending time-to-market by 6–12 months and necessitating enhanced testing and certification.
Opportunity: E-commerce scale-up presents the clearest upside; if online’s share rises from ~32% (2024) to ~45% by 2034, it could unlock ~USD 3–4 billion in incremental online sales, with premium, certified-organic and fair-trade offerings capturing disproportionate value.
Trend: Adoption of advanced extraction (e.g., supercritical CO₂), microencapsulation, and blockchain traceability is accelerating; early implementers report ~10–15% higher bioactive yields and improved stability, supporting clinically oriented claims and longer shelf life in beverages and ready-to-eat formats.
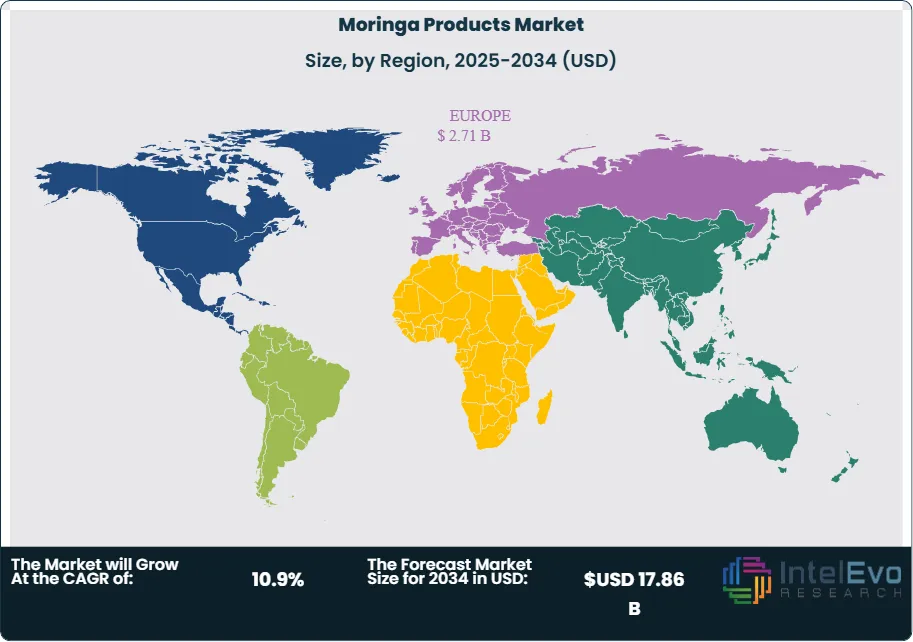
Regional Analysis: Europe leads with >38% revenue share on strong supplement demand and established retail channels; North America is a high-growth consumption hub underpinned by clean-label preferences; Asia Pacific remains the production backbone—with India supplying the majority of leaf powder exports—while Africa and Latin America are emerging investment corridors given favorable agro-climates and government support for value addition.
Product Analysis
Leaf powder remains the anchor of the category, accounting for just over 31% of global revenues in 2024 and retaining leadership into 2025 as brands standardize dosing and fortify blends with probiotics, collagen, and adaptogens. Its cost-effective nutrient density (vitamins A, C, E; amino acids; minerals) supports broad use across capsules, smoothies, bakery mixes, and ready-to-drink (RTD) formats, keeping share resilient at ~30–35% through the late 2020s despite portfolio diversification. Moringa tea continues to gain traction with wellness-oriented consumers seeking clean-label beverages; premium SKUs positioned around antioxidant content and caffeine-light energy are expanding shelf space in specialty retail and e-commerce, with mid-to-high single-digit volume growth expected annually through 2030.
Seed oil and seeds are emerging growth engines. Cold-pressed moringa (ben) oil is increasingly adopted in skin and hair care for emolliency and oxidative stability, with the beauty channel expected to post a 10–12% value CAGR over 2025–2034 as cosmeceutical claims and certified-organic lines scale. Seeds also support upstream value through oil extraction and niche applications in water clarification, offering suppliers margin diversity and opportunities for sustainability-linked branding.
Distribution Channel Analysis
Offline retail—supermarkets, pharmacies, and specialty health stores—captured roughly 68% of sales in 2024 and continues to dominate in 2025 where pharmacist recommendation, in-store education, and quality assurance drive conversion. Modern trade’s prominence persists in Europe and parts of Asia, where regulatory oversight and certification visibility (organic, fair trade) reinforce consumer trust and support premium price points.
Online channels, while smaller (~32% in 2024), are scaling faster via marketplaces and direct-to-consumer (DTC) subscriptions that lift repeat rates and average order value. As brands leverage content marketing, tele-nutrition, and loyalty programs, e-commerce’s share is projected to approach 40–45% by 2030, potentially unlocking USD 3–4 billion in incremental digital sales, particularly for clinically substantiated, traceable, and personalized formulations.
Regional Analysis
Europe held the largest revenue share (>38%) in 2024 and remains the leading consumption hub in 2025, supported by high supplement penetration, established pharmacy networks, and strong uptake of organic certifications. North America continues its rapid adoption curve—driven by clean-label preferences and weight-management positioning—with the U.S. accounting for ~76.5% of regional revenue in 2024 and sustaining above-market growth as RTD and gummy formats proliferate.
Asia Pacific is the production backbone and an increasingly important demand center. India remains the principal supplier of leaf powder exports, while China’s import demand and the region’s preference for plant-based cosmetics elevate oil throughput. Looking ahead, Africa and Latin America present compelling upstream and midstream opportunities—favorable agro-climates, rising smallholder aggregation, and incentives for local processing—positioning these regions as investment hotspots for vertically integrated, certification-led supply chains through 2034.
By Product (Leaf Powder, Tea, Oil, Seeds), By Distribution Channel (Online, Offline)
Research Methodology
Primary Research- 100 Interviews of Stakeholders
Secondary Research
Desk Research
Regional scope
North America (United States, Canada, Mexico)
Latin America (Brazil, Argentina, Columbia)
East Asia And Pacific (China, Japan, South Korea, Australia, Cambodia, Fiji, Indonesia)
Sea And South Asia (India, Singapore, Thailand, Taiwan, Malaysia)
Eastern Europe (Poland, Russia, Czech Republic, Romania)
Western Europe (Germany, U.K., France, Spain, Itlay)
Middle East & Africa (GCC Countries, Egypt, Nigeria, South Africa, Israel)
Competitive Landscape
Moringa Connect, Botanica Natural Products, Ayuritz and Mother Hubs, Veg India Exports, Moringa Initiative Ltd., Kuli Kuli Inc., Ancient Greenfields Pvt. Ltd. (AGF), Organic India Pvt. Ltd., Moringa Source LLC, Grenera Nutrients Pvt. Ltd., Aayuritz Phytonutrients Pvt. Ltd., Kanha Foods, Moringa Farms Inc., Green Virgin Products LLC
Customization Scope
Customization for segments, region/country-level will be provided. Moreover, additional customization can be done based on the requirements.
Pricing and Purchase Options
Avail customized purchase options to meet your exact research needs. We have three licenses to opt for: Single User License, Multi-User License (Up to 5 Users), Corporate Use License (Unlimited User and Printable PDF).
TABLE OF CONTENTS
1. EXECUTIVE SUMMARY
1.1. MARKET SNAPSHOT
1.2. KEY FINDINGS & INSIGHTS
1.3. ANALYST RECOMMENDATIONS
1.4. FUTURE OUTLOOK
2. RESEARCH METHODOLOGY
2.1. MARKET DEFINITION & SCOPE
2.2. RESEARCH OBJECTIVES: PRIMARY & SECONDARY DATA SOURCES
2.3. DATA COLLECTION SOURCES
2.3.1. COVERAGE OF 100+ PRIMARY RESEARCH/CONSULTATION CALLS WITH INDUSTRY STAKEHOLDERS
FIGURE 17 NORTH AMERICA MORINGA PRODUCTS CURRENT AND FUTURE TYPE ANALYSIS, 2025–2034, (USD MILLION)
FIGURE 18 NORTH AMERICA MORINGA PRODUCTS CURRENT AND FUTURE END USER ANALYSIS, 2025–2034, (USD MILLION)
FIGURE 19 MARKET SHARE BY COUNTRY
FIGURE 20 LATIN AMERICA MORINGA PRODUCTS CURRENT AND FUTURE TYPE ANALYSIS, 2025–2034, (USD MILLION)
FIGURE 21 LATIN AMERICA MORINGA PRODUCTS CURRENT AND FUTURE END USER ANALYSIS, 2025–2034, (USD MILLION)
FIGURE 22 MARKET SHARE BY COUNTRY
FIGURE 23 EASTERN EUROPE MORINGA PRODUCTS CURRENT AND FUTURE TYPE ANALYSIS, 2025–2034, (USD MILLION)
FIGURE 24 EASTERN EUROPE MORINGA PRODUCTS CURRENT AND FUTURE END USER ANALYSIS, 2025–2034, (USD MILLION)
FIGURE 25 MARKET SHARE BY COUNTRY
FIGURE 26 WESTERN EUROPE MORINGA PRODUCTS CURRENT AND FUTURE TYPE ANALYSIS, 2025–2034, (USD MILLION)
FIGURE 27 WESTERN EUROPE MORINGA PRODUCTS CURRENT AND FUTURE END USER ANALYSIS, 2025–2034, (USD MILLION)
FIGURE 28 MARKET SHARE BY COUNTRY
FIGURE 29 EAST ASIA AND PACIFIC MORINGA PRODUCTS CURRENT AND FUTURE TYPE ANALYSIS, 2025–2034, (USD MILLION)
FIGURE 30 EAST ASIA AND PACIFIC MORINGA PRODUCTS CURRENT AND FUTURE END USER ANALYSIS, 2025–2034, (USD MILLION)
FIGURE 31 MARKET SHARE BY COUNTRY
FIGURE 32 SEA AND SOUTH ASIA MORINGA PRODUCTS CURRENT AND FUTURE TYPE ANALYSIS, 2025–2034, (USD MILLION)
FIGURE 33 SEA AND SOUTH ASIA MORINGA PRODUCTS CURRENT AND FUTURE END USER ANALYSIS, 2025–2034, (USD MILLION)
FIGURE 34 MARKET SHARE BY COUNTRY
FIGURE 35 MIDDLE EAST AND AFRICA MORINGA PRODUCTS CURRENT AND FUTURE TYPE ANALYSIS, 2025–2034, (USD MILLION)
FIGURE 36 MIDDLE EAST AND AFRICA MORINGA PRODUCTS CURRENT AND FUTURE END USER ANALYSIS, 2025–2034, (USD MILLION)
FIGURE 37 NORTH AMERICA MORINGA PRODUCTS CURRENT AND FUTURE MARKET VOLUME SHARE REGIONAL ANALYSIS, 2025–2034, (USD MILLION)
FIGURE 38 U.S. MORINGA PRODUCTS CURRENT AND FUTURE TYPE ANALYSIS, 2025–2034, (USD MILLION)
FIGURE 39 U.S. MORINGA PRODUCTS CURRENT AND FUTURE END USER ANALYSIS, 2025–2034, (USD MILLION)
FIGURE 40 CANADA MORINGA PRODUCTS CURRENT AND FUTURE TYPE ANALYSIS, 2025–2034, (USD MILLION)
FIGURE 41 CANADA MORINGA PRODUCTS CURRENT AND FUTURE END USER ANALYSIS, 2025–2034, (USD MILLION)
FIGURE 42 LATIN AMERICA MORINGA PRODUCTS CURRENT AND FUTURE MARKET VOLUME SHARE REGIONAL ANALYSIS, 2025–2034, (USD MILLION)
FIGURE 43 MEXICO MORINGA PRODUCTS CURRENT AND FUTURE TYPE ANALYSIS, 2025–2034, (USD MILLION)
FIGURE 44 MEXICO MORINGA PRODUCTS CURRENT AND FUTURE END USER ANALYSIS, 2025–2034, (USD MILLION)
FIGURE 45 BRAZIL MORINGA PRODUCTS CURRENT AND FUTURE TYPE ANALYSIS, 2025–2034, (USD MILLION)
FIGURE 46 BRAZIL MORINGA PRODUCTS CURRENT AND FUTURE END USER ANALYSIS, 2025–2034, (USD MILLION)
FIGURE 47 ARGENTINA MORINGA PRODUCTS CURRENT AND FUTURE TYPE ANALYSIS, 2025–2034, (USD MILLION)
FIGURE 48 ARGENTINA MORINGA PRODUCTS CURRENT AND FUTURE END USER ANALYSIS, 2025–2034, (USD MILLION)
FIGURE 49 COLUMBIA MORINGA PRODUCTS CURRENT AND FUTURE TYPE ANALYSIS, 2025–2034, (USD MILLION)
FIGURE 50 COLUMBIA MORINGA PRODUCTS CURRENT AND FUTURE END USER ANALYSIS, 2025–2034, (USD MILLION)
FIGURE 51 REST OF LATIN AMERICA MORINGA PRODUCTS CURRENT AND FUTURE TYPE ANALYSIS, 2025–2034, (USD MILLION)
FIGURE 52 REST OF LATIN AMERICA MORINGA PRODUCTS CURRENT AND FUTURE END USER ANALYSIS, 2025–2034, (USD MILLION)
FIGURE 53 EASTERN EUROPE MORINGA PRODUCTS CURRENT AND FUTURE MARKET VOLUME SHARE REGIONAL ANALYSIS, 2025–2034, (USD MILLION)
FIGURE 54 POLAND MORINGA PRODUCTS CURRENT AND FUTURE TYPE ANALYSIS, 2025–2034, (USD MILLION)
FIGURE 55 POLAND MORINGA PRODUCTS CURRENT AND FUTURE END USER ANALYSIS, 2025–2034, (USD MILLION)
FIGURE 56 RUSSIA MORINGA PRODUCTS CURRENT AND FUTURE TYPE ANALYSIS, 2025–2034, (USD MILLION)
FIGURE 57 RUSSIA MORINGA PRODUCTS CURRENT AND FUTURE END USER ANALYSIS, 2025–2034, (USD MILLION)
FIGURE 58 CZECH REPUBLIC MORINGA PRODUCTS CURRENT AND FUTURE TYPE ANALYSIS, 2025–2034, (USD MILLION)
FIGURE 59 CZECH REPUBLIC MORINGA PRODUCTS CURRENT AND FUTURE END USER ANALYSIS, 2025–2034, (USD MILLION)
FIGURE 60 ROMANIA MORINGA PRODUCTS CURRENT AND FUTURE TYPE ANALYSIS, 2025–2034, (USD MILLION)
FIGURE 61 ROMANIA MORINGA PRODUCTS CURRENT AND FUTURE END USER ANALYSIS, 2025–2034, (USD MILLION)
FIGURE 62 REST OF EASTERN EUROPE MORINGA PRODUCTS CURRENT AND FUTURE TYPE ANALYSIS, 2025–2034, (USD MILLION)
FIGURE 63 REST OF EASTERN EUROPE MORINGA PRODUCTS CURRENT AND FUTURE END USER ANALYSIS, 2025–2034, (USD MILLION)
FIGURE 64 WESTERN EUROPE MORINGA PRODUCTS CURRENT AND FUTURE MARKET VOLUME SHARE REGIONAL ANALYSIS, 2025–2034, (USD MILLION)
FIGURE 65 GERMANY MORINGA PRODUCTS CURRENT AND FUTURE TYPE ANALYSIS, 2025–2034, (USD MILLION)
FIGURE 66 GERMANY MORINGA PRODUCTS CURRENT AND FUTURE END USER ANALYSIS, 2025–2034, (USD MILLION)
FIGURE 67 FRANCE MORINGA PRODUCTS CURRENT AND FUTURE TYPE ANALYSIS, 2025–2034, (USD MILLION)
FIGURE 68 FRANCE MORINGA PRODUCTS CURRENT AND FUTURE END USER ANALYSIS, 2025–2034, (USD MILLION)
FIGURE 69 UK MORINGA PRODUCTS CURRENT AND FUTURE TYPE ANALYSIS, 2025–2034, (USD MILLION)
FIGURE 70 UK MORINGA PRODUCTS CURRENT AND FUTURE END USER ANALYSIS, 2025–2034, (USD MILLION)
FIGURE 71 SPAIN MORINGA PRODUCTS CURRENT AND FUTURE TYPE ANALYSIS, 2025–2034, (USD MILLION)
FIGURE 72 SPAIN MORINGA PRODUCTS CURRENT AND FUTURE END USER ANALYSIS, 2025–2034, (USD MILLION)
FIGURE 73 ITALY MORINGA PRODUCTS CURRENT AND FUTURE TYPE ANALYSIS, 2025–2034, (USD MILLION)
FIGURE 74 ITALY MORINGA PRODUCTS CURRENT AND FUTURE END USER ANALYSIS, 2025–2034, (USD MILLION)
FIGURE 75 REST OF WESTERN EUROPE MORINGA PRODUCTS CURRENT AND FUTURE TYPE ANALYSIS, 2025–2034, (USD MILLION)
FIGURE 76 REST OF WESTERN EUROPE MORINGA PRODUCTS CURRENT AND FUTURE END USER ANALYSIS, 2025–2034, (USD MILLION)
FIGURE 77 EAST ASIA AND PACIFIC MORINGA PRODUCTS CURRENT AND FUTURE MARKET VOLUME SHARE REGIONAL ANALYSIS, 2025–2034, (USD MILLION)
FIGURE 78 CHINA MORINGA PRODUCTS CURRENT AND FUTURE TYPE ANALYSIS, 2025–2034, (USD MILLION)
FIGURE 79 CHINA MORINGA PRODUCTS CURRENT AND FUTURE END USER ANALYSIS, 2025–2034, (USD MILLION)
FIGURE 80 JAPAN MORINGA PRODUCTS CURRENT AND FUTURE TYPE ANALYSIS, 2025–2034, (USD MILLION)
FIGURE 81 JAPAN MORINGA PRODUCTS CURRENT AND FUTURE END USER ANALYSIS, 2025–2034, (USD MILLION)
FIGURE 82 AUSTRALIA MORINGA PRODUCTS CURRENT AND FUTURE TYPE ANALYSIS, 2025–2034, (USD MILLION)
FIGURE 83 AUSTRALIA MORINGA PRODUCTS CURRENT AND FUTURE END USER ANALYSIS, 2025–2034, (USD MILLION)
FIGURE 84 CAMBODIA MORINGA PRODUCTS CURRENT AND FUTURE TYPE ANALYSIS, 2025–2034, (USD MILLION)
FIGURE 85 CAMBODIA MORINGA PRODUCTS CURRENT AND FUTURE END USER ANALYSIS, 2025–2034, (USD MILLION)
FIGURE 86 FIJI MORINGA PRODUCTS CURRENT AND FUTURE TYPE ANALYSIS, 2025–2034, (USD MILLION)
FIGURE 87 FIJI MORINGA PRODUCTS CURRENT AND FUTURE END USER ANALYSIS, 2025–2034, (USD MILLION)
FIGURE 88 INDONESIA MORINGA PRODUCTS CURRENT AND FUTURE TYPE ANALYSIS, 2025–2034, (USD MILLION)
FIGURE 89 INDONESIA MORINGA PRODUCTS CURRENT AND FUTURE END USER ANALYSIS, 2025–2034, (USD MILLION)
FIGURE 90 SOUTH KOREA MORINGA PRODUCTS CURRENT AND FUTURE TYPE ANALYSIS, 2025–2034, (USD MILLION)
FIGURE 91 SOUTH KOREA MORINGA PRODUCTS CURRENT AND FUTURE END USER ANALYSIS, 2025–2034, (USD MILLION)
FIGURE 92 REST OF EAST ASIA AND PACIFIC MORINGA PRODUCTS CURRENT AND FUTURE TYPE ANALYSIS, 2025–2034, (USD MILLION)
FIGURE 93 REST OF EAST ASIA AND PACIFIC MORINGA PRODUCTS CURRENT AND FUTURE END USER ANALYSIS, 2025–2034, (USD MILLION)
FIGURE 94 SEA AND SOUTH ASIA MORINGA PRODUCTS CURRENT AND FUTURE MARKET VOLUME SHARE REGIONAL ANALYSIS, 2025–2034, (USD MILLION)
FIGURE 95 BANGLADESH MORINGA PRODUCTS CURRENT AND FUTURE TYPE ANALYSIS, 2025–2034, (USD MILLION)
FIGURE 96 BANGLADESH MORINGA PRODUCTS CURRENT AND FUTURE END USER ANALYSIS, 2025–2034, (USD MILLION)
FIGURE 97 NEW ZEALAND MORINGA PRODUCTS CURRENT AND FUTURE TYPE ANALYSIS, 2025–2034, (USD MILLION)
FIGURE 98 NEW ZEALAND MORINGA PRODUCTS CURRENT AND FUTURE END USER ANALYSIS, 2025–2034, (USD MILLION)
FIGURE 99 INDIA MORINGA PRODUCTS CURRENT AND FUTURE TYPE ANALYSIS, 2025–2034, (USD MILLION)
FIGURE 100 INDIA MORINGA PRODUCTS CURRENT AND FUTURE END USER ANALYSIS, 2025–2034, (USD MILLION)
FIGURE 101 SINGAPORE MORINGA PRODUCTS CURRENT AND FUTURE TYPE ANALYSIS, 2025–2034, (USD MILLION)
FIGURE 102 SINGAPORE MORINGA PRODUCTS CURRENT AND FUTURE END USER ANALYSIS, 2025–2034, (USD MILLION)
FIGURE 103 THAILAND MORINGA PRODUCTS CURRENT AND FUTURE TYPE ANALYSIS, 2025–2034, (USD MILLION)
FIGURE 104 THAILAND MORINGA PRODUCTS CURRENT AND FUTURE END USER ANALYSIS, 2025–2034, (USD MILLION)
FIGURE 105 TAIWAN MORINGA PRODUCTS CURRENT AND FUTURE TYPE ANALYSIS, 2025–2034, (USD MILLION)
FIGURE 106 TAIWAN MORINGA PRODUCTS CURRENT AND FUTURE END USER ANALYSIS, 2025–2034, (USD MILLION)
FIGURE 107 MALAYSIA MORINGA PRODUCTS CURRENT AND FUTURE TYPE ANALYSIS, 2025–2034, (USD MILLION)
FIGURE 108 MALAYSIA MORINGA PRODUCTS CURRENT AND FUTURE END USER ANALYSIS, 2025–2034, (USD MILLION)
FIGURE 109 REST OF SEA AND SOUTH ASIA MORINGA PRODUCTS CURRENT AND FUTURE TYPE ANALYSIS, 2025–2034, (USD MILLION)
FIGURE 110 REST OF SEA AND SOUTH ASIA MORINGA PRODUCTS CURRENT AND FUTURE END USER ANALYSIS, 2025–2034, (USD MILLION)
FIGURE 111 MIDDLE EAST AND AFRICA MORINGA PRODUCTS CURRENT AND FUTURE MARKET VOLUME SHARE REGIONAL ANALYSIS, 2025–2034, (USD MILLION)
FIGURE 112 GCC COUNTRIES MORINGA PRODUCTS CURRENT AND FUTURE TYPE ANALYSIS, 2025–2034, (USD MILLION)
FIGURE 113 GCC COUNTRIES MORINGA PRODUCTS CURRENT AND FUTURE END USER ANALYSIS, 2025–2034, (USD MILLION)
FIGURE 114 SAUDI ARABIA MORINGA PRODUCTS CURRENT AND FUTURE TYPE ANALYSIS, 2025–2034, (USD MILLION)
FIGURE 115 SAUDI ARABIA MORINGA PRODUCTS CURRENT AND FUTURE END USER ANALYSIS, 2025–2034, (USD MILLION)
FIGURE 116 UAE MORINGA PRODUCTS CURRENT AND FUTURE TYPE ANALYSIS, 2025–2034, (USD MILLION)
FIGURE 117 UAE MORINGA PRODUCTS CURRENT AND FUTURE END USER ANALYSIS, 2025–2034, (USD MILLION)
FIGURE 118 BAHRAIN MORINGA PRODUCTS CURRENT AND FUTURE TYPE ANALYSIS, 2025–2034, (USD MILLION)
FIGURE 119 BAHRAIN MORINGA PRODUCTS CURRENT AND FUTURE END USER ANALYSIS, 2025–2034, (USD MILLION)
FIGURE 120 KUWAIT MORINGA PRODUCTS CURRENT AND FUTURE TYPE ANALYSIS, 2025–2034, (USD MILLION)
FIGURE 121 KUWAIT MORINGA PRODUCTS CURRENT AND FUTURE END USER ANALYSIS, 2025–2034, (USD MILLION)
FIGURE 122 OMAN MORINGA PRODUCTS CURRENT AND FUTURE TYPE ANALYSIS, 2025–2034, (USD MILLION)
FIGURE 123 OMAN MORINGA PRODUCTS CURRENT AND FUTURE END USER ANALYSIS, 2025–2034, (USD MILLION)
FIGURE 124 QATAR MORINGA PRODUCTS CURRENT AND FUTURE TYPE ANALYSIS, 2025–2034, (USD MILLION)
FIGURE 125 QATAR MORINGA PRODUCTS CURRENT AND FUTURE END USER ANALYSIS, 2025–2034, (USD MILLION)
FIGURE 126 EGYPT MORINGA PRODUCTS CURRENT AND FUTURE TYPE ANALYSIS, 2025–2034, (USD MILLION)
FIGURE 127 EGYPT MORINGA PRODUCTS CURRENT AND FUTURE END USER ANALYSIS, 2025–2034, (USD MILLION)
FIGURE 128 NIGERIA MORINGA PRODUCTS CURRENT AND FUTURE TYPE ANALYSIS, 2025–2034, (USD MILLION)
FIGURE 129 NIGERIA MORINGA PRODUCTS CURRENT AND FUTURE END USER ANALYSIS, 2025–2034, (USD MILLION)
FIGURE 130 SOUTH AFRICA MORINGA PRODUCTS CURRENT AND FUTURE TYPE ANALYSIS, 2025–2034, (USD MILLION)
FIGURE 131 SOUTH AFRICA MORINGA PRODUCTS CURRENT AND FUTURE END USER ANALYSIS, 2025–2034, (USD MILLION)
FIGURE 132 ISRAEL MORINGA PRODUCTS CURRENT AND FUTURE TYPE ANALYSIS, 2025–2034, (USD MILLION)
FIGURE 133 ISRAEL MORINGA PRODUCTS CURRENT AND FUTURE END USER ANALYSIS, 2025–2034, (USD MILLION)
FIGURE 134 REST OF MEA MORINGA PRODUCTS CURRENT AND FUTURE TYPE ANALYSIS, 2025–2034, (USD MILLION)
FIGURE 135 REST OF MEA MORINGA PRODUCTS CURRENT AND FUTURE END USER ANALYSIS, 2025–2034, (USD MILLION)
FIGURE 136 U. S. MARKET SHARE ANALYSIS BY TYPE (2024)
FIGURE 137 U. S. MARKET SHARE ANALYSIS BY END USER (2024)
FIGURE 138 CANADA MARKET SHARE ANALYSIS BY TYPE (2024)
FIGURE 139 CANADA MARKET SHARE ANALYSIS BY END USER (2024)
FIGURE 140 MEXICO MARKET SHARE ANALYSIS BY TYPE (2024)
FIGURE 141 MEXICO MARKET SHARE ANALYSIS BY END USER (2024)
FIGURE 142 CHINA MARKET SHARE ANALYSIS BY TYPE (2024)
FIGURE 143 CHINA MARKET SHARE ANALYSIS BY END USER (2024)
FIGURE 144 JAPAN MARKET SHARE ANALYSIS BY TYPE (2024)
FIGURE 145 JAPAN MARKET SHARE ANALYSIS BY END USER (2024)
FIGURE 146 INDIA MARKET SHARE ANALYSIS BY TYPE (2024)
FIGURE 147 INDIA MARKET SHARE ANALYSIS BY END USER (2024)
FIGURE 148 SOUTH KOREA MARKET SHARE ANALYSIS BY TYPE (2024)
FIGURE 149 SOUTH KOREA MARKET SHARE ANALYSIS BY END USER (2024)
FIGURE 150 SAUDI ARABIA MARKET SHARE ANALYSIS BY TYPE (2024)
FIGURE 151 SAUDI ARABIA MARKET SHARE ANALYSIS BY END USER (2024)
FIGURE 152 UAE MARKET SHARE ANALYSIS BY TYPE (2024)
FIGURE 153 UAE MARKET SHARE ANALYSIS BY END USER (2024)
FIGURE 154 EGYPT MARKET SHARE ANALYSIS BY TYPE (2024)
FIGURE 155 EGYPT MARKET SHARE ANALYSIS BY END USER (2024)
FIGURE 156 NIGERIA MARKET SHARE ANALYSIS BY TYPE (2024)
FIGURE 157 NIGERIA MARKET SHARE ANALYSIS BY END USER (2024)
FIGURE 158 SOUTH AFRICA MARKET SHARE ANALYSIS BY TYPE (2024)
FIGURE 159 SOUTH AFRICA MARKET SHARE ANALYSIS BY END USER (2024)
FIGURE 160 GERMANY MARKET SHARE ANALYSIS BY TYPE (2024)
FIGURE 161 GERMANY MARKET SHARE ANALYSIS BY END USER (2024)
FIGURE 162 FRANCE MARKET SHARE ANALYSIS BY TYPE (2024)
FIGURE 163 FRANCE MARKET SHARE ANALYSIS BY END USER (2024)
FIGURE 164 UK MARKET SHARE ANALYSIS BY TYPE (2024)
FIGURE 165 UK MARKET SHARE ANALYSIS BY END USER (2024)
FIGURE 166 SPAIN MARKET SHARE ANALYSIS BY TYPE (2024)
FIGURE 167 SPAIN MARKET SHARE ANALYSIS BY END USER (2024)
FIGURE 168 ITALY MARKET SHARE ANALYSIS BY TYPE (2024)
FIGURE 169 ITALY MARKET SHARE ANALYSIS BY END USER (2024)
FIGURE 170 BRAZIL MARKET SHARE ANALYSIS BY TYPE (2024)
FIGURE 171 BRAZIL MARKET SHARE ANALYSIS BY END USER (2024)
FIGURE 172 ARGENTINA MARKET SHARE ANALYSIS BY TYPE (2024)
FIGURE 173 ARGENTINA MARKET SHARE ANALYSIS BY END USER (2024)
FIGURE 174 COLUMBIA MARKET SHARE ANALYSIS BY TYPE (2024)
FIGURE 175 COLUMBIA MARKET SHARE ANALYSIS BY END USER (2024)
FIGURE 176 GLOBAL MORINGA PRODUCTS CURRENT AND FUTURE MARKET KEY COUNTRY LEVEL ANALYSIS, 2024–2034, (USD MILLION)
FIGURE 177 FINANCIAL OVERVIEW:
Key Player Analysis
Veg India Exports: Positioned as a leader in B2B moringa supply, Veg India Exports focuses on bulk leaf powder, tea-cut leaves, and cold-pressed seed (ben) oil for nutraceutical, F&B, and cosmetics customers. As of 2025, the company is estimated to command 4–6% of global leaf-powder exports, supported by multi-origin sourcing in India and long-term contracts with European and North American buyers. Core certifications (FSSC 22000, ISO 22000, and multi-market organic labels) underpin access to pharmacy and specialty retail channels. Recent investments include a low-temperature dehydration line and supercritical CO₂ oil extraction, lifting bioactive retention and enabling premium pricing.
Strategically, Veg India Exports is expanding value-added formats (granulated powders, microencapsulated premixes) and deploying AI-enabled demand planning to reduce stockouts and working-capital cycles. Export revenues grew at an estimated 12–15% CAGR (2022–2025), with digital traceability (farm-to-batch QR codes) emerging as a key differentiator for EU “novel food” compliance and retailer audits.
Ayuritz and Mother Hubs: Operating as challengers/innovators in India’s wellness ecosystem, Ayuritz and Mother Hubs emphasize D2C moringa capsules, blends (moringa + ashwagandha/spirulina), functional teas, and gummies. By 2025, online contributes ~60–70% of unit sales, with marketplace listings and subscription models driving repeat purchase. The brands differentiate on value-for-money SKUs and clinically oriented claims, supported by third-party testing and clean-label positioning.
Strategic priorities include pharmacy partnerships in Tier-2/3 cities, co-packing for export private labels, and microencapsulation to improve solubility in RTD beverages. Management targets a 20–25% revenue CAGR through 2028, aided by influencer-led education, tele-nutrition programs, and a widening mid-premium assortment. Low return rates and rising average order values suggest improving unit economics and marketing efficiency.
Organic India: A brand leader in premium moringa teas and supplements, Organic India leverages a deep regenerative-organic grower network and broad distribution across natural/specialty retail in the US, EU, and India. The company’s portfolio spans moringa leaf capsules, green blends, and botanical tea infusions, with exports estimated to contribute ~55–60% of segment revenue by 2025. Its differentiation rests on third-party certifications (USDA/EU Organic, Fair Trade), consumer trust, and category-building content.
Strategic initiatives emphasize sustainability and clinical credibility: regenerative agriculture programs with smallholders, pilot blockchain traceability for high-volume SKUs, and selective R&D on bioavailability and synergistic blends (e.g., moringa + turmeric/black pepper). With e-commerce subscriptions and pharmacy channels scaling, the moringa line is tracking a ~10–12% value CAGR (2025–2030), reinforcing pricing power and shelf productivity.
Botanica Natural Products: Positioned as an innovator/niche player in the MEA supply chain, Botanica Natural Products specializes in ethically sourced cold-pressed moringa oil for cosmetics and personal care, alongside select leaf derivatives for formulators. The company’s edge lies in origin-based storytelling, COSMOS/Ecocert pathways, and transparent community procurement frameworks that resonate with clean-beauty brands seeking verified African botanicals.
In 2025, Botanica is scaling refinery and QC capabilities to meet tighter peroxide/FFA specs for prestige skincare, while pursuing long-term offtake agreements with EU and US indie brands. Estimated export revenues have grown ~18–20% CAGR since 2022, supported by stable oil chemistry, smallholder aggregation, and near-farm processing that lowers logistics costs and carbon intensity. The firm’s sustainability metrics and traceability documentation are key differentiators in a segment increasingly scrutinized for ESG performance.
Additional notable players include Kuli Kuli (US, consumer brand focus), True Moringa by Moringa Connect (Ghana/US, fair-trade oil and finished goods), and AGF/Ancient Greenfields (India, bulk processing and private label). Each is advancing digital retail, clinical substantiation, and vertically integrated sourcing to capture share in premium, certified, and traceable moringa offerings.
Market Key Players
Moringa Connect
Botanica Natural Products
Ayuritz and Mother Hubs
Veg India Exports
Moringa Initiative Ltd.
Kuli Kuli Inc.
Ancient Greenfields Pvt. Ltd. (AGF)
Organic India Pvt. Ltd.
Moringa Source LLC
Grenera Nutrients Pvt. Ltd.
Aayuritz Phytonutrients Pvt. Ltd.
Kanha Foods
Moringa Farms Inc.
Green Virgin Products LLC
Driver:
Health and Wellness Momentum Driving Strong Growth in Moringa Products
As of 2025, the moringa products category has scaled to roughly USD 6.6 billion, propelled by preventive-health spending and the migration of botanicals from niche to mainstream formats. Supplement penetration continues to deepen in North America and Europe, while Asia Pacific sustains the supply base. Leaf powder remains the volume anchor (~30–35% share), but value is accelerating in finished nutraceuticals, RTD beverages, and cosmeceuticals as brands standardize dosing and pair moringa with probiotics, collagen, or adaptogens. E-commerce and pharmacy channels together account for a growing majority of sales, with online already in the mid-30% range and expanding at a low-double-digit CAGR through 2030. Strategically, the category benefits from a strong health halo—antioxidant and anti-inflammatory positioning—supporting premium price realization and repeat purchase rates above category averages.
Restraint:
Regulatory Barriers and Supply Risks Constraining Market Scalability
Regulatory variability and quality compliance remain the most material brakes on scale. Differing rules on health claims (e.g., “novel food” interpretations in the EU) and safety restrictions in select markets (such as historical limitations in Brazil) extend time-to-market by an estimated 6–12 months for new entrants and can add 5–8% to SG&A due to testing, dossiers, and audits. Supply risk compounds the challenge: climate volatility in key producing belts drives 10–20% yield swings year-to-year, while inconsistent post-harvest handling raises failure rates on pesticide, heavy-metal, and microbiological screens. The net effect is higher working capital and a narrower viable SKU set, favoring players with vertical integration, multi-origin sourcing, and in-house QA capabilities.
Opportunity:
High-Value Opportunities in Organic, Clinically Proven, and Beauty-Focused Moringa Products
Premium, certified-organic moringa and clinically substantiated formulations represent the clearest upside. If online’s category share rises from the mid-30% range in 2025 to ~45% by 2030, the channel could unlock USD 3–4 billion in incremental digital sales, disproportionately captured by traceable, fair-trade SKUs. In beauty, cold-pressed moringa (ben) oil is on track for a 10–12% value CAGR through 2034; at that pace, the segment could surpass USD 2.0 billion by 2030 on the back of cosmeceutical claims (barrier support, oxidative stability) and hybrid formats (serum-oils, scalp tonics). Upstream, Africa and Latin America offer attractive IRRs for value-addition—seed pressing, leaf drying, and encapsulation—particularly where public-private programs co-fund agronomy and certifications.
Trend:
Technological Advancements and Digital Innovation Redefining the Moringa Value Chain
Technology is reshaping competitiveness across the chain. Supercritical CO₂ and membrane filtration are lifting bioactive yields, while microencapsulation improves solubility and taste in beverages, enabling broader F&B adoption. Early adopters of AI-enabled agronomy and precision irrigation report 10–15% productivity gains and more consistent phytochemical profiles, supporting tighter COAs and fewer batch rejections. Concurrently, blockchain-based traceability and on-pack QR transparency are moving from pilots to standard practice, enhancing trust and price realization. On the commercial side, DTC subscriptions, tele-nutrition, and gummy/RTD formats are expanding category access; leading brands report subscription retention in the 55–60% range, reinforcing lifetime value and funding sustained R&D and clinical validation pipelines.
Recent Developments
Dec 2024 – True Moringa (MoringaConnect): Announced it became the world’s first regenerative-and-organic–certified moringa farm, marking a step-up in verifiable soil health and biodiversity practices; the certification underpins premium SKUs across beauty and nutrition for 2025. Strategic impact: elevates ESG credentials and pricing power with retailers that prioritize regenerative sourcing.
Feb 2025 – Organic India: Earned Regenerative Organic Certified® status across multiple teas and supplements, with a showcase tied to Expo West 2025; the move strengthens quality signaling for moringa capsules, powders, and infusions in North America and Europe. Strategic impact: enhances shelf credibility and accelerates penetration in natural/specialty retail and pharmacy channels.
Mar 2025 – True Moringa (MoringaConnect) x Mirepa Investment Advisors: Closed a growth investment aimed at scaling processing and governance; management indicates production capacity doubled post-investment as the brand targets international expansion. Strategic impact: fortifies midstream capabilities (seed oil pressing, leaf drying) and supports export readiness for US/EU buyers.
Apr 2025 – Kuli Kuli Foods: Unveiled a brand refresh highlighting “climate-smart superfoods” and an expanded portfolio (beyond moringa) to capture broader clean-label demand; the repositioning is designed to improve velocity across e-commerce and natural grocery. Strategic impact: widens the addressable market while keeping moringa at the core of a sustainability-led narrative.
Jul 2025 – India (Ecosystem Development): Tamil Nadu inaugurated a Moringa Export Zone & Facilitation Centre in Madurai, covering ~93% of 19,867 ha of regional moringa cultivation across nine districts—streamlining export logistics and farmer aggregation. Strategic impact: lowers transaction costs for exporters and improves reliability of India-origin leaf powder and oil for global buyers.
Sep 2025 – Kuli Kuli + MoSagri (Mozambique): Reported a supplier-partner nutrition program in Lumbo, Mozambique, funded via a Kuli Kuli grant, supporting community feeding initiatives and strengthening farmer relationships. Strategic impact: deepens ESG-driven supplier resilience and reinforces traceable sourcing in Southern Africa.

 Aerospace And Defence
 Agriculture
 Automotive And Transportation
 Banking And Finance
 Business
 Chemicals And Materials
 Consumer And Retail
 Electronics And Semiconductors
 Food And Beverages
 Machinery & Equipments
 Manufacturing And Construction
 Medical Devices
 Others
 Pharmaceuticals And Healthcare
 Power And Energy
 Sports
 Technology

, By Distribution Channel (Online, Offline) Industry Growth Drivers, Clean-Label Trends, Regional Outlook & Forecast 2025–2034")
, By Distribution Channel (Online, Offline) Industry Growth Drivers, Clean-Label Trends, Regional Outlook & Forecast 2025–2034")
, By Distribution Channel (Online, Offline) Industry Growth Drivers, Clean-Label Trends, Regional Outlook & Forecast 2025–2034")
, By Distribution Channel (Online, Offline) Industry Growth Drivers, Clean-Label Trends, Regional Outlook & Forecast 2025–2034")

