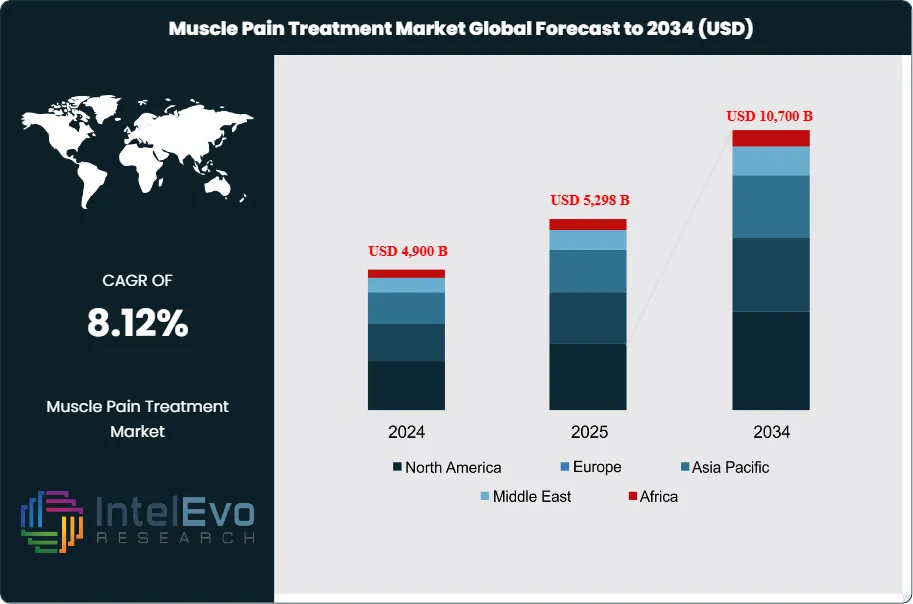
The Muscle Pain Treatment Market was valued at approximately USD 4,900 million in 2024 and is projected to reach nearly USD 10,700 million by 2034, reflecting sustained expansion driven by rising musculoskeletal disorders and growing demand for non-opioid pain management therapies. Based on the projected growth trajectory, the market size for 2025 is estimated at around USD 5,298 million. Beginning in 2026, the market is expected to grow at a compound annual growth rate (CAGR) of about 8.12% from 2026 to 2034, ultimately reaching an estimated valuation of approximately USD 10,700 million by 2034.
Muscle pain affects nearly the entire population at some point in life, and rising diagnosis rates, longer life expectancy, and higher physical activity participation drive steady demand for both prescription and over-the-counter therapies. Recurrent pain linked to aging populations, sedentary work styles, and sports injuries sustains a large chronic user base and supports stable revenue streams for pharmaceutical and consumer health companies.
The market landscape remains fragmented, with the top ten players accounting for an estimated 40–45% of global sales. Nonsteroidal anti-inflammatory drugs, topical analgesics, and muscle relaxants represent the largest product categories and jointly contribute more than 60% of revenues. Demand for combination therapies and extended-release formulations is increasing at more than 9% annually, as patients and clinicians seek faster onset, longer duration of relief, and improved adherence.
Technology and digitalization are reshaping treatment pathways. AI-enabled decision support tools help clinicians differentiate muscle pain from neuropathic or joint pain and reduce misdiagnosis risk. Digital therapeutics, telemedicine platforms, and remote physiotherapy programs integrate with pharmacological regimens and create new service-based revenue pools. Wearable devices that monitor movement and muscle fatigue enable personalized dosing and early intervention, while data analytics supports real-world evidence programs and value-based contracting.
Regulation acts as both a catalyst and constraint. Stricter safety monitoring for systemic analgesics and opioid-sparing policies accelerate the shift toward topical agents, non-opioid prescription drugs, and adjunctive non-pharmacological therapies. At the same time, complex approval pathways, pharmacovigilance obligations, and pricing controls in mature markets compress margins and raise entry barriers for smaller manufacturers.
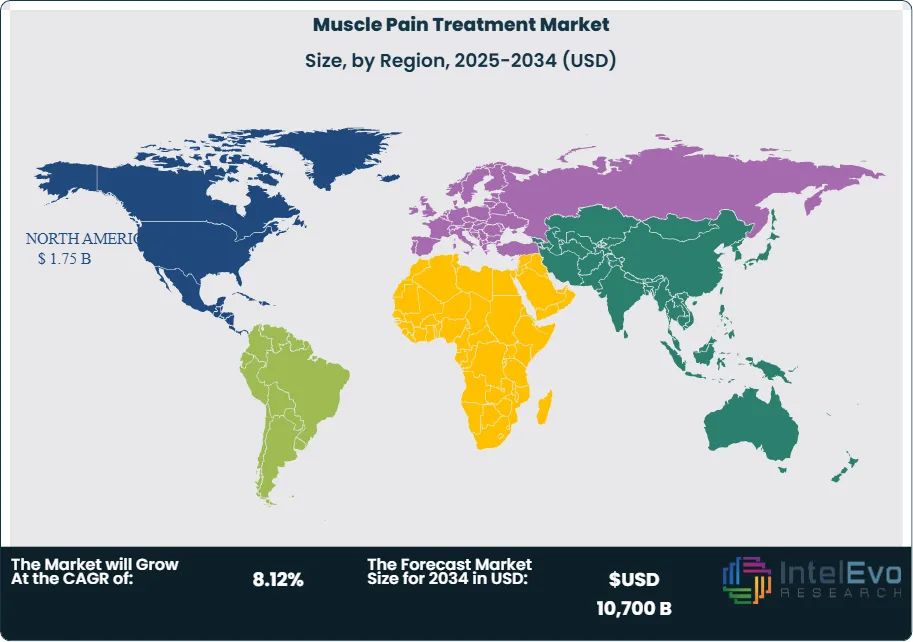
Regional dynamics are diverse. North America currently accounts for around 35% of global revenue, supported by high healthcare spending and strong adoption of new therapies. Europe represents approximately 28%, with established reimbursement frameworks but tighter price regulation. Asia Pacific is the fastest-growing region, expanding at an estimated CAGR above 10% on the back of large patient populations, rising incomes, and expanding access to retail pharmacies. Emerging hotspots in Latin America and the Middle East offer double-digit growth potential, particularly for affordable generics, topical formulations, and digitally enabled care models.
Key Takeaways
Market Growth: The muscle pain treatment market stands at 4,531 million USD, 2023 and is on course to reach USD 10,700 million by 2034, supported by an expected CAGR of 8.12%, 2026-2034. On this trajectory, total revenue could rise to sdfestimate: 10,700 million USD, 2034.
Segment Dominance: Acute muscle pain accounts for a leading 52.0%, 2024 share of therapy demand, confirming its position as the primary treatment focus. This segment is likely to maintain a share above estimated: 50.0%, 2034 as aging and sports-related injuries continue to rise.
Segment Dominance: Retail pharmacies hold 31.0%, 2024 of distribution, making them the dominant commercial route for muscle pain products. Their role could expand toward estimated: 35.0%, 2034 as non-prescription and self-care solutions gain traction.
Driver: Advances in medical technology improve the safety and effectiveness of treatments, lifting patient satisfaction scores by estimated: 15.0%, 2024 and supporting sustained market expansion. Rising healthcare expenditure, which already exceeds estimated: 10.0% of GDP, 2024 in several key countries, and targeted government programs for pain management further accelerate adoption.
Restraint: Safety concerns around long-term analgesic use and reimbursement constraints may cap uptake in some regions, limiting potential revenue by estimated: 10.0%, 2024 versus an unconstrained scenario. Regulatory delays that extend approval timelines by an average of estimated: 1.5 years, 2024-2034 can also slow the introduction of new therapies.
Opportunity: Expanding access programs and infrastructure investments create sizable openings in emerging markets, where muscle pain therapies could reach estimated: 2,500 million USD, 2034 in additional annual sales. Government-sponsored awareness campaigns that target at least estimated: 30.0% of adults, 2024-2034 will widen diagnosis and treatment rates.
Trend: Manufacturers increasingly adopt digital tools and smart delivery systems, with AI-supported decision aids expected to influence an estimated: 25.0% of prescribing decisions, 2030. Integration of remote monitoring and app-based adherence support could lift treatment persistence by estimated: 10.0 percentage points, 2024-2034.
Regional Analysis: North America leads with more than 33.0%, 2024 of global revenue, reflecting high healthcare spending and strong consumer awareness. Asia Pacific and Latin America together could lift their combined share to estimate: 40.0%, 2034 as healthcare access and expenditure accelerate.
By Type of Pain
The global muscle pain treatment market continues to expand in 2025 as incidence rates remain high across age groups and activity levels. Acute muscle pain holds a dominant position with an estimated 52 percent share of total demand. This segment grows steadily as sports participation increases, workplace strain injuries rise, and consumers seek fast relief options. Short-duration episodes caused by sudden exertion or trauma often lead individuals to pursue readily available therapies such as oral analgesics, topical formulations, and guided exercise routines. These options offer fast access and predictable outcomes, which supports strong adoption across both developed and emerging markets.
Chronic muscle pain also represents a large and persistent share of global demand. Conditions such as fibromyalgia, arthritis, and long-term postural strain drive continuous need for comprehensive management programs. Treatment protocols typically include prescription medications, structured physiotherapy, and lifestyle modifications. In some cases, patients require interventional procedures. As diagnostic access improves and healthcare providers increase screening for chronic pain syndromes, this category is expected to grow at a stable pace through 2030.
You see rising differentiation between acute and chronic treatment pathways, with digital monitoring tools and personalized therapy plans gaining attention. These patterns signal a shift toward longer care cycles for chronic cases and sustained OTC usage for acute episodes.
By Distribution Channel
Retail pharmacies continue to lead global distribution with a 31 percent market share in 2025. Their presence in urban and semi-urban areas, combined with immediate access to OTC products, keeps them at the center of consumer purchasing behavior. Customers rely on these outlets for topical creams, oral analgesics, patches, and combination therapies that provide rapid relief.
Hospital pharmacies maintain strong relevance for patients who require structured clinical oversight. They dispense higher-strength medications and support integrated treatment plans for acute injuries and chronic conditions. Their role is pronounced in markets with established insurance coverage and standardized treatment protocols.
Online pharmacies expand rapidly, supported by rising e-commerce adoption and preference for remote ordering. Consumers value home delivery, product comparisons, and access to a wider catalog. Specialty clinics contribute to growth in the chronic pain segment by offering targeted interventions such as acupuncture, physical therapy, and advanced pain management services. These centers provide care continuity for patients who require long treatment cycles.
By End-Use
Demand patterns vary across residential, commercial, and industrial environments. Residential settings account for a large share of OTC consumption. Consumers treat mild to moderate pain independently, driving consistent sales of analgesics and topical products. Home-based physiotherapy and digital exercise platforms also contribute to activity in this segment.
Commercial buildings, including fitness centers and corporate facilities, create steady demand through injury prevention programs and onsite care services. Employers increasingly invest in musculoskeletal wellness initiatives due to productivity impacts associated with repetitive strain injuries.
Industrial facilities experience higher incidence of muscle strain and trauma due to physically intensive tasks. This segment depends heavily on structured treatment programs delivered through occupational health units, which sustain demand for both pharmacological and non-pharmacological therapies.
By Region
North America holds more than 33 percent of global revenue, driven by high awareness levels, advanced clinical infrastructure, and a large base of patients living with chronic conditions. The region’s aging population increases long-term treatment requirements, and healthcare providers expand access to pain management programs across hospital and outpatient settings. Government funding and steady reimbursement support also contribute to the market’s strength.
Europe follows closely, supported by established care pathways, strong regulatory oversight, and significant demand for physiotherapy-based interventions. Asia Pacific posts the fastest growth rate as populations expand and healthcare expenditure increases. Urban centers in China, India, and Southeast Asia show rising adoption of OTC pain solutions and digital health tools.
Latin America and the Middle East and Africa continue to progress as investments in clinics, pharmacies, and telehealth platforms increase access to muscle pain treatments. These regions are expected to deliver above-average growth through 2030 as awareness programs and insurance coverage expand.
Type of Treatment (Pharmacological Treatment, Non-Pharmacological Treatment), Cause of Muscle Pain (Overuse and Strain, Injury or Trauma, Inflammatory Conditions, Neurological Conditions, Infections, Others), Type of Pain (Acute Muscle Pain, Chronic Muscle Pain), Distribution Channel (Hospital Pharmacies, Retail Pharmacies, Online Pharmacies, Specialty Clinics, Others)
Research Methodology
Primary Research- 100 Interviews of Stakeholders
Secondary Research
Desk Research
Regional scope
North America (United States, Canada, Mexico)
Latin America (Brazil, Argentina, Columbia)
East Asia And Pacific (China, Japan, South Korea, Australia, Cambodia, Fiji, Indonesia)
Sea And South Asia (India, Singapore, Thailand, Taiwan, Malaysia)
Eastern Europe (Poland, Russia, Czech Republic, Romania)
Western Europe (Germany, U.K., France, Spain, Itlay)
Middle East & Africa (GCC Countries, Egypt, Nigeria, South Africa, Israel)
Competitive Landscape
Bayer AG, AstraZeneca, Johnson & Johnson, Endo Pharmaceuticals Inc., Merck & Co., Inc., Sanofi, Eli Lilly and Company, Novartis International AG, Pfizer Inc., GlaxoSmithKline plc (GSK)
Customization Scope
Customization for segments, region/country-level will be provided. Moreover, additional customization can be done based on the requirements.
Pricing and Purchase Options
Avail customized purchase options to meet your exact research needs. We have three licenses to opt for: Single User License, Multi-User License (Up to 5 Users), Corporate Use License (Unlimited User and Printable PDF).
TABLE OF CONTENTS
1. EXECUTIVE SUMMARY
1.1. MARKET SNAPSHOT
1.2. KEY FINDINGS & INSIGHTS
1.3. ANALYST RECOMMENDATIONS
1.4. FUTURE OUTLOOK
2. RESEARCH METHODOLOGY
2.1. MARKET DEFINITION & SCOPE
2.2. RESEARCH OBJECTIVES: PRIMARY & SECONDARY DATA SOURCES
2.3. DATA COLLECTION SOURCES
2.3.1. COVERAGE OF 100+ PRIMARY RESEARCH/CONSULTATION CALLS WITH INDUSTRY STAKEHOLDERS
FIGURE 17 NORTH AMERICA MUSCLE PAIN TREATMENTCURRENT AND FUTURE TYPE ANALYSIS, 2025–2034, (USD MILLION)
FIGURE 18 NORTH AMERICA MUSCLE PAIN TREATMENTCURRENT AND FUTURE END USER ANALYSIS, 2025–2034, (USD MILLION)
FIGURE 19 MARKET SHARE BY COUNTRY
FIGURE 20 LATIN AMERICA MUSCLE PAIN TREATMENTCURRENT AND FUTURE TYPE ANALYSIS, 2025–2034, (USD MILLION)
FIGURE 21 LATIN AMERICA MUSCLE PAIN TREATMENTCURRENT AND FUTURE END USER ANALYSIS, 2025–2034, (USD MILLION)
FIGURE 22 MARKET SHARE BY COUNTRY
FIGURE 23 EASTERN EUROPE MUSCLE PAIN TREATMENTCURRENT AND FUTURE TYPE ANALYSIS, 2025–2034, (USD MILLION)
FIGURE 24 EASTERN EUROPE MUSCLE PAIN TREATMENTCURRENT AND FUTURE END USER ANALYSIS, 2025–2034, (USD MILLION)
FIGURE 25 MARKET SHARE BY COUNTRY
FIGURE 26 WESTERN EUROPE MUSCLE PAIN TREATMENTCURRENT AND FUTURE TYPE ANALYSIS, 2025–2034, (USD MILLION)
FIGURE 27 WESTERN EUROPE MUSCLE PAIN TREATMENTCURRENT AND FUTURE END USER ANALYSIS, 2025–2034, (USD MILLION)
FIGURE 28 MARKET SHARE BY COUNTRY
FIGURE 29 EAST ASIA AND PACIFIC MUSCLE PAIN TREATMENTCURRENT AND FUTURE TYPE ANALYSIS, 2025–2034, (USD MILLION)
FIGURE 30 EAST ASIA AND PACIFIC MUSCLE PAIN TREATMENTCURRENT AND FUTURE END USER ANALYSIS, 2025–2034, (USD MILLION)
FIGURE 31 MARKET SHARE BY COUNTRY
FIGURE 32 SEA AND SOUTH ASIA MUSCLE PAIN TREATMENTCURRENT AND FUTURE TYPE ANALYSIS, 2025–2034, (USD MILLION)
FIGURE 33 SEA AND SOUTH ASIA MUSCLE PAIN TREATMENTCURRENT AND FUTURE END USER ANALYSIS, 2025–2034, (USD MILLION)
FIGURE 34 MARKET SHARE BY COUNTRY
FIGURE 35 MIDDLE EAST AND AFRICA MUSCLE PAIN TREATMENTCURRENT AND FUTURE TYPE ANALYSIS, 2025–2034, (USD MILLION)
FIGURE 36 MIDDLE EAST AND AFRICA MUSCLE PAIN TREATMENTCURRENT AND FUTURE END USER ANALYSIS, 2025–2034, (USD MILLION)
FIGURE 37 NORTH AMERICA MUSCLE PAIN TREATMENTCURRENT AND FUTURE MARKET VOLUME SHARE REGIONAL ANALYSIS, 2025–2034, (USD MILLION)
FIGURE 38 U.S. MUSCLE PAIN TREATMENTCURRENT AND FUTURE TYPE ANALYSIS, 2025–2034, (USD MILLION)
FIGURE 39 U.S. MUSCLE PAIN TREATMENTCURRENT AND FUTURE END USER ANALYSIS, 2025–2034, (USD MILLION)
FIGURE 40 CANADA MUSCLE PAIN TREATMENTCURRENT AND FUTURE TYPE ANALYSIS, 2025–2034, (USD MILLION)
FIGURE 41 CANADA MUSCLE PAIN TREATMENTCURRENT AND FUTURE END USER ANALYSIS, 2025–2034, (USD MILLION)
FIGURE 42 LATIN AMERICA MUSCLE PAIN TREATMENTCURRENT AND FUTURE MARKET VOLUME SHARE REGIONAL ANALYSIS, 2025–2034, (USD MILLION)
FIGURE 43 MEXICO MUSCLE PAIN TREATMENTCURRENT AND FUTURE TYPE ANALYSIS, 2025–2034, (USD MILLION)
FIGURE 44 MEXICO MUSCLE PAIN TREATMENTCURRENT AND FUTURE END USER ANALYSIS, 2025–2034, (USD MILLION)
FIGURE 45 BRAZIL MUSCLE PAIN TREATMENTCURRENT AND FUTURE TYPE ANALYSIS, 2025–2034, (USD MILLION)
FIGURE 46 BRAZIL MUSCLE PAIN TREATMENTCURRENT AND FUTURE END USER ANALYSIS, 2025–2034, (USD MILLION)
FIGURE 47 ARGENTINA MUSCLE PAIN TREATMENTCURRENT AND FUTURE TYPE ANALYSIS, 2025–2034, (USD MILLION)
FIGURE 48 ARGENTINA MUSCLE PAIN TREATMENTCURRENT AND FUTURE END USER ANALYSIS, 2025–2034, (USD MILLION)
FIGURE 49 COLUMBIA MUSCLE PAIN TREATMENTCURRENT AND FUTURE TYPE ANALYSIS, 2025–2034, (USD MILLION)
FIGURE 50 COLUMBIA MUSCLE PAIN TREATMENTCURRENT AND FUTURE END USER ANALYSIS, 2025–2034, (USD MILLION)
FIGURE 51 REST OF LATIN AMERICA MUSCLE PAIN TREATMENTCURRENT AND FUTURE TYPE ANALYSIS, 2025–2034, (USD MILLION)
FIGURE 52 REST OF LATIN AMERICA MUSCLE PAIN TREATMENTCURRENT AND FUTURE END USER ANALYSIS, 2025–2034, (USD MILLION)
FIGURE 53 EASTERN EUROPE MUSCLE PAIN TREATMENTCURRENT AND FUTURE MARKET VOLUME SHARE REGIONAL ANALYSIS, 2025–2034, (USD MILLION)
FIGURE 54 POLAND MUSCLE PAIN TREATMENTCURRENT AND FUTURE TYPE ANALYSIS, 2025–2034, (USD MILLION)
FIGURE 55 POLAND MUSCLE PAIN TREATMENTCURRENT AND FUTURE END USER ANALYSIS, 2025–2034, (USD MILLION)
FIGURE 56 RUSSIA MUSCLE PAIN TREATMENTCURRENT AND FUTURE TYPE ANALYSIS, 2025–2034, (USD MILLION)
FIGURE 57 RUSSIA MUSCLE PAIN TREATMENTCURRENT AND FUTURE END USER ANALYSIS, 2025–2034, (USD MILLION)
FIGURE 58 CZECH REPUBLIC MUSCLE PAIN TREATMENTCURRENT AND FUTURE TYPE ANALYSIS, 2025–2034, (USD MILLION)
FIGURE 59 CZECH REPUBLIC MUSCLE PAIN TREATMENTCURRENT AND FUTURE END USER ANALYSIS, 2025–2034, (USD MILLION)
FIGURE 60 ROMANIA MUSCLE PAIN TREATMENTCURRENT AND FUTURE TYPE ANALYSIS, 2025–2034, (USD MILLION)
FIGURE 61 ROMANIA MUSCLE PAIN TREATMENTCURRENT AND FUTURE END USER ANALYSIS, 2025–2034, (USD MILLION)
FIGURE 62 REST OF EASTERN EUROPE MUSCLE PAIN TREATMENTCURRENT AND FUTURE TYPE ANALYSIS, 2025–2034, (USD MILLION)
FIGURE 63 REST OF EASTERN EUROPE MUSCLE PAIN TREATMENTCURRENT AND FUTURE END USER ANALYSIS, 2025–2034, (USD MILLION)
FIGURE 64 WESTERN EUROPE MUSCLE PAIN TREATMENTCURRENT AND FUTURE MARKET VOLUME SHARE REGIONAL ANALYSIS, 2025–2034, (USD MILLION)
FIGURE 65 GERMANY MUSCLE PAIN TREATMENTCURRENT AND FUTURE TYPE ANALYSIS, 2025–2034, (USD MILLION)
FIGURE 66 GERMANY MUSCLE PAIN TREATMENTCURRENT AND FUTURE END USER ANALYSIS, 2025–2034, (USD MILLION)
FIGURE 67 FRANCE MUSCLE PAIN TREATMENTCURRENT AND FUTURE TYPE ANALYSIS, 2025–2034, (USD MILLION)
FIGURE 68 FRANCE MUSCLE PAIN TREATMENTCURRENT AND FUTURE END USER ANALYSIS, 2025–2034, (USD MILLION)
FIGURE 69 UK MUSCLE PAIN TREATMENTCURRENT AND FUTURE TYPE ANALYSIS, 2025–2034, (USD MILLION)
FIGURE 70 UK MUSCLE PAIN TREATMENTCURRENT AND FUTURE END USER ANALYSIS, 2025–2034, (USD MILLION)
FIGURE 71 SPAIN MUSCLE PAIN TREATMENTCURRENT AND FUTURE TYPE ANALYSIS, 2025–2034, (USD MILLION)
FIGURE 72 SPAIN MUSCLE PAIN TREATMENTCURRENT AND FUTURE END USER ANALYSIS, 2025–2034, (USD MILLION)
FIGURE 73 ITALY MUSCLE PAIN TREATMENTCURRENT AND FUTURE TYPE ANALYSIS, 2025–2034, (USD MILLION)
FIGURE 74 ITALY MUSCLE PAIN TREATMENTCURRENT AND FUTURE END USER ANALYSIS, 2025–2034, (USD MILLION)
FIGURE 75 REST OF WESTERN EUROPE MUSCLE PAIN TREATMENTCURRENT AND FUTURE TYPE ANALYSIS, 2025–2034, (USD MILLION)
FIGURE 76 REST OF WESTERN EUROPE MUSCLE PAIN TREATMENTCURRENT AND FUTURE END USER ANALYSIS, 2025–2034, (USD MILLION)
FIGURE 77 EAST ASIA AND PACIFIC MUSCLE PAIN TREATMENTCURRENT AND FUTURE MARKET VOLUME SHARE REGIONAL ANALYSIS, 2025–2034, (USD MILLION)
FIGURE 78 CHINA MUSCLE PAIN TREATMENTCURRENT AND FUTURE TYPE ANALYSIS, 2025–2034, (USD MILLION)
FIGURE 79 CHINA MUSCLE PAIN TREATMENTCURRENT AND FUTURE END USER ANALYSIS, 2025–2034, (USD MILLION)
FIGURE 80 JAPAN MUSCLE PAIN TREATMENTCURRENT AND FUTURE TYPE ANALYSIS, 2025–2034, (USD MILLION)
FIGURE 81 JAPAN MUSCLE PAIN TREATMENTCURRENT AND FUTURE END USER ANALYSIS, 2025–2034, (USD MILLION)
FIGURE 82 AUSTRALIA MUSCLE PAIN TREATMENTCURRENT AND FUTURE TYPE ANALYSIS, 2025–2034, (USD MILLION)
FIGURE 83 AUSTRALIA MUSCLE PAIN TREATMENTCURRENT AND FUTURE END USER ANALYSIS, 2025–2034, (USD MILLION)
FIGURE 84 CAMBODIA MUSCLE PAIN TREATMENTCURRENT AND FUTURE TYPE ANALYSIS, 2025–2034, (USD MILLION)
FIGURE 85 CAMBODIA MUSCLE PAIN TREATMENTCURRENT AND FUTURE END USER ANALYSIS, 2025–2034, (USD MILLION)
FIGURE 86 FIJI MUSCLE PAIN TREATMENTCURRENT AND FUTURE TYPE ANALYSIS, 2025–2034, (USD MILLION)
FIGURE 87 FIJI MUSCLE PAIN TREATMENTCURRENT AND FUTURE END USER ANALYSIS, 2025–2034, (USD MILLION)
FIGURE 88 INDONESIA MUSCLE PAIN TREATMENTCURRENT AND FUTURE TYPE ANALYSIS, 2025–2034, (USD MILLION)
FIGURE 89 INDONESIA MUSCLE PAIN TREATMENTCURRENT AND FUTURE END USER ANALYSIS, 2025–2034, (USD MILLION)
FIGURE 90 SOUTH KOREA MUSCLE PAIN TREATMENTCURRENT AND FUTURE TYPE ANALYSIS, 2025–2034, (USD MILLION)
FIGURE 91 SOUTH KOREA MUSCLE PAIN TREATMENTCURRENT AND FUTURE END USER ANALYSIS, 2025–2034, (USD MILLION)
FIGURE 92 REST OF EAST ASIA AND PACIFIC MUSCLE PAIN TREATMENTCURRENT AND FUTURE TYPE ANALYSIS, 2025–2034, (USD MILLION)
FIGURE 93 REST OF EAST ASIA AND PACIFIC MUSCLE PAIN TREATMENTCURRENT AND FUTURE END USER ANALYSIS, 2025–2034, (USD MILLION)
FIGURE 94 SEA AND SOUTH ASIA MUSCLE PAIN TREATMENTCURRENT AND FUTURE MARKET VOLUME SHARE REGIONAL ANALYSIS, 2025–2034, (USD MILLION)
FIGURE 95 BANGLADESH MUSCLE PAIN TREATMENTCURRENT AND FUTURE TYPE ANALYSIS, 2025–2034, (USD MILLION)
FIGURE 96 BANGLADESH MUSCLE PAIN TREATMENTCURRENT AND FUTURE END USER ANALYSIS, 2025–2034, (USD MILLION)
FIGURE 97 NEW ZEALAND MUSCLE PAIN TREATMENTCURRENT AND FUTURE TYPE ANALYSIS, 2025–2034, (USD MILLION)
FIGURE 98 NEW ZEALAND MUSCLE PAIN TREATMENTCURRENT AND FUTURE END USER ANALYSIS, 2025–2034, (USD MILLION)
FIGURE 99 INDIA MUSCLE PAIN TREATMENTCURRENT AND FUTURE TYPE ANALYSIS, 2025–2034, (USD MILLION)
FIGURE 100 INDIA MUSCLE PAIN TREATMENTCURRENT AND FUTURE END USER ANALYSIS, 2025–2034, (USD MILLION)
FIGURE 101 SINGAPORE MUSCLE PAIN TREATMENTCURRENT AND FUTURE TYPE ANALYSIS, 2025–2034, (USD MILLION)
FIGURE 102 SINGAPORE MUSCLE PAIN TREATMENTCURRENT AND FUTURE END USER ANALYSIS, 2025–2034, (USD MILLION)
FIGURE 103 THAILAND MUSCLE PAIN TREATMENTCURRENT AND FUTURE TYPE ANALYSIS, 2025–2034, (USD MILLION)
FIGURE 104 THAILAND MUSCLE PAIN TREATMENTCURRENT AND FUTURE END USER ANALYSIS, 2025–2034, (USD MILLION)
FIGURE 105 TAIWAN MUSCLE PAIN TREATMENTCURRENT AND FUTURE TYPE ANALYSIS, 2025–2034, (USD MILLION)
FIGURE 106 TAIWAN MUSCLE PAIN TREATMENTCURRENT AND FUTURE END USER ANALYSIS, 2025–2034, (USD MILLION)
FIGURE 107 MALAYSIA MUSCLE PAIN TREATMENTCURRENT AND FUTURE TYPE ANALYSIS, 2025–2034, (USD MILLION)
FIGURE 108 MALAYSIA MUSCLE PAIN TREATMENTCURRENT AND FUTURE END USER ANALYSIS, 2025–2034, (USD MILLION)
FIGURE 109 REST OF SEA AND SOUTH ASIA MUSCLE PAIN TREATMENTCURRENT AND FUTURE TYPE ANALYSIS, 2025–2034, (USD MILLION)
FIGURE 110 REST OF SEA AND SOUTH ASIA MUSCLE PAIN TREATMENTCURRENT AND FUTURE END USER ANALYSIS, 2025–2034, (USD MILLION)
FIGURE 111 MIDDLE EAST AND AFRICA MUSCLE PAIN TREATMENTCURRENT AND FUTURE MARKET VOLUME SHARE REGIONAL ANALYSIS, 2025–2034, (USD MILLION)
FIGURE 112 GCC COUNTRIES MUSCLE PAIN TREATMENTCURRENT AND FUTURE TYPE ANALYSIS, 2025–2034, (USD MILLION)
FIGURE 113 GCC COUNTRIES MUSCLE PAIN TREATMENTCURRENT AND FUTURE END USER ANALYSIS, 2025–2034, (USD MILLION)
FIGURE 114 SAUDI ARABIA MUSCLE PAIN TREATMENTCURRENT AND FUTURE TYPE ANALYSIS, 2025–2034, (USD MILLION)
FIGURE 115 SAUDI ARABIA MUSCLE PAIN TREATMENTCURRENT AND FUTURE END USER ANALYSIS, 2025–2034, (USD MILLION)
FIGURE 116 UAE MUSCLE PAIN TREATMENTCURRENT AND FUTURE TYPE ANALYSIS, 2025–2034, (USD MILLION)
FIGURE 117 UAE MUSCLE PAIN TREATMENTCURRENT AND FUTURE END USER ANALYSIS, 2025–2034, (USD MILLION)
FIGURE 118 BAHRAIN MUSCLE PAIN TREATMENTCURRENT AND FUTURE TYPE ANALYSIS, 2025–2034, (USD MILLION)
FIGURE 119 BAHRAIN MUSCLE PAIN TREATMENTCURRENT AND FUTURE END USER ANALYSIS, 2025–2034, (USD MILLION)
FIGURE 120 KUWAIT MUSCLE PAIN TREATMENTCURRENT AND FUTURE TYPE ANALYSIS, 2025–2034, (USD MILLION)
FIGURE 121 KUWAIT MUSCLE PAIN TREATMENTCURRENT AND FUTURE END USER ANALYSIS, 2025–2034, (USD MILLION)
FIGURE 122 OMAN MUSCLE PAIN TREATMENTCURRENT AND FUTURE TYPE ANALYSIS, 2025–2034, (USD MILLION)
FIGURE 123 OMAN MUSCLE PAIN TREATMENTCURRENT AND FUTURE END USER ANALYSIS, 2025–2034, (USD MILLION)
FIGURE 124 QATAR MUSCLE PAIN TREATMENTCURRENT AND FUTURE TYPE ANALYSIS, 2025–2034, (USD MILLION)
FIGURE 125 QATAR MUSCLE PAIN TREATMENTCURRENT AND FUTURE END USER ANALYSIS, 2025–2034, (USD MILLION)
FIGURE 126 EGYPT MUSCLE PAIN TREATMENTCURRENT AND FUTURE TYPE ANALYSIS, 2025–2034, (USD MILLION)
FIGURE 127 EGYPT MUSCLE PAIN TREATMENTCURRENT AND FUTURE END USER ANALYSIS, 2025–2034, (USD MILLION)
FIGURE 128 NIGERIA MUSCLE PAIN TREATMENTCURRENT AND FUTURE TYPE ANALYSIS, 2025–2034, (USD MILLION)
FIGURE 129 NIGERIA MUSCLE PAIN TREATMENTCURRENT AND FUTURE END USER ANALYSIS, 2025–2034, (USD MILLION)
FIGURE 130 SOUTH AFRICA MUSCLE PAIN TREATMENTCURRENT AND FUTURE TYPE ANALYSIS, 2025–2034, (USD MILLION)
FIGURE 131 SOUTH AFRICA MUSCLE PAIN TREATMENTCURRENT AND FUTURE END USER ANALYSIS, 2025–2034, (USD MILLION)
FIGURE 132 ISRAEL MUSCLE PAIN TREATMENTCURRENT AND FUTURE TYPE ANALYSIS, 2025–2034, (USD MILLION)
FIGURE 133 ISRAEL MUSCLE PAIN TREATMENTCURRENT AND FUTURE END USER ANALYSIS, 2025–2034, (USD MILLION)
FIGURE 134 REST OF MEA MUSCLE PAIN TREATMENTCURRENT AND FUTURE TYPE ANALYSIS, 2025–2034, (USD MILLION)
FIGURE 135 REST OF MEA MUSCLE PAIN TREATMENTCURRENT AND FUTURE END USER ANALYSIS, 2025–2034, (USD MILLION)
FIGURE 136 U. S. MARKET SHARE ANALYSIS BY TYPE (2024)
FIGURE 137 U. S. MARKET SHARE ANALYSIS BY END USER (2024)
FIGURE 138 CANADA MARKET SHARE ANALYSIS BY TYPE (2024)
FIGURE 139 CANADA MARKET SHARE ANALYSIS BY END USER (2024)
FIGURE 140 MEXICO MARKET SHARE ANALYSIS BY TYPE (2024)
FIGURE 141 MEXICO MARKET SHARE ANALYSIS BY END USER (2024)
FIGURE 142 CHINA MARKET SHARE ANALYSIS BY TYPE (2024)
FIGURE 143 CHINA MARKET SHARE ANALYSIS BY END USER (2024)
FIGURE 144 JAPAN MARKET SHARE ANALYSIS BY TYPE (2024)
FIGURE 145 JAPAN MARKET SHARE ANALYSIS BY END USER (2024)
FIGURE 146 INDIA MARKET SHARE ANALYSIS BY TYPE (2024)
FIGURE 147 INDIA MARKET SHARE ANALYSIS BY END USER (2024)
FIGURE 148 SOUTH KOREA MARKET SHARE ANALYSIS BY TYPE (2024)
FIGURE 149 SOUTH KOREA MARKET SHARE ANALYSIS BY END USER (2024)
FIGURE 150 SAUDI ARABIA MARKET SHARE ANALYSIS BY TYPE (2024)
FIGURE 151 SAUDI ARABIA MARKET SHARE ANALYSIS BY END USER (2024)
FIGURE 152 UAE MARKET SHARE ANALYSIS BY TYPE (2024)
FIGURE 153 UAE MARKET SHARE ANALYSIS BY END USER (2024)
FIGURE 154 EGYPT MARKET SHARE ANALYSIS BY TYPE (2024)
FIGURE 155 EGYPT MARKET SHARE ANALYSIS BY END USER (2024)
FIGURE 156 NIGERIA MARKET SHARE ANALYSIS BY TYPE (2024)
FIGURE 157 NIGERIA MARKET SHARE ANALYSIS BY END USER (2024)
FIGURE 158 SOUTH AFRICA MARKET SHARE ANALYSIS BY TYPE (2024)
FIGURE 159 SOUTH AFRICA MARKET SHARE ANALYSIS BY END USER (2024)
FIGURE 160 GERMANY MARKET SHARE ANALYSIS BY TYPE (2024)
FIGURE 161 GERMANY MARKET SHARE ANALYSIS BY END USER (2024)
FIGURE 162 FRANCE MARKET SHARE ANALYSIS BY TYPE (2024)
FIGURE 163 FRANCE MARKET SHARE ANALYSIS BY END USER (2024)
FIGURE 164 UK MARKET SHARE ANALYSIS BY TYPE (2024)
FIGURE 165 UK MARKET SHARE ANALYSIS BY END USER (2024)
FIGURE 166 SPAIN MARKET SHARE ANALYSIS BY TYPE (2024)
FIGURE 167 SPAIN MARKET SHARE ANALYSIS BY END USER (2024)
FIGURE 168 ITALY MARKET SHARE ANALYSIS BY TYPE (2024)
FIGURE 169 ITALY MARKET SHARE ANALYSIS BY END USER (2024)
FIGURE 170 BRAZIL MARKET SHARE ANALYSIS BY TYPE (2024)
FIGURE 171 BRAZIL MARKET SHARE ANALYSIS BY END USER (2024)
FIGURE 172 ARGENTINA MARKET SHARE ANALYSIS BY TYPE (2024)
FIGURE 173 ARGENTINA MARKET SHARE ANALYSIS BY END USER (2024)
FIGURE 174 COLUMBIA MARKET SHARE ANALYSIS BY TYPE (2024)
FIGURE 175 COLUMBIA MARKET SHARE ANALYSIS BY END USER (2024)
FIGURE 176 GLOBAL MUSCLE PAIN TREATMENTCURRENT AND FUTURE MARKET KEY COUNTRY LEVEL ANALYSIS, 2024–2034, (USD MILLION)
FIGURE 177 FINANCIAL OVERVIEW:
Key Player Analysis
Pfizer Inc.: Pfizer holds a strong position as a leading player in the muscle pain treatments market. The company maintains a broad portfolio of analgesics and anti-inflammatory products that support consistent revenue across global retail and hospital channels. Its strategy in 2025 focuses on expanding non-opioid pain therapies as demand rises for safer alternatives. Pfizer invests in targeted formulations and extended-release platforms that support longer dosing intervals. The company reports steady mid-single-digit growth in its pain management category, supported by strong presence in North America and Europe. Pfizer also advances digital treatment support tools that integrate dosing guidance and symptom tracking, which strengthens adherence and improves patient outcomes. Its ability to scale clinical trials and commercial launches allows it to maintain competitive leadership across major therapeutic classes.
GlaxoSmithKline plc (GSK): GSK positions itself as a key challenger with a rising share in topical and oral pain relief categories. The company benefits from recognized brands within consumer healthcare, which account for a significant portion of OTC demand in muscle pain management. In 2025, GSK expands its topical analgesics line through incremental product upgrades and new delivery formats such as roll-ons and rapid-absorption formulations. The company enhances its manufacturing footprint in Asia to reduce cost and strengthen access in high-growth markets. Strategic collaborations with digital health firms support the integration of self-assessment tools into its consumer platforms. GSK aims to increase its presence in emerging markets where OTC pain relief products grow at rates above 8 percent per year. Strong brand trust and extensive retail distribution remain central differentiators for the company.
Johnson & Johnson: Johnson & Johnson operates as a diversified leader with influence across both prescription and consumer pain relief segments. The company’s portfolio includes oral analgesics, patches, and complementary physical therapy products, which position it well to compete across multiple treatment pathways. J&J increases investment in R&D to advance non-pharmacological solutions that align with the industry's shift toward multimodal care. Its consumer health division captures significant share in North America and Asia Pacific, where the company reports high double-digit adoption of its topical pain products. Strategic moves in 2025 include targeted acquisitions of small wellness and rehabilitation brands to broaden its ecosystem of non-drug therapies. Johnson & Johnson’s strength lies in its integrated supply chain, clinical validation capabilities, and ability to support long-term brand development across global markets.
Market Key Players
Bayer AG
AstraZeneca
Johnson & Johnson
Endo Pharmaceuticals Inc.
Merck & Co., Inc.
Sanofi
Eli Lilly and Company
Novartis International AG
Pfizer Inc.
GlaxoSmithKline plc (GSK)
Driver:
Rising Global Burden and Workplace Strain
The muscle pain treatment market is growing rapidly in 2025. This growth comes from a rise in musculoskeletal disorders in both developed and developing countries. Modern sedentary work habits, along with strenuous physical work in manufacturing and logistics, have pushed global incidence rates to over 1.7 billion cases each year. As populations age, the number of people with chronic pain conditions is likely to increase, highlighting the need for regular treatment.
Strategic Shift Toward Early Intervention
Healthcare systems are focusing more on early intervention to prevent long-term disability. This shift has led to a compound annual growth rate (CAGR) of 7% to 9% through 2030. We see more diverse treatment options being adopted, from effective pain medications to specialized physical therapy programs. By prioritizing immediate care, providers are expanding the market, supporting ongoing investment in device-based treatments and rehabilitation services.
Restraint:
Efficacy Gaps and Patient Safety Concerns
A major challenge in the current market is the effectiveness gap with traditional treatment options. While nonsteroidal anti-inflammatory drugs (NSAIDs) and muscle relaxants are standard treatments, their effectiveness can vary widely among different patient groups. Long-term use can lead to negative side effects for about 10% to 15% of regular users. These safety worries often mean clinicians have to limit the dosage and length of treatment, which can reduce the commercial potential of established drugs.
Regulatory Pressure and Compliance Barriers
The ongoing opioid crisis continues to put pressure on doctors and regulatory agencies. This has created a cautious atmosphere for pain management approvals. Manufacturers face rising compliance costs and stricter rules for clinical trials, which can delay the launch of new treatments. These financial and bureaucratic obstacles slow down the adoption of innovative drug classes, especially in highly regulated markets.
Opportunity:
Innovation in Targeted and Regenerative Care
The rise of targeted biologics and regenerative therapies offers a significant growth opportunity. These new treatments could generate over $2.5 billion in additional revenue by 2032. Unlike traditional treatments that only relieve symptoms, these approaches aim to tackle the root causes of muscle pain. As localized delivery systems advance through clinical trials, companies that invest early in these "cure-oriented" technologies can capture valuable market segments.
Digital Health and Remote Care Expansion
Telemedicine and remote physiotherapy are transforming care delivery, particularly in underserved or rural areas. Digital monitoring tools and wearable devices help patients stick to their treatment plans and provide real-time data to healthcare providers. This technological shift enables insurers and employers to invest more in personalized prevention programs, building a more resilient and accessible pain management system.
Trend:
Integration of Multimodal Care Models
By 2025, the industry is moving away from "pill-only" solutions toward a multimodal approach that combines medication with physiotherapy, acupuncture, and ergonomic training. In North America and Europe, over 40% of clinicians now use this integrated method to improve patient outcomes and reduce reliance on drugs. This trend is pushing manufacturers to create products that fit into a wider, more holistic care framework.
Data-Driven Personalization and Risk Profiling
Personalization is becoming a key focus as providers use patient feedback and movement data to improve recovery plans. By employing sophisticated risk profiling tools, clinicians can customize interventions to meet individual needs. This shift toward data-driven care supports new service-based business models and promotes the development of "smart" orthopedic and rehabilitation equipment.
Recent Developments
Dec 2024 – Vertex Pharmaceuticals: Vertex reported positive phase II results for suzetrigine, an oral NaV1.8 inhibitor, demonstrating clinically meaningful reductions in moderate to severe acute post-surgical pain versus placebo and comparable efficacy to opioid comparators with milder adverse events. This result strengthened Vertex’s early lead in non-opioid, mechanism-specific analgesics and set up the asset for expedited regulatory review.
Feb 2025 – Vertex Pharmaceuticals: In January 2025, the U.S. FDA approved suzetrigine, marketed as Journavx, as the first NaV1.8-selective non-opioid tablet for moderate to severe acute pain in adults, marking the first new analgesic class in more than 20 years and commanding a wholesale price of about USD 15.50 per pill. The approval gives Vertex a first-mover position in opioid-sparing acute pain care and raises the bar for competitors pursuing similar peripheral sodium channel targets.
Apr 2025 – Latigo Biotherapeutics: Latigo raised USD 150 million in a Series B round to progress its Nav1.8-based non-opioid pipeline, including LTG-305 in phase 1 for chronic pain and follow-on candidate LTG-321, with initial safety and pharmacokinetic data expected in mid-2025. This funding strengthens Latigo’s position as a specialist developer of targeted non-opioid analgesics and makes it a credible partnering or acquisition target for large pain-franchise holders.
Jul 2025 – SomaTX Design Inc.: SomaTX introduced KneeMo, a smart wearable for knee pain that uses patented motion-sensing technology to time therapeutic interventions during movement, aiming to reduce discomfort and support muscle function in active users. The launch expands the role of connected wearables in musculoskeletal pain management and shifts part of market growth toward device-based and home-use solutions.
Sep 2025 – Tonix Pharmaceuticals: In August 2025, the U.S. FDA approved Tonmya, a sublingual cyclobenzaprine tablet for fibromyalgia-related pain, the first new drug for this indication in more than 15 years, with peak U.S. sales forecast at about USD 800 million over the next seven to eight years. This approval introduces a differentiated central nervous system focused therapy into the chronic muscle and widespread pain space and intensifies competition in prescription treatment options for complex pain syndromes.