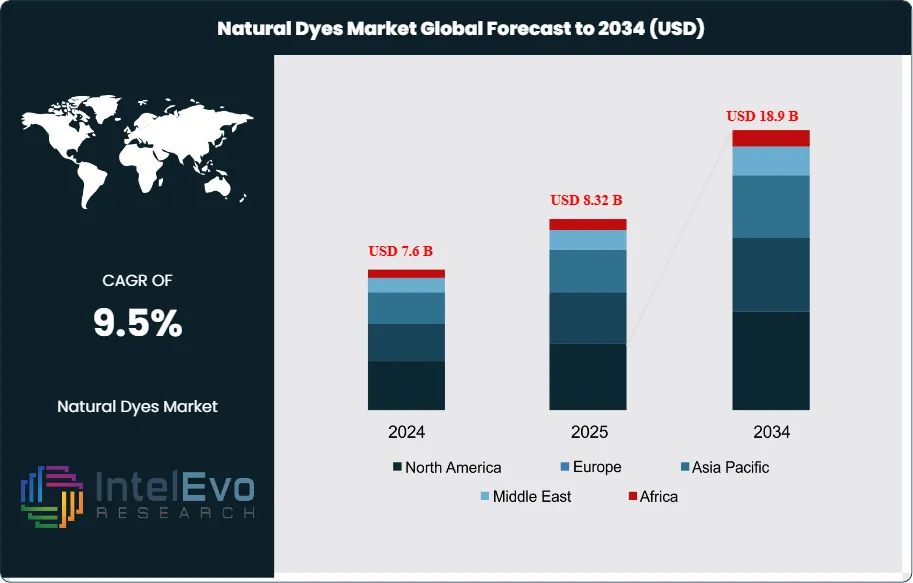
The Natural Dyes Market is estimated at USD 7.6 billion in 2024 and is projected to reach approximately USD 18.9 billion by 2034, registering a CAGR of about 9.5% during 2025–2034. This sustained growth is driven by rising consumer preference for eco-friendly, non-toxic colorants across textiles, food & beverages, cosmetics, and packaging industries. Increasing regulatory pressure against synthetic dyes, combined with brand commitments toward clean-label and sustainable sourcing, is accelerating adoption globally. Additionally, advancements in extraction technologies and improved color fastness are enhancing the commercial viability of natural dyes, positioning the market for steady long-term expansion.
The push for earth-friendly options is changing how companies buy supplies - particularly in textiles, groceries, and beauty products. Consequently, colors made from nature – like those coming from indigo, turmeric, madder, and annatto plants – are becoming more popular because both rules and shoppers dislike artificial chemicals. Right now, indigo-based dyes lead the way, owing to their use in jeans together with lasting color.
Natural dyes largely come from plants - a result of tradition alongside well-established production in places such as India, Peru, and areas of Africa. In 2024, fabrics and leather used more than half of all natural dyes. However, their use expands into foods and beauty items, especially favored by higher-end companies wanting colors that break down easily while being safe for sensitivities. In 2024, North America captures the biggest piece of the sales pie - 35% worldwide - thanks to strict rules about what goes on product labels alongside shoppers wanting simpler ingredients. Yet, the Asia Pacific area is growing at a quicker rate, fueled by strong manufacturing networks, low costs, plus increasing help from governments.
Most natural dye purchases still happen at retail shops, benefiting both customers and smaller businesses. Nevertheless, more companies are now getting dyes directly from farms or via online marketplaces - especially when they need a lot. Getting consistent color plus dealing with when materials are available remains tricky. Getting products onto shelves quickly while keeping colors true is still a big hurdle for widespread use. Because of this, people are putting more money into how things are made - specifically better recipes alongside automated systems. Teams in both South Korea and Germany are experimenting with using living organisms for production together with precise digital adjustments to color, aiming to cut down on wasted materials and ensure consistent results.
Money’s moving toward places offering good work at reasonable prices, especially Vietnam and Indonesia - they’re becoming major production centers as expenses rise everywhere else. What happens next hinges on making textiles greener, following new rules, then creating dyes that are dependable, affordable, yet don’t harm the environment?
Key Takeaways
Market Growth: The global Natural Dyes Market reached USD 7.6 billion in 2024 and is projected to grow to USD 18.9 billion by 2034, registering a CAGR of 9.5%. Demand is rising due to regulatory pressure on synthetic dyes and increased consumer preference for sustainable materials across textiles, food, and personal care.
By Source: Plant-based dyes accounted for the largest share in 2024, supported by established supply chains and broad applicability across end-use sectors. Key sources include indigo, turmeric, and madder, widely used in textile and cosmetic manufacturing.
By Chemical Constitution: Indigoid dyes led the market by chemical class, driven by strong demand from the denim and casual apparel industries. Indigo accounted for a significant portion of global plant-based dye exports in 2024.
By Application: Textiles and leather remained the primary application, contributing over 60% of total demand. Global apparel brands are shifting procurement toward low-impact dyeing methods to meet ESG targets and reduce wastewater emissions.
By Distribution Channel: Retail stores captured the largest share of natural dye distribution, especially among small-scale textile producers and artisans. B2B platforms are expanding but remain secondary in terms of volume.
Driver: Sustainability-led procurement policies and consumer preference for clean-label products are accelerating adoption. Over 18% of new textile product launches in 2025 featured natural dyes or plant-based pigment claims.
Restraint: High production costs and limited colorfastness restrict mass-market scalability. Natural dyes are priced 30%–45% higher than synthetic alternatives, driven by labor-intensive extraction and raw material seasonality.
Opportunity: Asia Pacific, led by India and Vietnam, is emerging as a supply and processing hub. The region is expected to grow at over 12% CAGR through 2030, supported by local sourcing, low-cost labor, and rising exports.
Trend: Biofermentation and AI-based extraction techniques are gaining traction in R&D pipelines. Early pilots in South Korea and the Netherlands show promise in reducing waste and improving batch consistency.
Regional Analysis: North America held 35% of global revenue in 2024, driven by clean-label trends and strict chemical regulations. Asia Pacific is the fastest-growing region, while Europe remains key for premium, traceable dye applications.
Source Analysis
As of 2025, plant-based sources continue to lead the global natural dyes market, accounting for the majority share across industrial applications. Their dominance is rooted in the widespread use of botanicals like indigo, madder, turmeric, and annatto across the textile, food, and personal care sectors. These sources are favored for their non-toxic properties and alignment with sustainability goals. Improved extraction processes and processing technologies have enhanced pigment quality and production consistency, reinforcing plant-based dyes as the default choice in large-scale natural dyeing.
Animal-derived dyes, though limited in market share, hold cultural and artisanal value. Products such as cochineal and lac are used in traditional textiles and niche cosmetic formulations. Meanwhile, mineral and microbial sources, grouped under the "others" category, are gaining attention in research and specialty applications. However, they currently lag in volume due to limited scalability and higher processing costs.
Distribution Channel Analysis
Retail stores remain the dominant distribution channel in 2025, capturing the largest share of the natural dyes market. This segment benefits from its accessibility, product variety, and ability to serve small-scale manufacturers, designers, and craft-based buyers. In-person retail continues to play a central role in markets where direct product evaluation and customer interaction influence purchasing decisions.
Online platforms are rapidly expanding, supported by the growth of e-commerce and increased interest in sustainable products from global consumers. These channels are particularly important for small dye manufacturers reaching international buyers. Specialty stores serve a niche but loyal segment of the market, offering premium or rare dye varieties to professional users. Alternative channels, including local markets and direct-to-consumer sales, remain relevant in developing regions, although they represent a smaller share overall.
Chemical Constitution Analysis
Indigoid dyes lead the market in 2025, driven by their continued relevance in the textile sector, especially denim. Extracted primarily from indigo plants, these dyes are valued for their deep blue color, natural origin, and long-standing application in commercial fashion. Their stable performance and scalability contribute to their sustained dominance within natural dye classes.
Anthraquinone-based dyes follow closely, offering vibrant red and orange hues, commonly used in apparel and printing. Flavonoids, Alpha Naphthoquinones, and carotenoids have found applications in cosmetics and food, where their antioxidant properties and botanical sources add functional appeal. While some categories such as di-hydropyrans and anthocyanidins remain smaller in market size, they are drawing attention for their color diversity and potential integration into premium product lines.
Application Analysis
Textiles and leather remain the largest application segment, generating more than 60% of total demand for natural dyes in 2025. This is supported by regulatory shifts away from hazardous synthetic dyes and increasing procurement standards across global fashion and home textile brands. Natural dyes now appear in mainstream production lines, particularly in sustainable apparel collections and artisanal leather goods.
The food and beverage sector continues to expand its use of natural dyes, particularly in plant-based and organic product ranges. Carotenoids, anthocyanins, and beet-based pigments are widely adopted for coloring confectionery, dairy, and functional beverages. In cosmetics, the clean label movement has led to increased incorporation of natural pigments in lip care, skin tints, and hair dyes. Pharmaceutical use remains relatively niche but steady, focusing on dyes for tablet coatings and pH indicators. Additional applications, including craft materials and eco-conscious household products, contribute to the long-tail demand across smaller categories.
Regional Analysis
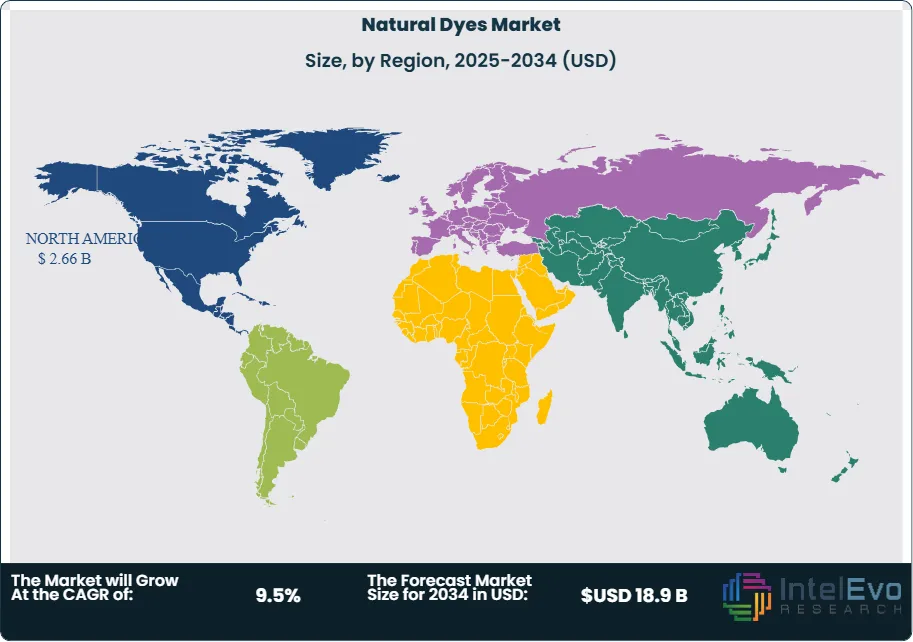
North America held the leading position in 2025, with approximately 35% of the global market share. Regulatory support for sustainable product sourcing, combined with a mature textile and cosmetics industry, has driven strong regional adoption. U.S.-based suppliers and dye processors continue to invest in technology upgrades to meet traceability and performance requirements.
Europe follows closely, contributing around 30% to global revenues. The region benefits from strict environmental compliance frameworks and strong consumer preferences for organic and biodegradable ingredients. Brands operating in Germany, France, and the Nordics are especially active in integrating natural dyes into both food and personal care product lines.
Asia Pacific is the fastest-growing region, with an estimated 25% share in 2025. India and China play dual roles as major suppliers of raw materials and expanding end-use markets. Government-backed initiatives supporting organic textile manufacturing and chemical-free processing are helping accelerate growth. Latin America and the Middle East & Africa remain smaller contributors but are registering steady gains, particularly in textiles, crafts, and plant-based cosmetics driven by local sourcing and regional preferences for natural products.
By Source (Plants, Animals, Others), By Distribution Channel (Retail Stores, Online Channels, Specialty Stores, Others), By Chemical Constitution (Indigoid Dyes, Anthraquinone Dyes, Alpha Naphthoquinones, Flavonoids, Di-Hydropyrans, Anthocyanidins, Carotenoids), By Application (Textiles & Leather, Food and Beverages, Cosmetics, Pharmaceuticals, Others)
Research Methodology
Primary Research- 100 Interviews of Stakeholders
Secondary Research
Desk Research
Regional scope
North America (United States, Canada, Mexico)
Latin America (Brazil, Argentina, Columbia)
East Asia And Pacific (China, Japan, South Korea, Australia, Cambodia, Fiji, Indonesia)
Sea And South Asia (India, Singapore, Thailand, Taiwan, Malaysia)
Eastern Europe (Poland, Russia, Czech Republic, Romania)
Western Europe (Germany, U.K., France, Spain, Itlay)
Middle East & Africa (GCC Countries, Egypt, Nigeria, South Africa, Israel)
Competitive Landscape
BASF SE, DSM N.V., Archroma, Abbey Color Incorporated, Stony Creek Colors, AMA Herbal Group, GNT Group, Aura Herbal Textiles, Maiwa, NIG GmbH, Givaudan, Dohler GmbH, Couleurs DE Plantes
Customization Scope
Customization for segments, region/country-level will be provided. Moreover, additional customization can be done based on the requirements.
Pricing and Purchase Options
Avail customized purchase options to meet your exact research needs. We have three licenses to opt for: Single User License, Multi-User License (Up to 5 Users), Corporate Use License (Unlimited User and Printable PDF).
TABLE OF CONTENTS
1. EXECUTIVE SUMMARY
1.1. MARKET SNAPSHOT
1.2. KEY FINDINGS & INSIGHTS
1.3. ANALYST RECOMMENDATIONS
1.4. FUTURE OUTLOOK
2. RESEARCH METHODOLOGY
2.1. MARKET DEFINITION & SCOPE
2.2. RESEARCH OBJECTIVES: PRIMARY & SECONDARY DATA SOURCES
2.3. DATA COLLECTION SOURCES
2.3.1. COVERAGE OF 100+ PRIMARY RESEARCH/CONSULTATION CALLS WITH INDUSTRY STAKEHOLDERS
FIGURE 17 NORTH AMERICA NATURAL DYES CURRENT AND FUTURE TYPE ANALYSIS, 2025–2034, (USD MILLION)
FIGURE 18 NORTH AMERICA NATURAL DYES CURRENT AND FUTURE END USER ANALYSIS, 2025–2034, (USD MILLION)
FIGURE 19 MARKET SHARE BY COUNTRY
FIGURE 20 LATIN AMERICA NATURAL DYES CURRENT AND FUTURE TYPE ANALYSIS, 2025–2034, (USD MILLION)
FIGURE 21 LATIN AMERICA NATURAL DYES CURRENT AND FUTURE END USER ANALYSIS, 2025–2034, (USD MILLION)
FIGURE 22 MARKET SHARE BY COUNTRY
FIGURE 23 EASTERN EUROPE NATURAL DYES CURRENT AND FUTURE TYPE ANALYSIS, 2025–2034, (USD MILLION)
FIGURE 24 EASTERN EUROPE NATURAL DYES CURRENT AND FUTURE END USER ANALYSIS, 2025–2034, (USD MILLION)
FIGURE 25 MARKET SHARE BY COUNTRY
FIGURE 26 WESTERN EUROPE NATURAL DYES CURRENT AND FUTURE TYPE ANALYSIS, 2025–2034, (USD MILLION)
FIGURE 27 WESTERN EUROPE NATURAL DYES CURRENT AND FUTURE END USER ANALYSIS, 2025–2034, (USD MILLION)
FIGURE 28 MARKET SHARE BY COUNTRY
FIGURE 29 EAST ASIA AND PACIFIC NATURAL DYES CURRENT AND FUTURE TYPE ANALYSIS, 2025–2034, (USD MILLION)
FIGURE 30 EAST ASIA AND PACIFIC NATURAL DYES CURRENT AND FUTURE END USER ANALYSIS, 2025–2034, (USD MILLION)
FIGURE 31 MARKET SHARE BY COUNTRY
FIGURE 32 SEA AND SOUTH ASIA NATURAL DYES CURRENT AND FUTURE TYPE ANALYSIS, 2025–2034, (USD MILLION)
FIGURE 33 SEA AND SOUTH ASIA NATURAL DYES CURRENT AND FUTURE END USER ANALYSIS, 2025–2034, (USD MILLION)
FIGURE 34 MARKET SHARE BY COUNTRY
FIGURE 35 MIDDLE EAST AND AFRICA NATURAL DYES CURRENT AND FUTURE TYPE ANALYSIS, 2025–2034, (USD MILLION)
FIGURE 36 MIDDLE EAST AND AFRICA NATURAL DYES CURRENT AND FUTURE END USER ANALYSIS, 2025–2034, (USD MILLION)
FIGURE 37 NORTH AMERICA NATURAL DYES CURRENT AND FUTURE MARKET VOLUME SHARE REGIONAL ANALYSIS, 2025–2034, (USD MILLION)
FIGURE 38 U.S. NATURAL DYES CURRENT AND FUTURE TYPE ANALYSIS, 2025–2034, (USD MILLION)
FIGURE 39 U.S. NATURAL DYES CURRENT AND FUTURE END USER ANALYSIS, 2025–2034, (USD MILLION)
FIGURE 40 CANADA NATURAL DYES CURRENT AND FUTURE TYPE ANALYSIS, 2025–2034, (USD MILLION)
FIGURE 41 CANADA NATURAL DYES CURRENT AND FUTURE END USER ANALYSIS, 2025–2034, (USD MILLION)
FIGURE 42 LATIN AMERICA NATURAL DYES CURRENT AND FUTURE MARKET VOLUME SHARE REGIONAL ANALYSIS, 2025–2034, (USD MILLION)
FIGURE 43 MEXICO NATURAL DYES CURRENT AND FUTURE TYPE ANALYSIS, 2025–2034, (USD MILLION)
FIGURE 44 MEXICO NATURAL DYES CURRENT AND FUTURE END USER ANALYSIS, 2025–2034, (USD MILLION)
FIGURE 45 BRAZIL NATURAL DYES CURRENT AND FUTURE TYPE ANALYSIS, 2025–2034, (USD MILLION)
FIGURE 46 BRAZIL NATURAL DYES CURRENT AND FUTURE END USER ANALYSIS, 2025–2034, (USD MILLION)
FIGURE 47 ARGENTINA NATURAL DYES CURRENT AND FUTURE TYPE ANALYSIS, 2025–2034, (USD MILLION)
FIGURE 48 ARGENTINA NATURAL DYES CURRENT AND FUTURE END USER ANALYSIS, 2025–2034, (USD MILLION)
FIGURE 49 COLUMBIA NATURAL DYES CURRENT AND FUTURE TYPE ANALYSIS, 2025–2034, (USD MILLION)
FIGURE 50 COLUMBIA NATURAL DYES CURRENT AND FUTURE END USER ANALYSIS, 2025–2034, (USD MILLION)
FIGURE 51 REST OF LATIN AMERICA NATURAL DYES CURRENT AND FUTURE TYPE ANALYSIS, 2025–2034, (USD MILLION)
FIGURE 52 REST OF LATIN AMERICA NATURAL DYES CURRENT AND FUTURE END USER ANALYSIS, 2025–2034, (USD MILLION)
FIGURE 53 EASTERN EUROPE NATURAL DYES CURRENT AND FUTURE MARKET VOLUME SHARE REGIONAL ANALYSIS, 2025–2034, (USD MILLION)
FIGURE 54 POLAND NATURAL DYES CURRENT AND FUTURE TYPE ANALYSIS, 2025–2034, (USD MILLION)
FIGURE 55 POLAND NATURAL DYES CURRENT AND FUTURE END USER ANALYSIS, 2025–2034, (USD MILLION)
FIGURE 56 RUSSIA NATURAL DYES CURRENT AND FUTURE TYPE ANALYSIS, 2025–2034, (USD MILLION)
FIGURE 57 RUSSIA NATURAL DYES CURRENT AND FUTURE END USER ANALYSIS, 2025–2034, (USD MILLION)
FIGURE 58 CZECH REPUBLIC NATURAL DYES CURRENT AND FUTURE TYPE ANALYSIS, 2025–2034, (USD MILLION)
FIGURE 59 CZECH REPUBLIC NATURAL DYES CURRENT AND FUTURE END USER ANALYSIS, 2025–2034, (USD MILLION)
FIGURE 60 ROMANIA NATURAL DYES CURRENT AND FUTURE TYPE ANALYSIS, 2025–2034, (USD MILLION)
FIGURE 61 ROMANIA NATURAL DYES CURRENT AND FUTURE END USER ANALYSIS, 2025–2034, (USD MILLION)
FIGURE 62 REST OF EASTERN EUROPE NATURAL DYES CURRENT AND FUTURE TYPE ANALYSIS, 2025–2034, (USD MILLION)
FIGURE 63 REST OF EASTERN EUROPE NATURAL DYES CURRENT AND FUTURE END USER ANALYSIS, 2025–2034, (USD MILLION)
FIGURE 64 WESTERN EUROPE NATURAL DYES CURRENT AND FUTURE MARKET VOLUME SHARE REGIONAL ANALYSIS, 2025–2034, (USD MILLION)
FIGURE 65 GERMANY NATURAL DYES CURRENT AND FUTURE TYPE ANALYSIS, 2025–2034, (USD MILLION)
FIGURE 66 GERMANY NATURAL DYES CURRENT AND FUTURE END USER ANALYSIS, 2025–2034, (USD MILLION)
FIGURE 67 FRANCE NATURAL DYES CURRENT AND FUTURE TYPE ANALYSIS, 2025–2034, (USD MILLION)
FIGURE 68 FRANCE NATURAL DYES CURRENT AND FUTURE END USER ANALYSIS, 2025–2034, (USD MILLION)
FIGURE 69 UK NATURAL DYES CURRENT AND FUTURE TYPE ANALYSIS, 2025–2034, (USD MILLION)
FIGURE 70 UK NATURAL DYES CURRENT AND FUTURE END USER ANALYSIS, 2025–2034, (USD MILLION)
FIGURE 71 SPAIN NATURAL DYES CURRENT AND FUTURE TYPE ANALYSIS, 2025–2034, (USD MILLION)
FIGURE 72 SPAIN NATURAL DYES CURRENT AND FUTURE END USER ANALYSIS, 2025–2034, (USD MILLION)
FIGURE 73 ITALY NATURAL DYES CURRENT AND FUTURE TYPE ANALYSIS, 2025–2034, (USD MILLION)
FIGURE 74 ITALY NATURAL DYES CURRENT AND FUTURE END USER ANALYSIS, 2025–2034, (USD MILLION)
FIGURE 75 REST OF WESTERN EUROPE NATURAL DYES CURRENT AND FUTURE TYPE ANALYSIS, 2025–2034, (USD MILLION)
FIGURE 76 REST OF WESTERN EUROPE NATURAL DYES CURRENT AND FUTURE END USER ANALYSIS, 2025–2034, (USD MILLION)
FIGURE 77 EAST ASIA AND PACIFIC NATURAL DYES CURRENT AND FUTURE MARKET VOLUME SHARE REGIONAL ANALYSIS, 2025–2034, (USD MILLION)
FIGURE 78 CHINA NATURAL DYES CURRENT AND FUTURE TYPE ANALYSIS, 2025–2034, (USD MILLION)
FIGURE 79 CHINA NATURAL DYES CURRENT AND FUTURE END USER ANALYSIS, 2025–2034, (USD MILLION)
FIGURE 80 JAPAN NATURAL DYES CURRENT AND FUTURE TYPE ANALYSIS, 2025–2034, (USD MILLION)
FIGURE 81 JAPAN NATURAL DYES CURRENT AND FUTURE END USER ANALYSIS, 2025–2034, (USD MILLION)
FIGURE 82 AUSTRALIA NATURAL DYES CURRENT AND FUTURE TYPE ANALYSIS, 2025–2034, (USD MILLION)
FIGURE 83 AUSTRALIA NATURAL DYES CURRENT AND FUTURE END USER ANALYSIS, 2025–2034, (USD MILLION)
FIGURE 84 CAMBODIA NATURAL DYES CURRENT AND FUTURE TYPE ANALYSIS, 2025–2034, (USD MILLION)
FIGURE 85 CAMBODIA NATURAL DYES CURRENT AND FUTURE END USER ANALYSIS, 2025–2034, (USD MILLION)
FIGURE 86 FIJI NATURAL DYES CURRENT AND FUTURE TYPE ANALYSIS, 2025–2034, (USD MILLION)
FIGURE 87 FIJI NATURAL DYES CURRENT AND FUTURE END USER ANALYSIS, 2025–2034, (USD MILLION)
FIGURE 88 INDONESIA NATURAL DYES CURRENT AND FUTURE TYPE ANALYSIS, 2025–2034, (USD MILLION)
FIGURE 89 INDONESIA NATURAL DYES CURRENT AND FUTURE END USER ANALYSIS, 2025–2034, (USD MILLION)
FIGURE 90 SOUTH KOREA NATURAL DYES CURRENT AND FUTURE TYPE ANALYSIS, 2025–2034, (USD MILLION)
FIGURE 91 SOUTH KOREA NATURAL DYES CURRENT AND FUTURE END USER ANALYSIS, 2025–2034, (USD MILLION)
FIGURE 92 REST OF EAST ASIA AND PACIFIC NATURAL DYES CURRENT AND FUTURE TYPE ANALYSIS, 2025–2034, (USD MILLION)
FIGURE 93 REST OF EAST ASIA AND PACIFIC NATURAL DYES CURRENT AND FUTURE END USER ANALYSIS, 2025–2034, (USD MILLION)
FIGURE 94 SEA AND SOUTH ASIA NATURAL DYES CURRENT AND FUTURE MARKET VOLUME SHARE REGIONAL ANALYSIS, 2025–2034, (USD MILLION)
FIGURE 95 BANGLADESH NATURAL DYES CURRENT AND FUTURE TYPE ANALYSIS, 2025–2034, (USD MILLION)
FIGURE 96 BANGLADESH NATURAL DYES CURRENT AND FUTURE END USER ANALYSIS, 2025–2034, (USD MILLION)
FIGURE 97 NEW ZEALAND NATURAL DYES CURRENT AND FUTURE TYPE ANALYSIS, 2025–2034, (USD MILLION)
FIGURE 98 NEW ZEALAND NATURAL DYES CURRENT AND FUTURE END USER ANALYSIS, 2025–2034, (USD MILLION)
FIGURE 99 INDIA NATURAL DYES CURRENT AND FUTURE TYPE ANALYSIS, 2025–2034, (USD MILLION)
FIGURE 100 INDIA NATURAL DYES CURRENT AND FUTURE END USER ANALYSIS, 2025–2034, (USD MILLION)
FIGURE 101 SINGAPORE NATURAL DYES CURRENT AND FUTURE TYPE ANALYSIS, 2025–2034, (USD MILLION)
FIGURE 102 SINGAPORE NATURAL DYES CURRENT AND FUTURE END USER ANALYSIS, 2025–2034, (USD MILLION)
FIGURE 103 THAILAND NATURAL DYES CURRENT AND FUTURE TYPE ANALYSIS, 2025–2034, (USD MILLION)
FIGURE 104 THAILAND NATURAL DYES CURRENT AND FUTURE END USER ANALYSIS, 2025–2034, (USD MILLION)
FIGURE 105 TAIWAN NATURAL DYES CURRENT AND FUTURE TYPE ANALYSIS, 2025–2034, (USD MILLION)
FIGURE 106 TAIWAN NATURAL DYES CURRENT AND FUTURE END USER ANALYSIS, 2025–2034, (USD MILLION)
FIGURE 107 MALAYSIA NATURAL DYES CURRENT AND FUTURE TYPE ANALYSIS, 2025–2034, (USD MILLION)
FIGURE 108 MALAYSIA NATURAL DYES CURRENT AND FUTURE END USER ANALYSIS, 2025–2034, (USD MILLION)
FIGURE 109 REST OF SEA AND SOUTH ASIA NATURAL DYES CURRENT AND FUTURE TYPE ANALYSIS, 2025–2034, (USD MILLION)
FIGURE 110 REST OF SEA AND SOUTH ASIA NATURAL DYES CURRENT AND FUTURE END USER ANALYSIS, 2025–2034, (USD MILLION)
FIGURE 111 MIDDLE EAST AND AFRICA NATURAL DYES CURRENT AND FUTURE MARKET VOLUME SHARE REGIONAL ANALYSIS, 2025–2034, (USD MILLION)
FIGURE 112 GCC COUNTRIES NATURAL DYES CURRENT AND FUTURE TYPE ANALYSIS, 2025–2034, (USD MILLION)
FIGURE 113 GCC COUNTRIES NATURAL DYES CURRENT AND FUTURE END USER ANALYSIS, 2025–2034, (USD MILLION)
FIGURE 114 SAUDI ARABIA NATURAL DYES CURRENT AND FUTURE TYPE ANALYSIS, 2025–2034, (USD MILLION)
FIGURE 115 SAUDI ARABIA NATURAL DYES CURRENT AND FUTURE END USER ANALYSIS, 2025–2034, (USD MILLION)
FIGURE 116 UAE NATURAL DYES CURRENT AND FUTURE TYPE ANALYSIS, 2025–2034, (USD MILLION)
FIGURE 117 UAE NATURAL DYES CURRENT AND FUTURE END USER ANALYSIS, 2025–2034, (USD MILLION)
FIGURE 118 BAHRAIN NATURAL DYES CURRENT AND FUTURE TYPE ANALYSIS, 2025–2034, (USD MILLION)
FIGURE 119 BAHRAIN NATURAL DYES CURRENT AND FUTURE END USER ANALYSIS, 2025–2034, (USD MILLION)
FIGURE 120 KUWAIT NATURAL DYES CURRENT AND FUTURE TYPE ANALYSIS, 2025–2034, (USD MILLION)
FIGURE 121 KUWAIT NATURAL DYES CURRENT AND FUTURE END USER ANALYSIS, 2025–2034, (USD MILLION)
FIGURE 122 OMAN NATURAL DYES CURRENT AND FUTURE TYPE ANALYSIS, 2025–2034, (USD MILLION)
FIGURE 123 OMAN NATURAL DYES CURRENT AND FUTURE END USER ANALYSIS, 2025–2034, (USD MILLION)
FIGURE 124 QATAR NATURAL DYES CURRENT AND FUTURE TYPE ANALYSIS, 2025–2034, (USD MILLION)
FIGURE 125 QATAR NATURAL DYES CURRENT AND FUTURE END USER ANALYSIS, 2025–2034, (USD MILLION)
FIGURE 126 EGYPT NATURAL DYES CURRENT AND FUTURE TYPE ANALYSIS, 2025–2034, (USD MILLION)
FIGURE 127 EGYPT NATURAL DYES CURRENT AND FUTURE END USER ANALYSIS, 2025–2034, (USD MILLION)
FIGURE 128 NIGERIA NATURAL DYES CURRENT AND FUTURE TYPE ANALYSIS, 2025–2034, (USD MILLION)
FIGURE 129 NIGERIA NATURAL DYES CURRENT AND FUTURE END USER ANALYSIS, 2025–2034, (USD MILLION)
FIGURE 130 SOUTH AFRICA NATURAL DYES CURRENT AND FUTURE TYPE ANALYSIS, 2025–2034, (USD MILLION)
FIGURE 131 SOUTH AFRICA NATURAL DYES CURRENT AND FUTURE END USER ANALYSIS, 2025–2034, (USD MILLION)
FIGURE 132 ISRAEL NATURAL DYES CURRENT AND FUTURE TYPE ANALYSIS, 2025–2034, (USD MILLION)
FIGURE 133 ISRAEL NATURAL DYES CURRENT AND FUTURE END USER ANALYSIS, 2025–2034, (USD MILLION)
FIGURE 134 REST OF MEA NATURAL DYES CURRENT AND FUTURE TYPE ANALYSIS, 2025–2034, (USD MILLION)
FIGURE 135 REST OF MEA NATURAL DYES CURRENT AND FUTURE END USER ANALYSIS, 2025–2034, (USD MILLION)
FIGURE 136 U. S. MARKET SHARE ANALYSIS BY TYPE (2024)
FIGURE 137 U. S. MARKET SHARE ANALYSIS BY END USER (2024)
FIGURE 138 CANADA MARKET SHARE ANALYSIS BY TYPE (2024)
FIGURE 139 CANADA MARKET SHARE ANALYSIS BY END USER (2024)
FIGURE 140 MEXICO MARKET SHARE ANALYSIS BY TYPE (2024)
FIGURE 141 MEXICO MARKET SHARE ANALYSIS BY END USER (2024)
FIGURE 142 CHINA MARKET SHARE ANALYSIS BY TYPE (2024)
FIGURE 143 CHINA MARKET SHARE ANALYSIS BY END USER (2024)
FIGURE 144 JAPAN MARKET SHARE ANALYSIS BY TYPE (2024)
FIGURE 145 JAPAN MARKET SHARE ANALYSIS BY END USER (2024)
FIGURE 146 INDIA MARKET SHARE ANALYSIS BY TYPE (2024)
FIGURE 147 INDIA MARKET SHARE ANALYSIS BY END USER (2024)
FIGURE 148 SOUTH KOREA MARKET SHARE ANALYSIS BY TYPE (2024)
FIGURE 149 SOUTH KOREA MARKET SHARE ANALYSIS BY END USER (2024)
FIGURE 150 SAUDI ARABIA MARKET SHARE ANALYSIS BY TYPE (2024)
FIGURE 151 SAUDI ARABIA MARKET SHARE ANALYSIS BY END USER (2024)
FIGURE 152 UAE MARKET SHARE ANALYSIS BY TYPE (2024)
FIGURE 153 UAE MARKET SHARE ANALYSIS BY END USER (2024)
FIGURE 154 EGYPT MARKET SHARE ANALYSIS BY TYPE (2024)
FIGURE 155 EGYPT MARKET SHARE ANALYSIS BY END USER (2024)
FIGURE 156 NIGERIA MARKET SHARE ANALYSIS BY TYPE (2024)
FIGURE 157 NIGERIA MARKET SHARE ANALYSIS BY END USER (2024)
FIGURE 158 SOUTH AFRICA MARKET SHARE ANALYSIS BY TYPE (2024)
FIGURE 159 SOUTH AFRICA MARKET SHARE ANALYSIS BY END USER (2024)
FIGURE 160 GERMANY MARKET SHARE ANALYSIS BY TYPE (2024)
FIGURE 161 GERMANY MARKET SHARE ANALYSIS BY END USER (2024)
FIGURE 162 FRANCE MARKET SHARE ANALYSIS BY TYPE (2024)
FIGURE 163 FRANCE MARKET SHARE ANALYSIS BY END USER (2024)
FIGURE 164 UK MARKET SHARE ANALYSIS BY TYPE (2024)
FIGURE 165 UK MARKET SHARE ANALYSIS BY END USER (2024)
FIGURE 166 SPAIN MARKET SHARE ANALYSIS BY TYPE (2024)
FIGURE 167 SPAIN MARKET SHARE ANALYSIS BY END USER (2024)
FIGURE 168 ITALY MARKET SHARE ANALYSIS BY TYPE (2024)
FIGURE 169 ITALY MARKET SHARE ANALYSIS BY END USER (2024)
FIGURE 170 BRAZIL MARKET SHARE ANALYSIS BY TYPE (2024)
FIGURE 171 BRAZIL MARKET SHARE ANALYSIS BY END USER (2024)
FIGURE 172 ARGENTINA MARKET SHARE ANALYSIS BY TYPE (2024)
FIGURE 173 ARGENTINA MARKET SHARE ANALYSIS BY END USER (2024)
FIGURE 174 COLUMBIA MARKET SHARE ANALYSIS BY TYPE (2024)
FIGURE 175 COLUMBIA MARKET SHARE ANALYSIS BY END USER (2024)
FIGURE 176 GLOBAL NATURAL DYES CURRENT AND FUTURE MARKET KEY COUNTRY LEVEL ANALYSIS, 2024–2034, (USD MILLION)
FIGURE 177 FINANCIAL OVERVIEW:
Key Player Analysis
Abbey Color Inc: Abbey Color Inc is positioned as a specialist supplier in the natural dyes market, with a long-standing presence in high-purity dyes for industrial, biomedical, and textile applications. The company operates primarily in North America and serves both bulk manufacturing clients and niche artisan producers. In 2025, Abbey expanded its extraction capacity for plant-based pigments, targeting increased demand from the personal care and organic food sectors. Its core strength lies in vertically integrated production and strict quality control standards, which are critical in high-sensitivity applications such as pharmaceuticals and medical diagnostics.
The company’s differentiated value proposition centers on technical-grade colorants that meet regulatory requirements across multiple industries. With increased scrutiny around chemical safety and labeling transparency, Abbey’s ability to deliver traceable, tested natural dyes positions it well in compliance-driven sectors. Its partnerships with research institutions have also contributed to advancements in dye stability and solubility, helping it compete beyond traditional textile applications.
AMA Herbal Laboratories: AMA Herbal Laboratories is recognized as a leading manufacturer of natural textile dyes in India and has expanded its global footprint over the past five years. The company holds a strong market position in the GOTS-certified dye category, supplying major export houses and sustainable fashion brands. Its flagship products include plant-based dye powders and liquid extracts derived from sources such as indigo, madder, and pomegranate rind. As of 2025, AMA operates distribution networks across Europe, the U.S., and Southeast Asia, supported by its ISO-certified manufacturing units.
The firm’s growth strategy includes backward integration into organic farming and forward linkages with textile processors to ensure quality and scalability. AMA also invests in bio-extraction technologies to reduce water consumption and improve yield, aligning with global sustainability benchmarks. With the increasing demand for chemical-free textile solutions, AMA’s comprehensive value chain control gives it a pricing and supply reliability advantage.
Aura Herbal Textiles: Aura Herbal Textiles functions as a vertically integrated niche player, offering GOTS-compliant fabric and garment dyeing services using 100% plant-based dyes. Based in India, the company targets the premium textile export market, working closely with ethical fashion brands in Europe and North America. Its operations span from organic farming of dye plants to in-house processing and finishing, allowing strict oversight on environmental impact and product traceability.
In 2025, Aura expanded its capabilities with a new solar-powered dyeing unit, reducing energy use by over 40%. The company’s competitive edge lies in its ability to deliver fully sustainable collections at small and medium batch scales. Its close collaboration with designers and sustainable labels enables product customization, which appeals to emerging brands seeking authenticity and traceable supply chains.
Maiwa: Maiwa is positioned as a boutique producer and educational advocate for natural dye use, with a focus on artisanal and small-batch markets. Headquartered in Canada, the company combines retail, workshops, and raw material supply, creating a unique blend of commerce and community engagement. Maiwa sources dye materials from traditional producers across South Asia and Africa and has built long-term trade partnerships based on transparency and fair compensation.
While not a high-volume supplier, Maiwa influences industry standards through knowledge dissemination and advocacy. In 2025, it expanded its online course offerings and digital dye libraries, which have been adopted by craft-focused textile schools and independent studios. Its emphasis on cultural preservation, ethical sourcing, and consumer education sets it apart in a market increasingly influenced by sustainability narratives and transparent sourcing.
Market Key Players
BASF SE
DSM N.V.
Archroma
Abbey Color Incorporated
Aura Herbal Textiles
Maiwa
Stony Creek Colors
AMA Herbal Group
GNT Group
NIG GmbH
Givaudan
Dohler GmbH
Couleurs DE Plantes
Driver:
Sustainability Regulations Accelerate Shift to Natural Dyes
As of 2025, sustainability-led product sourcing has become a central focus across multiple industries, particularly textiles, food, and personal care. Natural dyes are gaining ground as a viable alternative to synthetic colorants, which are linked to environmental harm and toxic waste discharge. The global textile dyeing and finishing sector, responsible for an estimated 20% of industrial water pollution, is under increased pressure to comply with environmental regulations. This shift is accelerating the adoption of plant- and mineral-based dyes, especially in eco-certified product lines.
Consumer demand is reinforcing this transition. A growing base of environmentally conscious buyers is opting for non-toxic, biodegradable ingredients in everyday products. As organic product consumption expands—projected to exceed USD 320 billion globally by 2030—the need for clean-label inputs like natural dyes will intensify. For manufacturers, this creates both a compliance requirement and a product differentiation opportunity.
Restraint:
Cost and Performance Advantages Sustain Synthetic Dye Dominance
Synthetic dyes continue to dominate over 90% of the global dye market due to their cost-efficiency, scalability, and consistent performance. Natural dyes, while environmentally preferable, struggle to match synthetic counterparts on price and operational flexibility. Production costs for natural dyes are typically 5 to 10 times higher, driven by raw material variability, labor intensity, and seasonal sourcing.
These limitations are particularly acute in high-volume manufacturing environments, where reliability and uniformity are critical. In addition, the fragmented nature of natural dye supply chains complicates procurement, especially in regions lacking integrated agricultural-processing infrastructure. As long as synthetic dyes maintain their economic and operational advantages, natural alternatives will remain confined to premium or regulated market segments.
Opportunity:
Expanding Textile Output Creates Growth Path for Natural Dyes
The growing demand for sustainable inputs in the textile industry presents a clear expansion path for natural dyes. Global textile output continues to rise, particularly in Asia Pacific, where both export-driven manufacturing and domestic consumption are growing. As brands target net-zero supply chains and circular economy models, natural dyes are being incorporated into certified organic textiles, recycled fabrics, and luxury apparel lines.
Diversification into Clean Beauty and Organic Food Applications
At the same time, the clean beauty and organic food sectors are increasing their use of botanical colorants. Natural dyes are gaining adoption in haircare, skincare, and plant-based foods as a replacement for synthetic pigments. This diversification of application areas, coupled with improved processing technology, is expected to drive CAGR above 11% through 2033. Market players that can ensure scale, quality, and traceability stand to gain from this shift.
Trend:
Advanced Extraction Technologies Improve Yield and Consistency
In 2025, technology is reshaping natural dye production. Emerging techniques such as enzyme-assisted extraction, microwave-assisted synthesis, and supercritical fluid processing are improving dye yield, reducing waste, and enhancing color stability. These methods are helping natural dyes meet industrial requirements for batch consistency, a longstanding barrier to broader adoption.
Another trend reshaping the sector is the growing use of natural dyes in personal care products. Clean-label trends and consumer sensitivity to synthetic additives are pushing cosmetic and skincare brands toward plant-based ingredients. Major players in the sector have launched product lines using natural pigments in lipsticks, foundations, and shampoos. This convergence of technology and consumer health preference is expanding the application scope for natural dyes and creating new growth fronts beyond traditional textile usage.
Recent Developments
Dec 2024 – AMA Herbal Laboratories: AMA announced a partnership with two Indian agricultural cooperatives to secure long-term supply of organic indigo and madder roots. The agreement is expected to increase raw material availability by 30% over the next three years. This move strengthens supply chain stability and supports scale-up for export contracts in Europe and North America.
Feb 2025 – Abbey Color Inc: Abbey Color launched a new line of pharmaceutical-grade botanical dyes for use in capsule coatings and diagnostics. The product line is designed to comply with US FDA and EU EFSA standards and targets high-margin applications in the health sector. This diversification supports revenue growth outside textiles and reinforces its position in regulated industries.
Apr 2025 – Aura Herbal Textiles: Aura commissioned a new solar-powered dyeing facility in Gujarat, India, with a capacity to process 1,000 tons of fabric annually. The facility reduces energy use by 40% and water consumption by 25% compared to conventional operations. The investment enhances Aura’s competitiveness in low-impact textile production and supports premium brand partnerships.
Jul 2025 – Maiwa: Maiwa expanded its artisanal dye material exports into Japan and South Korea through a new distributor agreement. The expansion targets the craft and educational segments, which have shown double-digit growth in East Asia. This development extends Maiwa’s reach into emerging premium markets and supports small-batch producers in the region.
Sep 2025 – Archroma (new entrant): Specialty chemicals firm Archroma entered the natural dyes segment with a line of bio-based dyes under the “Earthshade” brand. The launch includes formulations for apparel and home textiles, with initial production set up in Bangladesh. This signals increased competition from global players and pressure on existing suppliers to scale and differentiate.