Global Nephrostomy Bags Market Size, Share & Medical Devices Analysis By Product Type, By Material, By Usage (Short-Term, Long-Term), By End User (Hospitals, Homecare), Urology Trends, Regional Healthcare Demand & Forecast 2025–2034
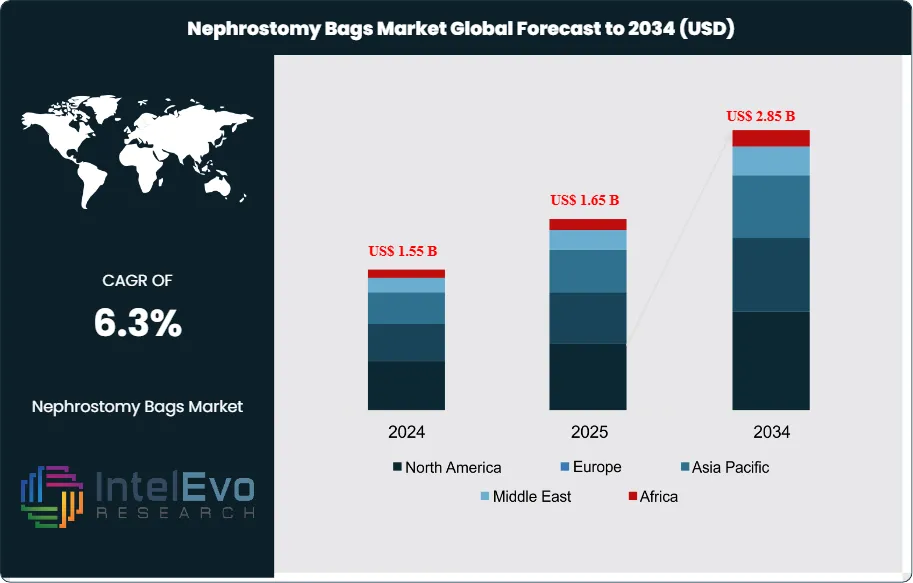
The Nephrostomy Bags Market is estimated at US$ 1.55 billion in 2024 and is projected to reach approximately US$ 2.85 billion by 2034, registering a CAGR of about 6.3% during 2025–2034. Growth is driven by the rising prevalence of chronic kidney disease, urological cancers, and obstructive uropathy, alongside increasing volumes of minimally invasive nephrostomy procedures. Expanding geriatric populations, longer post-operative care durations, and growing adoption of home healthcare are sustaining recurring demand for drainage accessories. In addition, product innovations focused on anti-reflux valves, improved patient comfort, and infection control are enhancing replacement cycles and supporting steady market expansion over the forecast period.
Steady procedure volumes in urology and oncology, an older patient base, and longer survival with chronic disease keep demand stable. The market expanded at an estimated 3 to 4% annually from 2019 to 2023; hospitals normalized purchasing after pandemic-era deferrals and home care gained share. You should plan for incremental unit growth and modest price uplift tied to premium features.
Prevalence trends support uptake. About 10% of adults globally live with chronic kidney disease; in the United States more than 37 million adults have CKD. Diabetes and hypertension drive obstruction and infection risk; the global diabetes population exceeded 500 million adults in 2021 and continues to rise. Stone disease remains common; roughly 1 in 10 people in the United States will form a kidney stone in their lifetime. Infection control is central to product selection. The CDC’s National Healthcare Safety Network reports urinary tract infections account for about 32% of all healthcare-associated infections in U.S. hospitals, many linked to catheter use including nephrostomy tubes.
Manufacturers differentiate on comfort and safety. Anti-reflux valves, odour filtration, kink-resistant tubing, soft backings, and skin-friendly adhesives raise adherence in home settings. Antimicrobial coatings and closed-system connectors reduce manipulation. Material shifts to PVC-free and DEHP-free designs are underway to meet hospital sustainability goals. In hospitals, digital purchasing and barcoding support lot traceability; in critical care, connected urine output monitors interface with standard drainage systems to log volumes in electronic records.
Regulatory and cost factors shape supply. Products are typically Class II devices in the United States cleared via 510(k); in Europe, MDR tightening increases documentation costs. Ethylene oxide sterilization limits and emissions controls can strain throughput. Public tenders compress pricing; reimbursement caps limit premium mix in some markets. Complications such as leakage, skin breakdown, and infection remain practical risks.
North America leads with an estimated 35% revenue share, supported by high procedure rates and broad reimbursement. Western Europe follows at about 28%. Asia Pacific is the fastest growing at roughly 5 to 6% CAGR, with China and India expanding urology capacity and home care distribution. Watch investment in outpatient urology centers, home health channels, and PVC-free product lines if you target above-market growth.
Key Takeaways
Market Growth: The market reached US$ 1.55 billion in 2024 and will rise to US$ 2.85 billion by 2034 at 6.3% CAGR. Growth tracks CKD prevalence, aging populations, diabetes and stone procedures, and the shift to home care.
Sterility: Sterile bags held 85.02% revenue share in 2024. Hospital protocols and infection reduction targets keep sterile use the default in acute and post-acute settings.
End Use: Hospitals and clinics accounted for 56.22% of revenue in 2024. Centralized purchasing, reimbursement coverage, and higher procedure volumes sustain this lead.
Driver: CKD affects about 10% of adults globally and over 37 million adults in the United States. The CDC’s network reports UTIs make up 32% of hospital-acquired infections, reinforcing demand for anti-reflux, closed systems, and sterile disposables.
Restraint: Public tenders and GPO contracts compress average selling prices by 5–10%. EU MDR documentation and ethylene oxide sterilization limits increase compliance costs and lengthen release cycles.
Opportunity: Asia Pacific is set to grow at 5–6% CAGR through 2034, adding an estimated USD 150–180 million. You can target China and India outpatient urology centers and home health distributors for above-market gains.
Trend: Disposables dominate at 78.12% share, while 500–1000 ml bags lead capacity with 55.55%. Vendors are scaling antimicrobial coatings, anti-reflux valves, and connected urine output monitoring; BD, Teleflex, Smiths Medical, Coloplast, ConvaTec, and B. Braun expanded portfolios and 510(k) clearances.
Regional Analysis: North America leads with about 35% revenue share; Western Europe follows at roughly 28%. Asia Pacific is the fastest growing; Latin America and the Middle East and Africa expand with tender-backed procurement and rising urology capacity.
Type Analysis
Sterile systems remain the default standard in 2025. They accounted for an estimated 85–86% of global revenue, up marginally from 85.02% in 2024. Hospitals and payers tie purchasing to infection control metrics; you see sterile-only protocols across perioperative and post-acute pathways. The CDC reports urinary tract infections comprise about 32% of hospital-acquired infections in the United States. That keeps sterile collections embedded in order sets for nephrostomy tube care.
Non-sterile products retain a role in low-risk exchanges and select home settings, but their share continues to narrow. Aging demographics and higher stone and oncology caseloads shift volume to sterile kits with anti-reflux valves and closed connectors. Vendors such as BD, Coloplast, ConvaTec, Teleflex, B. Braun, and Hollister emphasize sterile configurations with barcoded components for traceability.
Usage Analysis
Disposable bags lead with an estimated 78–79% share in 2025 versus 78.12% in 2024. They lower cross-contamination risk, reduce handling, and remove reprocessing costs. Purchasing data in tenders shows single-use products win on total cost where labor, utilities, and validation for sterilization add 20–30 minutes per cycle per item. This aligns with infection prevention targets in high-volume centers.
Reusable systems serve long-term users in constrained budgets and select homecare programs. Silicone-based designs extend life, but adherence hinges on training and cleaning compliance. Where group purchasing contracts squeeze average selling prices by 5–10%, disposables still hold the economic edge for short stays and transitions to home.
Capacity Analysis
The 500–1000 ml range remains the most utilized configuration with about 55–56% share in 2025, matching 55.55% in 2024. It balances mobility and dwell time; fewer emptying events improve caregiver efficiency. Typical urine output targets of 0.5–1.0 ml per kg per hour translate to 840–1680 ml per day for a 70 kg adult. That makes mid-capacity bags suitable for most ward and home scenarios.
Bags of 100–500 ml support ambulatory patients and short ambulatory procedures. Above 1000 ml suits overnight use, high-output states, and limited mobility. Providers standardize on mixed inventories to match acuity and mobility, but mid-capacity SKUs anchor formularies due to broad clinical fit.
Material Analysis
PVC and PU-based bags retain the largest material share at about 45% in 2025, in line with 45.15% in 2024. These polymers deliver clarity, weld strength, and reliable seals for single-use applications. Hospitals still procure PVC for price and performance, while shifting to DEHP-free formulations to meet internal safety policies.
Silicone gains incremental share on biocompatibility and softness, especially in reusable lines and premium disposables. Sustainability programs in Europe and parts of North America encourage PVC-free alternatives; you should expect silicone and TPE variants to add 150–200 basis points of mix by 2030. Supply chains continue to adjust to sterilization capacity limits and emissions rules for ethylene oxide, which influence material and packaging choices.
End-User Analysis
Hospitals and clinics accounted for roughly 56–57% of revenue in 2025, consistent with 56.22% in 2024. Higher procedure volumes, centralized procurement, and reimbursement coverage sustain their lead. Acute settings prefer sterile, disposable systems to meet audit requirements and reduce device-associated infection rates.
Homecare is the fastest-growing end-user channel as health systems expand hospital-at-home and post-acute programs. You see rising demand for discreet designs, skin-friendly adhesives, and secure connectors to cut leakage events. Ambulatory surgical centers add share in the United States as payers shift appropriate urology cases to outpatient sites, improving throughput with single-use kits.
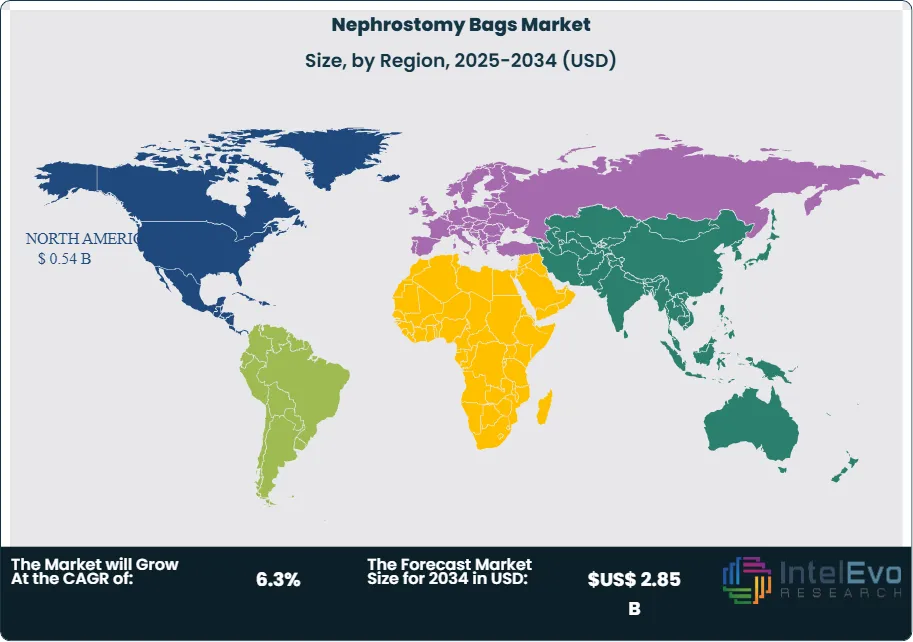
Regional Analysis
North America holds the top revenue position at about 35% in 2025, supported by high CKD prevalence, strong reimbursement, and broad access to urology services. The United States reports kidney stone prevalence near 8.8% in adults, or about 1 in 11, and over 600,000 new stone cases annually. These clinical loads support steady device utilization in inpatient and outpatient settings.
Western Europe follows at roughly 27–28% with stable replacement demand and strict procurement tied to MDR documentation. Asia Pacific is the fastest-growing region with a projected 5–6% CAGR through 2030. China and India expand urology capacity and home health distribution, adding meaningful volumes in tier 2 and tier 3 cities. Latin America and the Middle East and Africa grow from a lower base through public tenders and private hospital investments; price sensitivity favors PVC-based disposables, while leading private chains pilot PVC-free lines to meet sustainability goals.
Type (Sterile, Non-sterile), Usage (Disposable, Reusable), Capacity (100-500 ml, 500-1000 ml, Above 1000 ml), Material (PVC and PU, Silicone, Others), End-User (Hospitals & Clinics, Homecare, Ambulatory Surgical Centers, Others)
Research Methodology
Primary Research- 100 Interviews of Stakeholders
Secondary Research
Desk Research
Regional scope
North America (United States, Canada, Mexico)
Latin America (Brazil, Argentina, Columbia)
East Asia And Pacific (China, Japan, South Korea, Australia, Cambodia, Fiji, Indonesia)
Sea And South Asia (India, Singapore, Thailand, Taiwan, Malaysia)
Eastern Europe (Poland, Russia, Czech Republic, Romania)
Western Europe (Germany, U.K., France, Spain, Itlay)
Middle East & Africa (GCC Countries, Egypt, Nigeria, South Africa, Israel)
Competitive Landscape
Urocare Products, Inc., Teleflex Incorporated, TERUMO Corporation, Cardinal Health, Inc., Merit Medical, Coloplast A/S, Becton, Dickinson and Company, Remington Medical, B. Braun SE, UreSil, LLC
Customization Scope
Customization for segments, region/country-level will be provided. Moreover, additional customization can be done based on the requirements.
Pricing and Purchase Options
Avail customized purchase options to meet your exact research needs. We have three licenses to opt for: Single User License, Multi-User License (Up to 5 Users), Corporate Use License (Unlimited User and Printable PDF).
TABLE OF CONTENTS
1. EXECUTIVE SUMMARY
1.1. MARKET SNAPSHOT
1.2. KEY FINDINGS & INSIGHTS
1.3. ANALYST RECOMMENDATIONS
1.4. FUTURE OUTLOOK
2. RESEARCH METHODOLOGY
2.1. MARKET DEFINITION & SCOPE
2.2. RESEARCH OBJECTIVES: PRIMARY & SECONDARY DATA SOURCES
2.3. DATA COLLECTION SOURCES
2.3.1. COVERAGE OF 100+ PRIMARY RESEARCH/CONSULTATION CALLS WITH INDUSTRY STAKEHOLDERS
FIGURE 17 NORTH AMERICA NEPHROSTOMY BAGS CURRENT AND FUTURE TYPE ANALYSIS, 2025–2034, (USD MILLION)
FIGURE 18 NORTH AMERICA NEPHROSTOMY BAGS CURRENT AND FUTURE END USER ANALYSIS, 2025–2034, (USD MILLION)
FIGURE 19 MARKET SHARE BY COUNTRY
FIGURE 20 LATIN AMERICA NEPHROSTOMY BAGS CURRENT AND FUTURE TYPE ANALYSIS, 2025–2034, (USD MILLION)
FIGURE 21 LATIN AMERICA NEPHROSTOMY BAGS CURRENT AND FUTURE END USER ANALYSIS, 2025–2034, (USD MILLION)
FIGURE 22 MARKET SHARE BY COUNTRY
FIGURE 23 EASTERN EUROPE NEPHROSTOMY BAGS CURRENT AND FUTURE TYPE ANALYSIS, 2025–2034, (USD MILLION)
FIGURE 24 EASTERN EUROPE NEPHROSTOMY BAGS CURRENT AND FUTURE END USER ANALYSIS, 2025–2034, (USD MILLION)
FIGURE 25 MARKET SHARE BY COUNTRY
FIGURE 26 WESTERN EUROPE NEPHROSTOMY BAGS CURRENT AND FUTURE TYPE ANALYSIS, 2025–2034, (USD MILLION)
FIGURE 27 WESTERN EUROPE NEPHROSTOMY BAGS CURRENT AND FUTURE END USER ANALYSIS, 2025–2034, (USD MILLION)
FIGURE 28 MARKET SHARE BY COUNTRY
FIGURE 29 EAST ASIA AND PACIFIC NEPHROSTOMY BAGS CURRENT AND FUTURE TYPE ANALYSIS, 2025–2034, (USD MILLION)
FIGURE 30 EAST ASIA AND PACIFIC NEPHROSTOMY BAGS CURRENT AND FUTURE END USER ANALYSIS, 2025–2034, (USD MILLION)
FIGURE 31 MARKET SHARE BY COUNTRY
FIGURE 32 SEA AND SOUTH ASIA NEPHROSTOMY BAGS CURRENT AND FUTURE TYPE ANALYSIS, 2025–2034, (USD MILLION)
FIGURE 33 SEA AND SOUTH ASIA NEPHROSTOMY BAGS CURRENT AND FUTURE END USER ANALYSIS, 2025–2034, (USD MILLION)
FIGURE 34 MARKET SHARE BY COUNTRY
FIGURE 35 MIDDLE EAST AND AFRICA NEPHROSTOMY BAGS CURRENT AND FUTURE TYPE ANALYSIS, 2025–2034, (USD MILLION)
FIGURE 36 MIDDLE EAST AND AFRICA NEPHROSTOMY BAGS CURRENT AND FUTURE END USER ANALYSIS, 2025–2034, (USD MILLION)
FIGURE 37 NORTH AMERICA NEPHROSTOMY BAGS CURRENT AND FUTURE MARKET VOLUME SHARE REGIONAL ANALYSIS, 2025–2034, (USD MILLION)
FIGURE 38 U.S. NEPHROSTOMY BAGS CURRENT AND FUTURE TYPE ANALYSIS, 2025–2034, (USD MILLION)
FIGURE 39 U.S. NEPHROSTOMY BAGS CURRENT AND FUTURE END USER ANALYSIS, 2025–2034, (USD MILLION)
FIGURE 40 CANADA NEPHROSTOMY BAGS CURRENT AND FUTURE TYPE ANALYSIS, 2025–2034, (USD MILLION)
FIGURE 41 CANADA NEPHROSTOMY BAGS CURRENT AND FUTURE END USER ANALYSIS, 2025–2034, (USD MILLION)
FIGURE 42 LATIN AMERICA NEPHROSTOMY BAGS CURRENT AND FUTURE MARKET VOLUME SHARE REGIONAL ANALYSIS, 2025–2034, (USD MILLION)
FIGURE 43 MEXICO NEPHROSTOMY BAGS CURRENT AND FUTURE TYPE ANALYSIS, 2025–2034, (USD MILLION)
FIGURE 44 MEXICO NEPHROSTOMY BAGS CURRENT AND FUTURE END USER ANALYSIS, 2025–2034, (USD MILLION)
FIGURE 45 BRAZIL NEPHROSTOMY BAGS CURRENT AND FUTURE TYPE ANALYSIS, 2025–2034, (USD MILLION)
FIGURE 46 BRAZIL NEPHROSTOMY BAGS CURRENT AND FUTURE END USER ANALYSIS, 2025–2034, (USD MILLION)
FIGURE 47 ARGENTINA NEPHROSTOMY BAGS CURRENT AND FUTURE TYPE ANALYSIS, 2025–2034, (USD MILLION)
FIGURE 48 ARGENTINA NEPHROSTOMY BAGS CURRENT AND FUTURE END USER ANALYSIS, 2025–2034, (USD MILLION)
FIGURE 49 COLUMBIA NEPHROSTOMY BAGS CURRENT AND FUTURE TYPE ANALYSIS, 2025–2034, (USD MILLION)
FIGURE 50 COLUMBIA NEPHROSTOMY BAGS CURRENT AND FUTURE END USER ANALYSIS, 2025–2034, (USD MILLION)
FIGURE 51 REST OF LATIN AMERICA NEPHROSTOMY BAGS CURRENT AND FUTURE TYPE ANALYSIS, 2025–2034, (USD MILLION)
FIGURE 52 REST OF LATIN AMERICA NEPHROSTOMY BAGS CURRENT AND FUTURE END USER ANALYSIS, 2025–2034, (USD MILLION)
FIGURE 53 EASTERN EUROPE NEPHROSTOMY BAGS CURRENT AND FUTURE MARKET VOLUME SHARE REGIONAL ANALYSIS, 2025–2034, (USD MILLION)
FIGURE 54 POLAND NEPHROSTOMY BAGS CURRENT AND FUTURE TYPE ANALYSIS, 2025–2034, (USD MILLION)
FIGURE 55 POLAND NEPHROSTOMY BAGS CURRENT AND FUTURE END USER ANALYSIS, 2025–2034, (USD MILLION)
FIGURE 56 RUSSIA NEPHROSTOMY BAGS CURRENT AND FUTURE TYPE ANALYSIS, 2025–2034, (USD MILLION)
FIGURE 57 RUSSIA NEPHROSTOMY BAGS CURRENT AND FUTURE END USER ANALYSIS, 2025–2034, (USD MILLION)
FIGURE 58 CZECH REPUBLIC NEPHROSTOMY BAGS CURRENT AND FUTURE TYPE ANALYSIS, 2025–2034, (USD MILLION)
FIGURE 59 CZECH REPUBLIC NEPHROSTOMY BAGS CURRENT AND FUTURE END USER ANALYSIS, 2025–2034, (USD MILLION)
FIGURE 60 ROMANIA NEPHROSTOMY BAGS CURRENT AND FUTURE TYPE ANALYSIS, 2025–2034, (USD MILLION)
FIGURE 61 ROMANIA NEPHROSTOMY BAGS CURRENT AND FUTURE END USER ANALYSIS, 2025–2034, (USD MILLION)
FIGURE 62 REST OF EASTERN EUROPE NEPHROSTOMY BAGS CURRENT AND FUTURE TYPE ANALYSIS, 2025–2034, (USD MILLION)
FIGURE 63 REST OF EASTERN EUROPE NEPHROSTOMY BAGS CURRENT AND FUTURE END USER ANALYSIS, 2025–2034, (USD MILLION)
FIGURE 64 WESTERN EUROPE NEPHROSTOMY BAGS CURRENT AND FUTURE MARKET VOLUME SHARE REGIONAL ANALYSIS, 2025–2034, (USD MILLION)
FIGURE 65 GERMANY NEPHROSTOMY BAGS CURRENT AND FUTURE TYPE ANALYSIS, 2025–2034, (USD MILLION)
FIGURE 66 GERMANY NEPHROSTOMY BAGS CURRENT AND FUTURE END USER ANALYSIS, 2025–2034, (USD MILLION)
FIGURE 67 FRANCE NEPHROSTOMY BAGS CURRENT AND FUTURE TYPE ANALYSIS, 2025–2034, (USD MILLION)
FIGURE 68 FRANCE NEPHROSTOMY BAGS CURRENT AND FUTURE END USER ANALYSIS, 2025–2034, (USD MILLION)
FIGURE 69 UK NEPHROSTOMY BAGS CURRENT AND FUTURE TYPE ANALYSIS, 2025–2034, (USD MILLION)
FIGURE 70 UK NEPHROSTOMY BAGS CURRENT AND FUTURE END USER ANALYSIS, 2025–2034, (USD MILLION)
FIGURE 71 SPAIN NEPHROSTOMY BAGS CURRENT AND FUTURE TYPE ANALYSIS, 2025–2034, (USD MILLION)
FIGURE 72 SPAIN NEPHROSTOMY BAGS CURRENT AND FUTURE END USER ANALYSIS, 2025–2034, (USD MILLION)
FIGURE 73 ITALY NEPHROSTOMY BAGS CURRENT AND FUTURE TYPE ANALYSIS, 2025–2034, (USD MILLION)
FIGURE 74 ITALY NEPHROSTOMY BAGS CURRENT AND FUTURE END USER ANALYSIS, 2025–2034, (USD MILLION)
FIGURE 75 REST OF WESTERN EUROPE NEPHROSTOMY BAGS CURRENT AND FUTURE TYPE ANALYSIS, 2025–2034, (USD MILLION)
FIGURE 76 REST OF WESTERN EUROPE NEPHROSTOMY BAGS CURRENT AND FUTURE END USER ANALYSIS, 2025–2034, (USD MILLION)
FIGURE 77 EAST ASIA AND PACIFIC NEPHROSTOMY BAGS CURRENT AND FUTURE MARKET VOLUME SHARE REGIONAL ANALYSIS, 2025–2034, (USD MILLION)
FIGURE 78 CHINA NEPHROSTOMY BAGS CURRENT AND FUTURE TYPE ANALYSIS, 2025–2034, (USD MILLION)
FIGURE 79 CHINA NEPHROSTOMY BAGS CURRENT AND FUTURE END USER ANALYSIS, 2025–2034, (USD MILLION)
FIGURE 80 JAPAN NEPHROSTOMY BAGS CURRENT AND FUTURE TYPE ANALYSIS, 2025–2034, (USD MILLION)
FIGURE 81 JAPAN NEPHROSTOMY BAGS CURRENT AND FUTURE END USER ANALYSIS, 2025–2034, (USD MILLION)
FIGURE 82 AUSTRALIA NEPHROSTOMY BAGS CURRENT AND FUTURE TYPE ANALYSIS, 2025–2034, (USD MILLION)
FIGURE 83 AUSTRALIA NEPHROSTOMY BAGS CURRENT AND FUTURE END USER ANALYSIS, 2025–2034, (USD MILLION)
FIGURE 84 CAMBODIA NEPHROSTOMY BAGS CURRENT AND FUTURE TYPE ANALYSIS, 2025–2034, (USD MILLION)
FIGURE 85 CAMBODIA NEPHROSTOMY BAGS CURRENT AND FUTURE END USER ANALYSIS, 2025–2034, (USD MILLION)
FIGURE 86 FIJI NEPHROSTOMY BAGS CURRENT AND FUTURE TYPE ANALYSIS, 2025–2034, (USD MILLION)
FIGURE 87 FIJI NEPHROSTOMY BAGS CURRENT AND FUTURE END USER ANALYSIS, 2025–2034, (USD MILLION)
FIGURE 88 INDONESIA NEPHROSTOMY BAGS CURRENT AND FUTURE TYPE ANALYSIS, 2025–2034, (USD MILLION)
FIGURE 89 INDONESIA NEPHROSTOMY BAGS CURRENT AND FUTURE END USER ANALYSIS, 2025–2034, (USD MILLION)
FIGURE 90 SOUTH KOREA NEPHROSTOMY BAGS CURRENT AND FUTURE TYPE ANALYSIS, 2025–2034, (USD MILLION)
FIGURE 91 SOUTH KOREA NEPHROSTOMY BAGS CURRENT AND FUTURE END USER ANALYSIS, 2025–2034, (USD MILLION)
FIGURE 92 REST OF EAST ASIA AND PACIFIC NEPHROSTOMY BAGS CURRENT AND FUTURE TYPE ANALYSIS, 2025–2034, (USD MILLION)
FIGURE 93 REST OF EAST ASIA AND PACIFIC NEPHROSTOMY BAGS CURRENT AND FUTURE END USER ANALYSIS, 2025–2034, (USD MILLION)
FIGURE 94 SEA AND SOUTH ASIA NEPHROSTOMY BAGS CURRENT AND FUTURE MARKET VOLUME SHARE REGIONAL ANALYSIS, 2025–2034, (USD MILLION)
FIGURE 95 BANGLADESH NEPHROSTOMY BAGS CURRENT AND FUTURE TYPE ANALYSIS, 2025–2034, (USD MILLION)
FIGURE 96 BANGLADESH NEPHROSTOMY BAGS CURRENT AND FUTURE END USER ANALYSIS, 2025–2034, (USD MILLION)
FIGURE 97 NEW ZEALAND NEPHROSTOMY BAGS CURRENT AND FUTURE TYPE ANALYSIS, 2025–2034, (USD MILLION)
FIGURE 98 NEW ZEALAND NEPHROSTOMY BAGS CURRENT AND FUTURE END USER ANALYSIS, 2025–2034, (USD MILLION)
FIGURE 99 INDIA NEPHROSTOMY BAGS CURRENT AND FUTURE TYPE ANALYSIS, 2025–2034, (USD MILLION)
FIGURE 100 INDIA NEPHROSTOMY BAGS CURRENT AND FUTURE END USER ANALYSIS, 2025–2034, (USD MILLION)
FIGURE 101 SINGAPORE NEPHROSTOMY BAGS CURRENT AND FUTURE TYPE ANALYSIS, 2025–2034, (USD MILLION)
FIGURE 102 SINGAPORE NEPHROSTOMY BAGS CURRENT AND FUTURE END USER ANALYSIS, 2025–2034, (USD MILLION)
FIGURE 103 THAILAND NEPHROSTOMY BAGS CURRENT AND FUTURE TYPE ANALYSIS, 2025–2034, (USD MILLION)
FIGURE 104 THAILAND NEPHROSTOMY BAGS CURRENT AND FUTURE END USER ANALYSIS, 2025–2034, (USD MILLION)
FIGURE 105 TAIWAN NEPHROSTOMY BAGS CURRENT AND FUTURE TYPE ANALYSIS, 2025–2034, (USD MILLION)
FIGURE 106 TAIWAN NEPHROSTOMY BAGS CURRENT AND FUTURE END USER ANALYSIS, 2025–2034, (USD MILLION)
FIGURE 107 MALAYSIA NEPHROSTOMY BAGS CURRENT AND FUTURE TYPE ANALYSIS, 2025–2034, (USD MILLION)
FIGURE 108 MALAYSIA NEPHROSTOMY BAGS CURRENT AND FUTURE END USER ANALYSIS, 2025–2034, (USD MILLION)
FIGURE 109 REST OF SEA AND SOUTH ASIA NEPHROSTOMY BAGS CURRENT AND FUTURE TYPE ANALYSIS, 2025–2034, (USD MILLION)
FIGURE 110 REST OF SEA AND SOUTH ASIA NEPHROSTOMY BAGS CURRENT AND FUTURE END USER ANALYSIS, 2025–2034, (USD MILLION)
FIGURE 111 MIDDLE EAST AND AFRICA NEPHROSTOMY BAGS CURRENT AND FUTURE MARKET VOLUME SHARE REGIONAL ANALYSIS, 2025–2034, (USD MILLION)
FIGURE 112 GCC COUNTRIES NEPHROSTOMY BAGS CURRENT AND FUTURE TYPE ANALYSIS, 2025–2034, (USD MILLION)
FIGURE 113 GCC COUNTRIES NEPHROSTOMY BAGS CURRENT AND FUTURE END USER ANALYSIS, 2025–2034, (USD MILLION)
FIGURE 114 SAUDI ARABIA NEPHROSTOMY BAGS CURRENT AND FUTURE TYPE ANALYSIS, 2025–2034, (USD MILLION)
FIGURE 115 SAUDI ARABIA NEPHROSTOMY BAGS CURRENT AND FUTURE END USER ANALYSIS, 2025–2034, (USD MILLION)
FIGURE 116 UAE NEPHROSTOMY BAGS CURRENT AND FUTURE TYPE ANALYSIS, 2025–2034, (USD MILLION)
FIGURE 117 UAE NEPHROSTOMY BAGS CURRENT AND FUTURE END USER ANALYSIS, 2025–2034, (USD MILLION)
FIGURE 118 BAHRAIN NEPHROSTOMY BAGS CURRENT AND FUTURE TYPE ANALYSIS, 2025–2034, (USD MILLION)
FIGURE 119 BAHRAIN NEPHROSTOMY BAGS CURRENT AND FUTURE END USER ANALYSIS, 2025–2034, (USD MILLION)
FIGURE 120 KUWAIT NEPHROSTOMY BAGS CURRENT AND FUTURE TYPE ANALYSIS, 2025–2034, (USD MILLION)
FIGURE 121 KUWAIT NEPHROSTOMY BAGS CURRENT AND FUTURE END USER ANALYSIS, 2025–2034, (USD MILLION)
FIGURE 122 OMAN NEPHROSTOMY BAGS CURRENT AND FUTURE TYPE ANALYSIS, 2025–2034, (USD MILLION)
FIGURE 123 OMAN NEPHROSTOMY BAGS CURRENT AND FUTURE END USER ANALYSIS, 2025–2034, (USD MILLION)
FIGURE 124 QATAR NEPHROSTOMY BAGS CURRENT AND FUTURE TYPE ANALYSIS, 2025–2034, (USD MILLION)
FIGURE 125 QATAR NEPHROSTOMY BAGS CURRENT AND FUTURE END USER ANALYSIS, 2025–2034, (USD MILLION)
FIGURE 126 EGYPT NEPHROSTOMY BAGS CURRENT AND FUTURE TYPE ANALYSIS, 2025–2034, (USD MILLION)
FIGURE 127 EGYPT NEPHROSTOMY BAGS CURRENT AND FUTURE END USER ANALYSIS, 2025–2034, (USD MILLION)
FIGURE 128 NIGERIA NEPHROSTOMY BAGS CURRENT AND FUTURE TYPE ANALYSIS, 2025–2034, (USD MILLION)
FIGURE 129 NIGERIA NEPHROSTOMY BAGS CURRENT AND FUTURE END USER ANALYSIS, 2025–2034, (USD MILLION)
FIGURE 130 SOUTH AFRICA NEPHROSTOMY BAGS CURRENT AND FUTURE TYPE ANALYSIS, 2025–2034, (USD MILLION)
FIGURE 131 SOUTH AFRICA NEPHROSTOMY BAGS CURRENT AND FUTURE END USER ANALYSIS, 2025–2034, (USD MILLION)
FIGURE 132 ISRAEL NEPHROSTOMY BAGS CURRENT AND FUTURE TYPE ANALYSIS, 2025–2034, (USD MILLION)
FIGURE 133 ISRAEL NEPHROSTOMY BAGS CURRENT AND FUTURE END USER ANALYSIS, 2025–2034, (USD MILLION)
FIGURE 134 REST OF MEA NEPHROSTOMY BAGS CURRENT AND FUTURE TYPE ANALYSIS, 2025–2034, (USD MILLION)
FIGURE 135 REST OF MEA NEPHROSTOMY BAGS CURRENT AND FUTURE END USER ANALYSIS, 2025–2034, (USD MILLION)
FIGURE 136 U. S. MARKET SHARE ANALYSIS BY TYPE (2024)
FIGURE 137 U. S. MARKET SHARE ANALYSIS BY END USER (2024)
FIGURE 138 CANADA MARKET SHARE ANALYSIS BY TYPE (2024)
FIGURE 139 CANADA MARKET SHARE ANALYSIS BY END USER (2024)
FIGURE 140 MEXICO MARKET SHARE ANALYSIS BY TYPE (2024)
FIGURE 141 MEXICO MARKET SHARE ANALYSIS BY END USER (2024)
FIGURE 142 CHINA MARKET SHARE ANALYSIS BY TYPE (2024)
FIGURE 143 CHINA MARKET SHARE ANALYSIS BY END USER (2024)
FIGURE 144 JAPAN MARKET SHARE ANALYSIS BY TYPE (2024)
FIGURE 145 JAPAN MARKET SHARE ANALYSIS BY END USER (2024)
FIGURE 146 INDIA MARKET SHARE ANALYSIS BY TYPE (2024)
FIGURE 147 INDIA MARKET SHARE ANALYSIS BY END USER (2024)
FIGURE 148 SOUTH KOREA MARKET SHARE ANALYSIS BY TYPE (2024)
FIGURE 149 SOUTH KOREA MARKET SHARE ANALYSIS BY END USER (2024)
FIGURE 150 SAUDI ARABIA MARKET SHARE ANALYSIS BY TYPE (2024)
FIGURE 151 SAUDI ARABIA MARKET SHARE ANALYSIS BY END USER (2024)
FIGURE 152 UAE MARKET SHARE ANALYSIS BY TYPE (2024)
FIGURE 153 UAE MARKET SHARE ANALYSIS BY END USER (2024)
FIGURE 154 EGYPT MARKET SHARE ANALYSIS BY TYPE (2024)
FIGURE 155 EGYPT MARKET SHARE ANALYSIS BY END USER (2024)
FIGURE 156 NIGERIA MARKET SHARE ANALYSIS BY TYPE (2024)
FIGURE 157 NIGERIA MARKET SHARE ANALYSIS BY END USER (2024)
FIGURE 158 SOUTH AFRICA MARKET SHARE ANALYSIS BY TYPE (2024)
FIGURE 159 SOUTH AFRICA MARKET SHARE ANALYSIS BY END USER (2024)
FIGURE 160 GERMANY MARKET SHARE ANALYSIS BY TYPE (2024)
FIGURE 161 GERMANY MARKET SHARE ANALYSIS BY END USER (2024)
FIGURE 162 FRANCE MARKET SHARE ANALYSIS BY TYPE (2024)
FIGURE 163 FRANCE MARKET SHARE ANALYSIS BY END USER (2024)
FIGURE 164 UK MARKET SHARE ANALYSIS BY TYPE (2024)
FIGURE 165 UK MARKET SHARE ANALYSIS BY END USER (2024)
FIGURE 166 SPAIN MARKET SHARE ANALYSIS BY TYPE (2024)
FIGURE 167 SPAIN MARKET SHARE ANALYSIS BY END USER (2024)
FIGURE 168 ITALY MARKET SHARE ANALYSIS BY TYPE (2024)
FIGURE 169 ITALY MARKET SHARE ANALYSIS BY END USER (2024)
FIGURE 170 BRAZIL MARKET SHARE ANALYSIS BY TYPE (2024)
FIGURE 171 BRAZIL MARKET SHARE ANALYSIS BY END USER (2024)
FIGURE 172 ARGENTINA MARKET SHARE ANALYSIS BY TYPE (2024)
FIGURE 173 ARGENTINA MARKET SHARE ANALYSIS BY END USER (2024)
FIGURE 174 COLUMBIA MARKET SHARE ANALYSIS BY TYPE (2024)
FIGURE 175 COLUMBIA MARKET SHARE ANALYSIS BY END USER (2024)
FIGURE 176 GLOBAL NEPHROSTOMY BAGS CURRENT AND FUTURE MARKET KEY COUNTRY LEVEL ANALYSIS, 2024–2034, (USD MILLION)
FIGURE 177 FINANCIAL OVERVIEW:
Key Player Analysis
Remington Medical: Positioning: niche player focused on single-use nephrostomy and fluid drainage bags with a 600 mL sterile line for abscess, biliary, and nephrostomy use. The 600-D bag includes a 24-inch kink-resistant tube, an anti-reflux barrier, a twist valve outlet, and an adjustable waist belt for ambulation. Products are latex-free and distributed through major medical supply channels in the United States, supporting clinical and home settings.
Remington’s 2025 focus centers on convenience and smooth transitions from hospital to home through sterile packaging and universal connectors that fit standard nephrostomy tubes. The 600 mL format supports bedside or ambulatory placement and aligns with mid-capacity utilization patterns in nephrostomy drainage. Packaging flexibility, including box quantities, targets procurement efficiency for clinics and homecare providers.
Coloplast A/S: Positioning: leader in continence and urinary drainage with a broad portfolio spanning bedside and leg bag configurations. The Conveen Standard drainage bag supports daytime or nighttime use and features a clamp outlet to verify closure and reduce accidental leakage. Coloplast also supplies a 2,000 mL night drainage bag with an anti-reflux valve and connectors compatible with SenSura and Assura systems, extending utility across urology and ostomy use cases.
This breadth gives Coloplast coverage across hospital wards and home settings in 2025 through high-capacity and compatible SKUs. Large-volume options and anti-reflux designs align with infection-control priorities and extended wear needs in urinary drainage pathways. Integration with established pouch systems supports standardization and purchasing at scale within provider networks.
Merit Medical: Positioning: challenger in nephrostomy drainage with the Drainage Depot line centered on sterile 600 mL bags. Core features include adjustable-length tubing, an internal anti-reflux valve, a twist drain for disposal, and easy-to-read volume graduations for monitoring. Belt options and Luer lock connectors support secure attachment and fit, improving use during patient mobility.
Merit’s breadth in drainage accessories enables bundled offerings across procedural sites and home transitions, aligning with standardized supply needs in 2025. Clear graduations and standardized components help reduce handling time and documentation error at the point of care. Retail availability through U.S. distributors expands access beyond hospital procurement cycles, supporting rapid replenishment.
UreSil, LLC: Positioning: niche player specialized in interventional drainage systems across gravity and suction configurations. The TRU-CLOSE line offers 300, 500, and 1,000 mL bags with two anti-reflux valves and the option to operate by active suction or gravity for flexible clinical use. The TC600 gravity system provides a 600 mL bag with 20 or 36 inches of stretchable tubing, a Luer lock connector, and a hook-and-loop belt for secure wear, supporting nephrostomy drainage in varied settings.
Regulatory reach includes CE-marked availability for multiple SKUs alongside U.S. distribution, supporting multi-region procurement in 2025. Focus on interventional radiology and closed systems differentiates the brand within nephrostomy drainage portfolios. Accessory lines such as adapters and bilateral tubing integrate with standard catheters and streamline hospital and clinic workflows.
Market Key Players
Urocare Products, Inc.
Teleflex Incorporated
TERUMO Corporation
Cardinal Health, Inc.
Merit Medical
Coloplast A/S
Becton, Dickinson and Company
Remington Medical
B. Braun SE
UreSil, LLC
Driver:
Rising Urology Procedures and High-Risk Patient Pool
As of 2025, rising procedure volumes and a larger high-risk patient pool are lifting nephrostomy bag demand. The market is tracking a 4.2% CAGR from 2024 to 2033, with sterile bags at roughly 85% share and disposables near 78%. Urology, oncology, and stone procedures underpin utilization. In the United States, surgical encounters surpassed 50 million in 2024. Kidney stone prevalence stands near 8.8% of adults, or about 1 in 11, with an estimated 600,000 incident cases each year. You see consistent use in post-operative drainage and obstruction management, supported by payer coverage and standard infection-control protocols.
These clinical loads translate into steady unit growth across inpatient wards, ambulatory centers, and home transitions. Procurement favors sterile, anti-reflux, closed systems that lower complication risk and shorten length of stay. Vendors that package tube sets with barcoded sterile bags win tenders on total cost and compliance metrics.
Restraint:
Infection Risks and Procedure-Related Complications
Device-associated infections and catheter complications remain the principal brake on adoption. The CDC indicates urinary tract infections account for about 32% of hospital-acquired infections in the U.S., with CAUTIs adding material cost per episode and prolonging stays. Leakage, blockage, and dislodgement trigger readmissions and unplanned exchanges, which pressure quality scores and reimbursement. Alternatives such as ureteral stents or laser lithotripsy can shift selected cases away from nephrostomy pathways.
Pricing Pressure and Regulatory Compliance Burden
Pricing pressure compounds the risk side. Group purchasing and public tenders often compress average selling prices by 5 to 10%. EU MDR requirements increase documentation and testing costs. Ethylene oxide sterilization constraints can restrict throughput and extend lead times. Together, these factors cap premium mix and slow rollout of higher-margin configurations.
Opportunity:
Asia-Pacific Expansion and Homecare Adoption
Asia Pacific offers the strongest near-term upside. The region is set to grow at roughly 5 to 6% CAGR through 2030 as China and India expand urology capacity and home health distribution. That trajectory can add USD 150 to 200 million in incremental revenue versus 2024 baselines. Homecare also presents headroom in developed markets. Hospital-at-home programs and post-acute pathways are standardizing on discreet, skin-friendly, sterile disposables, growing at an estimated 6 to 7% CAGR through 2030.
Product Innovation Focused on Safety and Efficiency
Product features that reduce infection and handling time unlock procurement wins. Antimicrobial coatings, anti-reflux valves, and secure connectors cut adverse events and nursing minutes per patient day. You can target formularies with mid-capacity 500–1000 ml SKUs, which hold about 55% share, and pair them with training and monitoring protocols to improve outcomes and retention.
Trend:
Digital Traceability and Connected Output Monitoring
Connectivity and materials shifts define 2025 strategies. Hospitals are adopting barcoding and RFID for lot traceability, while connected urine output monitors interface with electronic records to automate charting. Systems that capture hourly output without manual recording reduce documentation errors and support early sepsis detection. Leading portfolios from BD, Coloplast, ConvaTec, Teleflex, B. Braun, and Hollister now include sterile kits designed for integration with bedside monitors and EMR workflows.
Sustainability-Driven Material and Sterilization Shifts
Sustainability and safety policies are pushing DEHP-free, lower-emission, and PVC-free lines, particularly in Europe and large U.S. networks. PVC and PU remain near 45% share due to price and performance, but silicone and TPE alternatives are gaining mix points as hospitals set internal targets. Manufacturers are dual-sourcing sterilization and relocating finishing steps closer to demand centers to manage EtO capacity limits and shipping volatility.
Recent Developments
Dec 2024 - UreSil, LLC: UreSil’s TRU CLOSE TC600 nephrostomy drainage bag was widely listed by U.S. retailers with dual anti-reflux valves, stretchable 20–36 inch tubing options, Luer lock connection, and belt support for secure wear. Strategic impact: Broader retail availability supports homecare adoption and procurement outside hospital cycles.
Feb 2025 - Coloplast A/S: Coloplast announced an expansion of its Peristeen Light portfolio, reinforcing coverage in continence care adjacent to urinary drainage workflows. Strategic impact: Portfolio depth strengthens cross-selling into urology and homecare channels that also stock drainage bags.
Mar 2025 - Merit Medical: Carewell added the Merit Urinary Drainage Depot 600 mL bag with Luer lock and twist drain, improving direct-to-home availability and replenishment for post-acute patients. Strategic impact: Retail distribution expands access beyond hospital procurement cycles and supports home transitions.
Apr 2025 - Merit Medical: Merit announced the Ventrax Delivery System within its interventional platform, signaling continued investment around IR procedures that align with drainage care pathways. Strategic impact: Stronger engagement with interventional radiology can drive pull-through for Drainage Depot bags across inpatient and outpatient settings.
Aug 2025 - Coloplast A/S: Capital Markets Day materials outlined U.S. coding reform timelines, with earliest financial impact expected in 2027, shaping pricing and channel planning in continence and urology. Strategic impact: Reimbursement visibility supports disciplined growth investments in drainage and adjacent continence portfolios in North America.
Sep 2025 - Remington Medical: The company refreshed its 600 mL disposable drainage bag page highlighting anti-reflux barriers, a twist outlet, adjustable belts, and U.S. distribution, while distributor catalogs expanded nephrostomy bag listings. Strategic impact: Feature clarity and broader channel presence strengthen positioning in ambulatory and homecare use cases.