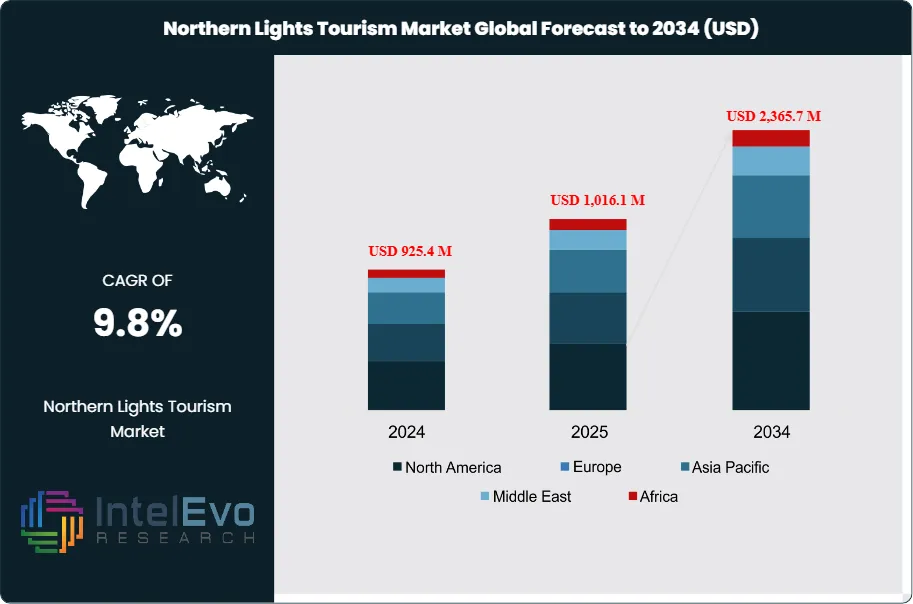
The Northern Lights Tourism Market is estimated at USD 925.4 million in 2024 and is projected to reach approximately USD 2,365.7 million by 2034, registering a CAGR of about 9.8% during 2025–2034. Growth is being fueled by rising demand for premium, experience-led travel, and increased winter air connectivity to Arctic destinations, and higher conversion rates driven by aurora forecasting technologies. Multi-night packages, glass igloos, and guarantee-backed itineraries are lifting average daily rates, while sustainability-focused infrastructure and electrified transport are expanding capacity in regulated regions. Together, these dynamics position Northern Lights tourism as one of the fastest-growing niche segments within global experiential travel.
The market has expanded as high-latitude destinations package aurora viewing with winter activities, local culture, and distinctive lodging. Demand rebounded after 2021 and now benefits from longer booking windows and higher average trip values in premium segments. Search and booking data point to strong intent; Finland recorded a 197% surge in hotel searches for Northern Lights trips in 2023 versus 2022, while interest in Finnish Lapland rose 328% in 2023. Northern Norway welcomed 320,000 international winter visitors in the 2022–2023 season, supported by improved air links to Tromsø and Alta.
You see clear demand-side drivers. Affluent travelers seek rare natural spectacles; social media amplifies aurora content; bundled itineraries reduce perceived risk of clouded nights. Supply-side factors also help. Operators have added glass igloos, panoramic cabins, and remote lodges; airlines have increased seasonal capacity to Lapland, Iceland, and Arctic Norway. Technology improves trip success rates. Real-time Kp index alerts, AI-driven cloud cover forecasts, and sky cameras help guides move guests to clearer locations; VR and AR previews shape expectations and conversions.
Challenges remain. Weather volatility and seasonality create booking risk; short winter daylight hours constrain excursions; fragile Arctic ecosystems face overtourism pressure. You must manage carrying capacity, energy use, and waste in cold regions; regulators are raising the bar. Finland has introduced grants for sustainable tourism; operators are rolling out electric snowmobiles, dark-sky lighting, and carbon-offset options. Insurance costs and labor shortages in remote areas add pressure; currency swings affect long-haul demand from Asia and North America.
Regional hotspots lead the next wave of investment. Finnish Lapland, Northern Norway, and Iceland anchor the market; Canada’s Yukon and Northwest Territories show rising interest, with 71% of Canadian travelers expressing a desire to see the aurora. Investors should prioritize year-round revenue models through shoulder-season nature and culture products; focus on grid-tied heating, low-emission transport, and certified guides; and use data-led allocation to raise first-night sighting rates. These moves lift occupancy, protect margins, and support durable growth at a near-10% pace through 2034.
Key Takeaways
Market Growth: The Northern Lights Tourism Market will expand from USD 925.4 million in 2024 to USD 2,365.7 million by 2034 at a 9.8% CAGR. You can expect momentum from premium experiential travel, improved Arctic air links, and data-led trip planning.
Traveler Type: Couples led with a 48.6% share in 2023, driven by demand for private guides, glass igloos, and multi-night packages. This cohort sustains higher spend and longer stays.
Age Group: The 18–34 segment held 32% of demand in 2023. Social media discovery and night photography tours convert this cohort effectively across budget and premium tiers.
Driver: Search intent surged in core markets; Finland recorded a 197% jump in hotel searches for aurora trips in 2023 versus 2022, and interest in Finnish Lapland rose 328%. Northern Norway welcomed 320,000 international winter visitors in 2022–2023, signaling strong inbound demand.
Restraint: Weather dependency and short winter daylight reduce utilization; first-night sighting odds often sit near 30–40%, rising to 70–80% over three nights. Weather-related tour cancellations can reach 15–20% in shoulder months, which pressures margins and refunds.
Opportunity: Premium infrastructure in Lapland, Iceland, and Arctic Norway, including glass igloos and remote lodges, lifts yield; operators report 15–25% higher ADR versus standard stays. Canada’s Yukon and Northwest Territories are emerging targets, supported by 71% of Canadians expressing a desire to see the aurora.
Trend: Operators deploy real-time Kp alerts, AI-based cloud cover forecasts, and all-sky cameras to improve hit rates; VR and AR previews aid conversions. Early adopters report higher guest satisfaction and fewer rebookings on three-night packages.
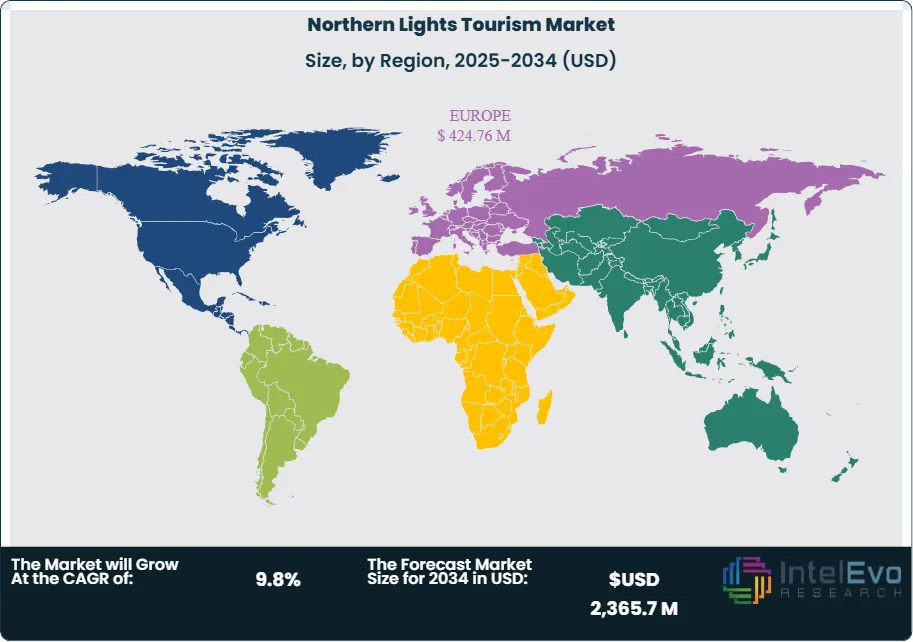
Regional Analysis: Europe led with a 45.9% share in 2023, or about USD 409.5 million, anchored by Finland, Norway, Sweden, and Iceland; growth in Europe is expected near 8–9% CAGR. North America is set to outpace at an estimated 10–11% CAGR through 2033, with Asia Pacific outbound travel adding upside as direct winter flights expand.
Traveler Type Analysis
Couples remained the largest traveler cohort in 2023 with a 48.6% share and are set to hold the lead through 2025 as premium, privacy-focused itineraries gain traction. You see consistent demand for glass igloos, panoramic cabins, and private guiding, which lifts average daily rates by 15–25% versus standard stays. Multi-night packages dominate; operators market three- and four-night stays to raise sighting odds and stabilize margins.
Friends groups continue to expand on the back of shared experiences and photography-led tours. Families show steady uptake, supported by educational content, safer transport, and flexible evening schedules. Solo travel remains a niche but resilient segment; clear safety standards, small-group departures, and hostel-to-lodge combinations help conversion. The addressable base is growing as intent signals rise; Finland recorded a 197% jump in hotel searches for Northern Lights trips in 2023 versus 2022 and interest in Finnish Lapland rose 328%.
Age GroupAnalysis
Travelers aged 18–34 led with a 32% share in 2023 and will continue to shape demand in 2025. Social media discovery and night photography drive bookings; mobile-first funnels, dynamic pricing, and deposit plans improve conversion for this cohort. AI-powered cloud cover forecasts, Kp alerts, and all-sky cameras help guides reposition guests in real time, which sustains satisfaction and reviews.
The 35–49 segment follows with strong spend and preference for bundled culture and nature content. The 50–64 group values comfort and reliability; three-night packages typically lift cumulative sighting probability from 30–40% on night one to 70–80% across the stay. Travelers 65+ remain smaller in share but show clear intent when accessibility, heated viewing shelters, and shorter transfers are guaranteed. You should tailor pacing, gear, and briefing formats by cohort to raise attach rates on excursions and photography add-ons.
Regional Analysis
Europe holds the lead with a 45.9% share, or about USD 409.5 million in 2023, anchored by Finland, Norway, Sweden, and Iceland. The region benefits from prime latitudes, reliable air access, and purpose-built lodging; Northern Norway hosted about 320,000 international winter visitors in the 2022–2023 season. Finland’s search interest remains elevated into the 2024–2025 season, reinforcing a strong pipeline for Lapland.
North America is robust and rising, centered on Canada’s Yukon and Northwest Territories and Alaska. Demand is broad-based; 71% of Canadian travelers express a desire to see the aurora. Infrastructure upgrades, winter flight capacity, and certified guiding support growth through 2025.
Asia Pacific contributes on two fronts. Japan’s Hokkaido offers regional product during peak months, while outbound travel from China, South Korea, and Australia fuels Europe and North America. The Middle East and Africa and Latin America are smaller today; growth comes from outbound premium segments as operators add aurora packages to Arctic itineraries. You should watch corridors where new winter charters and visa streamlining shorten total journey time.
Customization for segments, region/country-level will be provided. Moreover, additional customization can be done based on the requirements.
Pricing and Purchase Options
Avail customized purchase options to meet your exact research needs. We have three licenses to opt for: Single User License, Multi-User License (Up to 5 Users), Corporate Use License (Unlimited User and Printable PDF).
TABLE OF CONTENTS
1. EXECUTIVE SUMMARY
1.1. MARKET SNAPSHOT
1.2. KEY FINDINGS & INSIGHTS
1.3. ANALYST RECOMMENDATIONS
1.4. FUTURE OUTLOOK
2. RESEARCH METHODOLOGY
2.1. MARKET DEFINITION & SCOPE
2.2. RESEARCH OBJECTIVES: PRIMARY & SECONDARY DATA SOURCES
2.3. DATA COLLECTION SOURCES
2.3.1. COVERAGE OF 100+ PRIMARY RESEARCH/CONSULTATION CALLS WITH INDUSTRY STAKEHOLDERS
FIGURE 17 NORTH AMERICA NORTHERN LIGHTS TOURISM CURRENT AND FUTURE TYPE ANALYSIS, 2025–2034, (USD MILLION)
FIGURE 18 NORTH AMERICA NORTHERN LIGHTS TOURISM CURRENT AND FUTURE END USER ANALYSIS, 2025–2034, (USD MILLION)
FIGURE 19 MARKET SHARE BY COUNTRY
FIGURE 20 LATIN AMERICA NORTHERN LIGHTS TOURISM CURRENT AND FUTURE TYPE ANALYSIS, 2025–2034, (USD MILLION)
FIGURE 21 LATIN AMERICA NORTHERN LIGHTS TOURISM CURRENT AND FUTURE END USER ANALYSIS, 2025–2034, (USD MILLION)
FIGURE 22 MARKET SHARE BY COUNTRY
FIGURE 23 EASTERN EUROPE NORTHERN LIGHTS TOURISM CURRENT AND FUTURE TYPE ANALYSIS, 2025–2034, (USD MILLION)
FIGURE 24 EASTERN EUROPE NORTHERN LIGHTS TOURISM CURRENT AND FUTURE END USER ANALYSIS, 2025–2034, (USD MILLION)
FIGURE 25 MARKET SHARE BY COUNTRY
FIGURE 26 WESTERN EUROPE NORTHERN LIGHTS TOURISM CURRENT AND FUTURE TYPE ANALYSIS, 2025–2034, (USD MILLION)
FIGURE 27 WESTERN EUROPE NORTHERN LIGHTS TOURISM CURRENT AND FUTURE END USER ANALYSIS, 2025–2034, (USD MILLION)
FIGURE 28 MARKET SHARE BY COUNTRY
FIGURE 29 EAST ASIA AND PACIFIC NORTHERN LIGHTS TOURISM CURRENT AND FUTURE TYPE ANALYSIS, 2025–2034, (USD MILLION)
FIGURE 30 EAST ASIA AND PACIFIC NORTHERN LIGHTS TOURISM CURRENT AND FUTURE END USER ANALYSIS, 2025–2034, (USD MILLION)
FIGURE 31 MARKET SHARE BY COUNTRY
FIGURE 32 SEA AND SOUTH ASIA NORTHERN LIGHTS TOURISM CURRENT AND FUTURE TYPE ANALYSIS, 2025–2034, (USD MILLION)
FIGURE 33 SEA AND SOUTH ASIA NORTHERN LIGHTS TOURISM CURRENT AND FUTURE END USER ANALYSIS, 2025–2034, (USD MILLION)
FIGURE 34 MARKET SHARE BY COUNTRY
FIGURE 35 MIDDLE EAST AND AFRICA NORTHERN LIGHTS TOURISM CURRENT AND FUTURE TYPE ANALYSIS, 2025–2034, (USD MILLION)
FIGURE 36 MIDDLE EAST AND AFRICA NORTHERN LIGHTS TOURISM CURRENT AND FUTURE END USER ANALYSIS, 2025–2034, (USD MILLION)
FIGURE 37 NORTH AMERICA NORTHERN LIGHTS TOURISM CURRENT AND FUTURE MARKET VOLUME SHARE REGIONAL ANALYSIS, 2025–2034, (USD MILLION)
FIGURE 38 U.S. NORTHERN LIGHTS TOURISM CURRENT AND FUTURE TYPE ANALYSIS, 2025–2034, (USD MILLION)
FIGURE 39 U.S. NORTHERN LIGHTS TOURISM CURRENT AND FUTURE END USER ANALYSIS, 2025–2034, (USD MILLION)
FIGURE 40 CANADA NORTHERN LIGHTS TOURISM CURRENT AND FUTURE TYPE ANALYSIS, 2025–2034, (USD MILLION)
FIGURE 41 CANADA NORTHERN LIGHTS TOURISM CURRENT AND FUTURE END USER ANALYSIS, 2025–2034, (USD MILLION)
FIGURE 42 LATIN AMERICA NORTHERN LIGHTS TOURISM CURRENT AND FUTURE MARKET VOLUME SHARE REGIONAL ANALYSIS, 2025–2034, (USD MILLION)
FIGURE 43 MEXICO NORTHERN LIGHTS TOURISM CURRENT AND FUTURE TYPE ANALYSIS, 2025–2034, (USD MILLION)
FIGURE 44 MEXICO NORTHERN LIGHTS TOURISM CURRENT AND FUTURE END USER ANALYSIS, 2025–2034, (USD MILLION)
FIGURE 45 BRAZIL NORTHERN LIGHTS TOURISM CURRENT AND FUTURE TYPE ANALYSIS, 2025–2034, (USD MILLION)
FIGURE 46 BRAZIL NORTHERN LIGHTS TOURISM CURRENT AND FUTURE END USER ANALYSIS, 2025–2034, (USD MILLION)
FIGURE 47 ARGENTINA NORTHERN LIGHTS TOURISM CURRENT AND FUTURE TYPE ANALYSIS, 2025–2034, (USD MILLION)
FIGURE 48 ARGENTINA NORTHERN LIGHTS TOURISM CURRENT AND FUTURE END USER ANALYSIS, 2025–2034, (USD MILLION)
FIGURE 49 COLUMBIA NORTHERN LIGHTS TOURISM CURRENT AND FUTURE TYPE ANALYSIS, 2025–2034, (USD MILLION)
FIGURE 50 COLUMBIA NORTHERN LIGHTS TOURISM CURRENT AND FUTURE END USER ANALYSIS, 2025–2034, (USD MILLION)
FIGURE 51 REST OF LATIN AMERICA NORTHERN LIGHTS TOURISM CURRENT AND FUTURE TYPE ANALYSIS, 2025–2034, (USD MILLION)
FIGURE 52 REST OF LATIN AMERICA NORTHERN LIGHTS TOURISM CURRENT AND FUTURE END USER ANALYSIS, 2025–2034, (USD MILLION)
FIGURE 53 EASTERN EUROPE NORTHERN LIGHTS TOURISM CURRENT AND FUTURE MARKET VOLUME SHARE REGIONAL ANALYSIS, 2025–2034, (USD MILLION)
FIGURE 54 POLAND NORTHERN LIGHTS TOURISM CURRENT AND FUTURE TYPE ANALYSIS, 2025–2034, (USD MILLION)
FIGURE 55 POLAND NORTHERN LIGHTS TOURISM CURRENT AND FUTURE END USER ANALYSIS, 2025–2034, (USD MILLION)
FIGURE 56 RUSSIA NORTHERN LIGHTS TOURISM CURRENT AND FUTURE TYPE ANALYSIS, 2025–2034, (USD MILLION)
FIGURE 57 RUSSIA NORTHERN LIGHTS TOURISM CURRENT AND FUTURE END USER ANALYSIS, 2025–2034, (USD MILLION)
FIGURE 58 CZECH REPUBLIC NORTHERN LIGHTS TOURISM CURRENT AND FUTURE TYPE ANALYSIS, 2025–2034, (USD MILLION)
FIGURE 59 CZECH REPUBLIC NORTHERN LIGHTS TOURISM CURRENT AND FUTURE END USER ANALYSIS, 2025–2034, (USD MILLION)
FIGURE 60 ROMANIA NORTHERN LIGHTS TOURISM CURRENT AND FUTURE TYPE ANALYSIS, 2025–2034, (USD MILLION)
FIGURE 61 ROMANIA NORTHERN LIGHTS TOURISM CURRENT AND FUTURE END USER ANALYSIS, 2025–2034, (USD MILLION)
FIGURE 62 REST OF EASTERN EUROPE NORTHERN LIGHTS TOURISM CURRENT AND FUTURE TYPE ANALYSIS, 2025–2034, (USD MILLION)
FIGURE 63 REST OF EASTERN EUROPE NORTHERN LIGHTS TOURISM CURRENT AND FUTURE END USER ANALYSIS, 2025–2034, (USD MILLION)
FIGURE 64 WESTERN EUROPE NORTHERN LIGHTS TOURISM CURRENT AND FUTURE MARKET VOLUME SHARE REGIONAL ANALYSIS, 2025–2034, (USD MILLION)
FIGURE 65 GERMANY NORTHERN LIGHTS TOURISM CURRENT AND FUTURE TYPE ANALYSIS, 2025–2034, (USD MILLION)
FIGURE 66 GERMANY NORTHERN LIGHTS TOURISM CURRENT AND FUTURE END USER ANALYSIS, 2025–2034, (USD MILLION)
FIGURE 67 FRANCE NORTHERN LIGHTS TOURISM CURRENT AND FUTURE TYPE ANALYSIS, 2025–2034, (USD MILLION)
FIGURE 68 FRANCE NORTHERN LIGHTS TOURISM CURRENT AND FUTURE END USER ANALYSIS, 2025–2034, (USD MILLION)
FIGURE 69 UK NORTHERN LIGHTS TOURISM CURRENT AND FUTURE TYPE ANALYSIS, 2025–2034, (USD MILLION)
FIGURE 70 UK NORTHERN LIGHTS TOURISM CURRENT AND FUTURE END USER ANALYSIS, 2025–2034, (USD MILLION)
FIGURE 71 SPAIN NORTHERN LIGHTS TOURISM CURRENT AND FUTURE TYPE ANALYSIS, 2025–2034, (USD MILLION)
FIGURE 72 SPAIN NORTHERN LIGHTS TOURISM CURRENT AND FUTURE END USER ANALYSIS, 2025–2034, (USD MILLION)
FIGURE 73 ITALY NORTHERN LIGHTS TOURISM CURRENT AND FUTURE TYPE ANALYSIS, 2025–2034, (USD MILLION)
FIGURE 74 ITALY NORTHERN LIGHTS TOURISM CURRENT AND FUTURE END USER ANALYSIS, 2025–2034, (USD MILLION)
FIGURE 75 REST OF WESTERN EUROPE NORTHERN LIGHTS TOURISM CURRENT AND FUTURE TYPE ANALYSIS, 2025–2034, (USD MILLION)
FIGURE 76 REST OF WESTERN EUROPE NORTHERN LIGHTS TOURISM CURRENT AND FUTURE END USER ANALYSIS, 2025–2034, (USD MILLION)
FIGURE 77 EAST ASIA AND PACIFIC NORTHERN LIGHTS TOURISM CURRENT AND FUTURE MARKET VOLUME SHARE REGIONAL ANALYSIS, 2025–2034, (USD MILLION)
FIGURE 78 CHINA NORTHERN LIGHTS TOURISM CURRENT AND FUTURE TYPE ANALYSIS, 2025–2034, (USD MILLION)
FIGURE 79 CHINA NORTHERN LIGHTS TOURISM CURRENT AND FUTURE END USER ANALYSIS, 2025–2034, (USD MILLION)
FIGURE 80 JAPAN NORTHERN LIGHTS TOURISM CURRENT AND FUTURE TYPE ANALYSIS, 2025–2034, (USD MILLION)
FIGURE 81 JAPAN NORTHERN LIGHTS TOURISM CURRENT AND FUTURE END USER ANALYSIS, 2025–2034, (USD MILLION)
FIGURE 82 AUSTRALIA NORTHERN LIGHTS TOURISM CURRENT AND FUTURE TYPE ANALYSIS, 2025–2034, (USD MILLION)
FIGURE 83 AUSTRALIA NORTHERN LIGHTS TOURISM CURRENT AND FUTURE END USER ANALYSIS, 2025–2034, (USD MILLION)
FIGURE 84 CAMBODIA NORTHERN LIGHTS TOURISM CURRENT AND FUTURE TYPE ANALYSIS, 2025–2034, (USD MILLION)
FIGURE 85 CAMBODIA NORTHERN LIGHTS TOURISM CURRENT AND FUTURE END USER ANALYSIS, 2025–2034, (USD MILLION)
FIGURE 86 FIJI NORTHERN LIGHTS TOURISM CURRENT AND FUTURE TYPE ANALYSIS, 2025–2034, (USD MILLION)
FIGURE 87 FIJI NORTHERN LIGHTS TOURISM CURRENT AND FUTURE END USER ANALYSIS, 2025–2034, (USD MILLION)
FIGURE 88 INDONESIA NORTHERN LIGHTS TOURISM CURRENT AND FUTURE TYPE ANALYSIS, 2025–2034, (USD MILLION)
FIGURE 89 INDONESIA NORTHERN LIGHTS TOURISM CURRENT AND FUTURE END USER ANALYSIS, 2025–2034, (USD MILLION)
FIGURE 90 SOUTH KOREA NORTHERN LIGHTS TOURISM CURRENT AND FUTURE TYPE ANALYSIS, 2025–2034, (USD MILLION)
FIGURE 91 SOUTH KOREA NORTHERN LIGHTS TOURISM CURRENT AND FUTURE END USER ANALYSIS, 2025–2034, (USD MILLION)
FIGURE 92 REST OF EAST ASIA AND PACIFIC NORTHERN LIGHTS TOURISM CURRENT AND FUTURE TYPE ANALYSIS, 2025–2034, (USD MILLION)
FIGURE 93 REST OF EAST ASIA AND PACIFIC NORTHERN LIGHTS TOURISM CURRENT AND FUTURE END USER ANALYSIS, 2025–2034, (USD MILLION)
FIGURE 94 SEA AND SOUTH ASIA NORTHERN LIGHTS TOURISM CURRENT AND FUTURE MARKET VOLUME SHARE REGIONAL ANALYSIS, 2025–2034, (USD MILLION)
FIGURE 95 BANGLADESH NORTHERN LIGHTS TOURISM CURRENT AND FUTURE TYPE ANALYSIS, 2025–2034, (USD MILLION)
FIGURE 96 BANGLADESH NORTHERN LIGHTS TOURISM CURRENT AND FUTURE END USER ANALYSIS, 2025–2034, (USD MILLION)
FIGURE 97 NEW ZEALAND NORTHERN LIGHTS TOURISM CURRENT AND FUTURE TYPE ANALYSIS, 2025–2034, (USD MILLION)
FIGURE 98 NEW ZEALAND NORTHERN LIGHTS TOURISM CURRENT AND FUTURE END USER ANALYSIS, 2025–2034, (USD MILLION)
FIGURE 99 INDIA NORTHERN LIGHTS TOURISM CURRENT AND FUTURE TYPE ANALYSIS, 2025–2034, (USD MILLION)
FIGURE 100 INDIA NORTHERN LIGHTS TOURISM CURRENT AND FUTURE END USER ANALYSIS, 2025–2034, (USD MILLION)
FIGURE 101 SINGAPORE NORTHERN LIGHTS TOURISM CURRENT AND FUTURE TYPE ANALYSIS, 2025–2034, (USD MILLION)
FIGURE 102 SINGAPORE NORTHERN LIGHTS TOURISM CURRENT AND FUTURE END USER ANALYSIS, 2025–2034, (USD MILLION)
FIGURE 103 THAILAND NORTHERN LIGHTS TOURISM CURRENT AND FUTURE TYPE ANALYSIS, 2025–2034, (USD MILLION)
FIGURE 104 THAILAND NORTHERN LIGHTS TOURISM CURRENT AND FUTURE END USER ANALYSIS, 2025–2034, (USD MILLION)
FIGURE 105 TAIWAN NORTHERN LIGHTS TOURISM CURRENT AND FUTURE TYPE ANALYSIS, 2025–2034, (USD MILLION)
FIGURE 106 TAIWAN NORTHERN LIGHTS TOURISM CURRENT AND FUTURE END USER ANALYSIS, 2025–2034, (USD MILLION)
FIGURE 107 MALAYSIA NORTHERN LIGHTS TOURISM CURRENT AND FUTURE TYPE ANALYSIS, 2025–2034, (USD MILLION)
FIGURE 108 MALAYSIA NORTHERN LIGHTS TOURISM CURRENT AND FUTURE END USER ANALYSIS, 2025–2034, (USD MILLION)
FIGURE 109 REST OF SEA AND SOUTH ASIA NORTHERN LIGHTS TOURISM CURRENT AND FUTURE TYPE ANALYSIS, 2025–2034, (USD MILLION)
FIGURE 110 REST OF SEA AND SOUTH ASIA NORTHERN LIGHTS TOURISM CURRENT AND FUTURE END USER ANALYSIS, 2025–2034, (USD MILLION)
FIGURE 111 MIDDLE EAST AND AFRICA NORTHERN LIGHTS TOURISM CURRENT AND FUTURE MARKET VOLUME SHARE REGIONAL ANALYSIS, 2025–2034, (USD MILLION)
FIGURE 112 GCC COUNTRIES NORTHERN LIGHTS TOURISM CURRENT AND FUTURE TYPE ANALYSIS, 2025–2034, (USD MILLION)
FIGURE 113 GCC COUNTRIES NORTHERN LIGHTS TOURISM CURRENT AND FUTURE END USER ANALYSIS, 2025–2034, (USD MILLION)
FIGURE 114 SAUDI ARABIA NORTHERN LIGHTS TOURISM CURRENT AND FUTURE TYPE ANALYSIS, 2025–2034, (USD MILLION)
FIGURE 115 SAUDI ARABIA NORTHERN LIGHTS TOURISM CURRENT AND FUTURE END USER ANALYSIS, 2025–2034, (USD MILLION)
FIGURE 116 UAE NORTHERN LIGHTS TOURISM CURRENT AND FUTURE TYPE ANALYSIS, 2025–2034, (USD MILLION)
FIGURE 117 UAE NORTHERN LIGHTS TOURISM CURRENT AND FUTURE END USER ANALYSIS, 2025–2034, (USD MILLION)
FIGURE 118 BAHRAIN NORTHERN LIGHTS TOURISM CURRENT AND FUTURE TYPE ANALYSIS, 2025–2034, (USD MILLION)
FIGURE 119 BAHRAIN NORTHERN LIGHTS TOURISM CURRENT AND FUTURE END USER ANALYSIS, 2025–2034, (USD MILLION)
FIGURE 120 KUWAIT NORTHERN LIGHTS TOURISM CURRENT AND FUTURE TYPE ANALYSIS, 2025–2034, (USD MILLION)
FIGURE 121 KUWAIT NORTHERN LIGHTS TOURISM CURRENT AND FUTURE END USER ANALYSIS, 2025–2034, (USD MILLION)
FIGURE 122 OMAN NORTHERN LIGHTS TOURISM CURRENT AND FUTURE TYPE ANALYSIS, 2025–2034, (USD MILLION)
FIGURE 123 OMAN NORTHERN LIGHTS TOURISM CURRENT AND FUTURE END USER ANALYSIS, 2025–2034, (USD MILLION)
FIGURE 124 QATAR NORTHERN LIGHTS TOURISM CURRENT AND FUTURE TYPE ANALYSIS, 2025–2034, (USD MILLION)
FIGURE 125 QATAR NORTHERN LIGHTS TOURISM CURRENT AND FUTURE END USER ANALYSIS, 2025–2034, (USD MILLION)
FIGURE 126 EGYPT NORTHERN LIGHTS TOURISM CURRENT AND FUTURE TYPE ANALYSIS, 2025–2034, (USD MILLION)
FIGURE 127 EGYPT NORTHERN LIGHTS TOURISM CURRENT AND FUTURE END USER ANALYSIS, 2025–2034, (USD MILLION)
FIGURE 128 NIGERIA NORTHERN LIGHTS TOURISM CURRENT AND FUTURE TYPE ANALYSIS, 2025–2034, (USD MILLION)
FIGURE 129 NIGERIA NORTHERN LIGHTS TOURISM CURRENT AND FUTURE END USER ANALYSIS, 2025–2034, (USD MILLION)
FIGURE 130 SOUTH AFRICA NORTHERN LIGHTS TOURISM CURRENT AND FUTURE TYPE ANALYSIS, 2025–2034, (USD MILLION)
FIGURE 131 SOUTH AFRICA NORTHERN LIGHTS TOURISM CURRENT AND FUTURE END USER ANALYSIS, 2025–2034, (USD MILLION)
FIGURE 132 ISRAEL NORTHERN LIGHTS TOURISM CURRENT AND FUTURE TYPE ANALYSIS, 2025–2034, (USD MILLION)
FIGURE 133 ISRAEL NORTHERN LIGHTS TOURISM CURRENT AND FUTURE END USER ANALYSIS, 2025–2034, (USD MILLION)
FIGURE 134 REST OF MEA NORTHERN LIGHTS TOURISM CURRENT AND FUTURE TYPE ANALYSIS, 2025–2034, (USD MILLION)
FIGURE 135 REST OF MEA NORTHERN LIGHTS TOURISM CURRENT AND FUTURE END USER ANALYSIS, 2025–2034, (USD MILLION)
FIGURE 136 U. S. MARKET SHARE ANALYSIS BY TYPE (2024)
FIGURE 137 U. S. MARKET SHARE ANALYSIS BY END USER (2024)
FIGURE 138 CANADA MARKET SHARE ANALYSIS BY TYPE (2024)
FIGURE 139 CANADA MARKET SHARE ANALYSIS BY END USER (2024)
FIGURE 140 MEXICO MARKET SHARE ANALYSIS BY TYPE (2024)
FIGURE 141 MEXICO MARKET SHARE ANALYSIS BY END USER (2024)
FIGURE 142 CHINA MARKET SHARE ANALYSIS BY TYPE (2024)
FIGURE 143 CHINA MARKET SHARE ANALYSIS BY END USER (2024)
FIGURE 144 JAPAN MARKET SHARE ANALYSIS BY TYPE (2024)
FIGURE 145 JAPAN MARKET SHARE ANALYSIS BY END USER (2024)
FIGURE 146 INDIA MARKET SHARE ANALYSIS BY TYPE (2024)
FIGURE 147 INDIA MARKET SHARE ANALYSIS BY END USER (2024)
FIGURE 148 SOUTH KOREA MARKET SHARE ANALYSIS BY TYPE (2024)
FIGURE 149 SOUTH KOREA MARKET SHARE ANALYSIS BY END USER (2024)
FIGURE 150 SAUDI ARABIA MARKET SHARE ANALYSIS BY TYPE (2024)
FIGURE 151 SAUDI ARABIA MARKET SHARE ANALYSIS BY END USER (2024)
FIGURE 152 UAE MARKET SHARE ANALYSIS BY TYPE (2024)
FIGURE 153 UAE MARKET SHARE ANALYSIS BY END USER (2024)
FIGURE 154 EGYPT MARKET SHARE ANALYSIS BY TYPE (2024)
FIGURE 155 EGYPT MARKET SHARE ANALYSIS BY END USER (2024)
FIGURE 156 NIGERIA MARKET SHARE ANALYSIS BY TYPE (2024)
FIGURE 157 NIGERIA MARKET SHARE ANALYSIS BY END USER (2024)
FIGURE 158 SOUTH AFRICA MARKET SHARE ANALYSIS BY TYPE (2024)
FIGURE 159 SOUTH AFRICA MARKET SHARE ANALYSIS BY END USER (2024)
FIGURE 160 GERMANY MARKET SHARE ANALYSIS BY TYPE (2024)
FIGURE 161 GERMANY MARKET SHARE ANALYSIS BY END USER (2024)
FIGURE 162 FRANCE MARKET SHARE ANALYSIS BY TYPE (2024)
FIGURE 163 FRANCE MARKET SHARE ANALYSIS BY END USER (2024)
FIGURE 164 UK MARKET SHARE ANALYSIS BY TYPE (2024)
FIGURE 165 UK MARKET SHARE ANALYSIS BY END USER (2024)
FIGURE 166 SPAIN MARKET SHARE ANALYSIS BY TYPE (2024)
FIGURE 167 SPAIN MARKET SHARE ANALYSIS BY END USER (2024)
FIGURE 168 ITALY MARKET SHARE ANALYSIS BY TYPE (2024)
FIGURE 169 ITALY MARKET SHARE ANALYSIS BY END USER (2024)
FIGURE 170 BRAZIL MARKET SHARE ANALYSIS BY TYPE (2024)
FIGURE 171 BRAZIL MARKET SHARE ANALYSIS BY END USER (2024)
FIGURE 172 ARGENTINA MARKET SHARE ANALYSIS BY TYPE (2024)
FIGURE 173 ARGENTINA MARKET SHARE ANALYSIS BY END USER (2024)
FIGURE 174 COLUMBIA MARKET SHARE ANALYSIS BY TYPE (2024)
FIGURE 175 COLUMBIA MARKET SHARE ANALYSIS BY END USER (2024)
FIGURE 176 GLOBAL NORTHERN LIGHTS TOURISM CURRENT AND FUTURE MARKET KEY COUNTRY LEVEL ANALYSIS, 2024–2034, (USD MILLION)
FIGURE 177 FINANCIAL OVERVIEW:
Key Player Analysis
Abercrombie & Kent: Positioning: leader in premium, land-based aurora journeys with high-touch service and bespoke logistics across Iceland and Lapland. Core products include tailor-made winter programs such as Iceland Wild Winter Adventure and Lapland: A Winter Wonderland, featuring private aurora viewing by chartered yacht, Blue Lagoon Retreat stays, husky sledding, and snowmobiling, with price points that signal upper-upscale demand. Strategic initiatives emphasize 2025 winter capacity and curated departures, with new holiday-season itineraries and small-group caps to protect experience quality during peak aurora months. Differentiators include meaningful commercial hooks for conversion such as air credits and limited-time 2025 savings, which support premium ADRs and advance purchase behavior in long-haul origin markets.
Quark Expeditions: Positioning: leader in polar expedition cruising with hardware-driven access to aurora latitudes via the purpose-built Ultramarine. Core products stress deeper off-ship reach using two twin‑engine helicopters, water‑level Zodiac hangars, and four embarkation points, enabling heli-landing, flightseeing, and heli-hiking to widen weather workarounds during aurora seasons. Strategy centers on adventure density and time-to-experience, with platform features like a 40‑day operational range and rapid Zodiac deployment supporting high activity throughput on Arctic itineraries where clear-sky windows can be short. Differentiation includes the Polar Promise sustainability framework and technical features designed to reduce seabed impact and operational footprint, aligning with destination permitting and stakeholder requirements in 2025.
Lindblad Expeditions: Positioning: leader in education-forward small-ship expeditions under the Lindblad Expeditions–National Geographic alliance, with itineraries across Iceland, Norway, and Greenland that intersect prime aurora windows. Core products include Iceland and Greenland voyages supported by National Geographic photography expertise and science-first programming that raises content value per guest night and strengthens brand trust with mature traveler cohorts. Strategically, the co-branded platform expands addressable demand through expedition storytelling and photography instruction, which sustains yield even when aurora visibility varies due to cloud cover. Differentiators include curated Iceland-to-Greenland routes and Westfjords access that layer cultural visits with late‑season sky conditions favorable for initial aurora activity, improving perceived value for 8–10 day sailings.
Hurtigruten Expeditions (HX) and Hurtigruten Norway: Positioning: leader on Norway’s coast with year‑round sailings since 1893 and category‑defining Northern Lights Promise that reduces customer risk on 11‑ to 12‑day itineraries during the auroral season. Core offerings place guests in the auroral zone for multiple nights on the 12‑day Classic Voyage, with a free future voyage if the lights do not occur within sight of the ship, a strong assurance feature rare in the market. Strategy includes a dual‑brand approach: HX focuses on global expedition growth and sustainability, while Hurtigruten Norway maintains coastal continuity with enhanced aurora programming and onboard alerts to maximize sightings. Differentiators include hybrid battery-powered tonnage led by MS Roald Amundsen and an announced pathway toward zero‑emission capabilities, which support regulatory readiness and brand preference among eco‑conscious travelers in 2025.
As we enter 2025, the Northern Lights tourism market is benefiting from positive trends. Travelers are prioritizing immersive, bucket-list experiences. The sector is expected to surpass USD 1.0 billion in 2025 and approach USD 2.15 billion by 2033, reflecting an annual growth rate of about 10%. Demand is increasingly focused on premium itineraries, with multi-night packages making up an estimated 55% to 65% of bookings. This trend supports higher average trip values and longer stays.
Improved Access and Technology Lift Conversion Rates
Airlines have increased winter capacity to Lapland, Iceland, and Arctic Norway for the 2024 to 2026 seasons. This expansion reduces journey times from key markets. Operators are also using AI-based weather forecasting, Kp-index alerts, and all-sky cameras to enhance sighting success. Reported first-night success rates have improved by 8% to 12% with dynamic routing systems. This allows operators to confidently price their packages while maintaining a premium position.
Restraint
Seasonality and Weather Volatility Constrain Utilization
Seasonality poses a structural challenge, as key viewing windows are limited to about 140 to 170 nights each year. Cloud cover can prevent 30% to 40% of operable evenings in some areas, while tour cancellations during shoulder months range from 12% to 18%. Refunds and rebookings can take up 2% to 4% of revenue, adding to earnings volatility for operators.
Rising Costs and Environmental Compliance Pressure Margins
Rising labor and energy costs are adding more pressure. Several Arctic destinations reported 8% to 12% wage increases and significant utility cost hikes in 2024 and 2025. Environmental regulations regarding protected areas, vehicle emissions, and visitor limits increase compliance costs and restrict capacity during peak season. Operators must effectively manage inventory, staffing, and cash at hand to safeguard their margins under these conditions.
Opportunity
Luxury Infrastructure and Guarantees Drive Above-Market Growth
Premium infrastructure offers the largest growth potential. The luxury and upper-upscale segments are expected to grow at a rate of 12% to 14% annually through 2030, outpacing the overall market. New glass-domed suites, panoramic cabins, and low-impact micro-lodges could generate an additional USD 400 million to 600 million by 2030, especially when combined with sighting guarantees and bundled experiences.
Geographic Expansion Unlocks New Demand Corridors
Geographic diversification provides further growth opportunities. Canada’s Yukon and Northwest Territories, Alaska, and northern Scotland are experiencing increased interest. Outbound travel from Japan, South Korea, and China is boosting demand in Europe and North America from 2025 to 2027. Targeted development of certified guides, shoulder-season products, and nature-culture packages could support 15% to 20% compound growth in these emerging markets.
Trend
Data-Led Operations and Assurance Models Become Standard
Data-driven operations are transitioning from early use to standard practice. Real-time forecasting and routing tools are now employed by 60% to 70% of leading operators. This raises the cumulative probability of three-night sightings to 70% to 80%, compared to 30% to 40% for single-night attempts. Guarantee-backed offerings are gaining market share, with published service tiers reducing rebooking rates by 10% to 15%.
Sustainability and Content Creation Shape Product Design
Sustainability is becoming a key part of product strategy. Electric sleds and hybrid vans make up 10% to 15% of new fleet purchases in 2025. Verified carbon tracking and dark-sky lighting standards are now essential for destination grants. At the same time, content creation, including low-light photography, drone footage, and storytelling, is adding extra revenue and organic reach. Certified operations with measurable results are increasingly affecting partnerships with wholesalers and decisions by national tourism boards.
Recent Developments
Dec 2024 – Lindblad Expeditions: Released 2025–2026 Arctic program brochures, confirming expanded routes across Iceland, Norway, and Greenland with science-led and photography-focused voyages timed to aurora windows. This shores up winter pipeline visibility and strengthens retention among education-oriented travelers.
Jan 2025 – Hurtigruten Norway: Opened bookings for the North Cape Line 2025–2027, a 15-day all‑inclusive winter voyage with 13 stops and 43 departures that places guests in the auroral zone across multiple nights. The Northern Lights Promise remains a core assurance policy, offering a complimentary future voyage if no aurora occurs within sight of the ship, improving conversion in peak season.
Apr 2025 – Lindblad Expeditions: Published The Arctic brochure dated April 27, 2025, highlighting National Geographic photography experts on every voyage and seasonal guidance that aligns departures with higher-probability sky conditions. The content-first approach supports pricing resilience when cloud cover variably affects aurora visibility.
Jun 2025 – Quark Expeditions: Issued the Arctic 2025 brochure introducing a new Northwest Passage to Newfoundland route and formalized helicopter adventure pages for flightseeing and heli-landing via Ultramarine’s twin Airbus H145s. The expanded helicopter program increases off‑ship access and raises perceived value on itineraries overlapping aurora season.
Sep 2025 – Abercrombie & Kent: Updated the Iceland portfolio for 2025 with premium, tailor‑made winter programs that bundle private aurora hunting, geothermal experiences, and small‑group logistics. This deepens upper‑upscale positioning in core aurora gateways and supports advance purchase behavior ahead of the 2025–2026 season.