Nuclear Medicine Market Outlook Size, Share & Growth | CAGR 11.12%
Global Nuclear Medicine Market Size, Share & Analysis By Product Type (Diagnostics, Therapeutics), By Application (Cardiology, Oncology, Neurology, Thyroid, Lymphoma, Bone Metastasis, Urology, Pulmonary Scans, Endocrine Tumor, Other), By End-user (Hospitals, Diagnostic Centers), Technology Advancements, Regulatory Outlook & Forecast 2025–2034
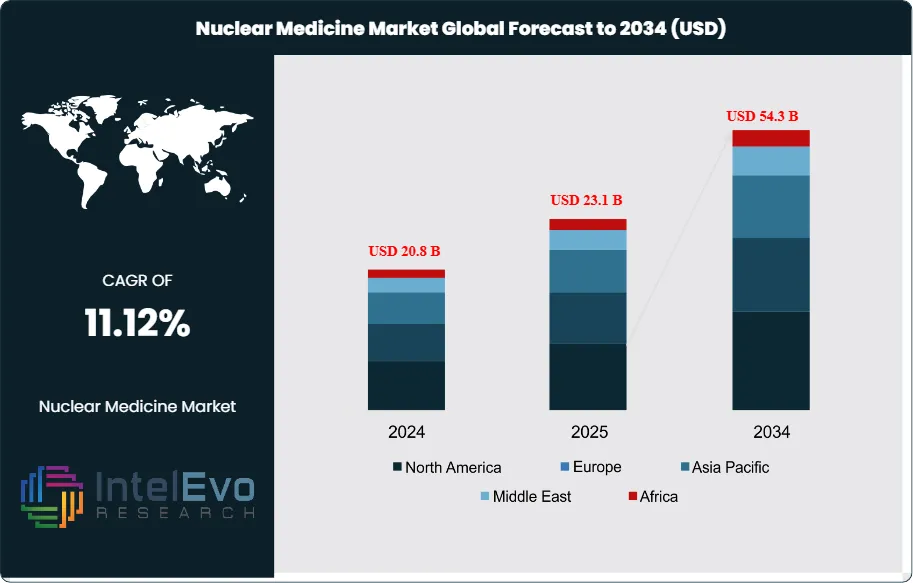
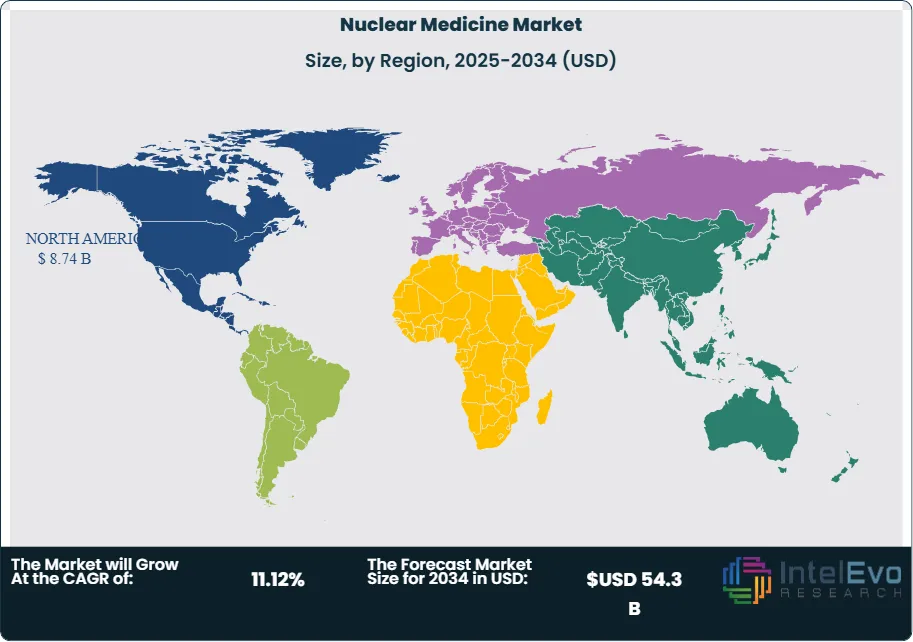
The Nuclear Medicine Market size is expected to be worth around USD 54.3 Billion by 2034, from USD 20.8 Billion in 2024, growing at a CAGR of 11.12% during 2025–2034. This growth trajectory underscores the critical role nuclear medicine plays in modern healthcare, particularly in addressing the global rise in chronic diseases such as cancer and cardiovascular disorders. In 2024, North America accounted for more than 43.5% of the market, valued at USD 8.4 Billion, supported by strong healthcare infrastructure, high adoption of advanced imaging technologies, and significant research investments.
The escalating incidence of cancer worldwide is a primary driver of market demand. According to the World Health Organization (WHO), there were nearly 20 million new cancer cases and 9.7 million cancer-related deaths in 2022, underscoring the need for precise and effective diagnostic and therapeutic tools. Nuclear medicine offers unique value in this context by enabling molecular-level imaging and targeted radiotherapy, which enhances treatment outcomes while minimizing damage to healthy tissues. Its role is particularly vital for long-term cancer management, as advanced imaging systems facilitate ongoing monitoring and earlier disease detection.
Technological advancements are accelerating adoption across both diagnostic and therapeutic domains. The integration of hybrid imaging systems such as PET/CT and SPECT/CT is improving diagnostic accuracy and supporting earlier intervention strategies. Meanwhile, the rise of theranostics—an approach that combines diagnostic scans with targeted therapeutic doses—is reshaping oncology by enabling personalized treatment regimens tailored to individual patient profiles. Growing regulatory support, such as the U.S. FDA’s draft guidance on optimizing dosage for oncology radiopharmaceuticals, reflects the shift toward precision medicine and more effective therapeutic outcomes.
Innovation in radiopharmaceuticals is further broadening the scope of nuclear medicine. Companies are developing next-generation agents designed to target diverse molecular pathways, expanding the applicability of these treatments beyond oncology into cardiology, neurology, and other chronic disease areas. Strategic partnerships between pharmaceutical firms, research institutions, and healthcare providers are accelerating product development and commercialization, while government support through initiatives led by organizations such as the NIH and DOE continues to strengthen the research ecosystem.
Globally, over 10,000 hospitals were reported to use medical radioisotopes in 2024, with nearly 90% of these procedures employed for diagnostics. This widespread usage highlights nuclear medicine’s indispensable role in healthcare delivery. Looking ahead, the convergence of technological innovation, personalized medicine, and sustained public and private sector investment will continue to drive the market’s expansion, reinforcing nuclear medicine as a cornerstone of next-generation healthcare solutions.
Key Takeaways
Market Growth: The global Nuclear Medicine Market generated USD 20.8 Billion in 2024 and is projected to reach USD 54.3 Billion by 2034, growing at a CAGR of 11.2%. Expansion is driven by rising cancer prevalence, increased use of molecular imaging, and broader adoption of targeted radiotherapies.
Product Type: Diagnostic nuclear medicine dominated with a 74.6% share in 2024, supported by widespread use of PET and SPECT imaging in oncology, cardiology, and neurology for early disease detection and monitoring.
Application: Urology accounted for the largest application share at 34.1%, reflecting the increasing use of radiopharmaceuticals in prostate cancer diagnosis and treatment, alongside strong adoption of theranostic approaches in managing urological conditions.
End User: Hospitals held the leading position with 60.5% market share, benefiting from integrated imaging departments, advanced infrastructure, and the ability to deliver both diagnostic and therapeutic nuclear medicine services under one roof.
Driver: Rising global cancer incidence and the demand for precision therapies are accelerating uptake of nuclear medicine, with theranostics emerging as a major driver of personalized treatment strategies.
Restraint: High production costs of radiopharmaceuticals, short half-lives of isotopes, and the need for specialized facilities continue to limit accessibility, particularly in developing regions.
Opportunity: Development of next-generation radiopharmaceuticals and radionuclide therapies targeting new molecular pathways presents significant growth potential, especially in expanding applications beyond oncology into cardiology and neurology.
Trend: The integration of hybrid imaging systems (PET/CT, SPECT/CT) and the rapid rise of theranostic solutions are reshaping the market, enabling earlier diagnosis and highly tailored treatment approaches that align with the shift toward precision medicine.
Product Type Analysis
In 2025, diagnostic nuclear medicine remains the dominant category, accounting for nearly three-fourths of overall revenues. The segment’s strength stems from the widespread clinical use of positron emission tomography (PET) and single-photon emission computed tomography (SPECT) in oncology, cardiology, and neurology. These imaging tools provide unparalleled insights into organ function and disease progression, offering advantages over conventional modalities. The increasing global burden of cancer and cardiovascular diseases continues to reinforce demand for diagnostic applications.
Advances in imaging precision and resolution, combined with hybrid systems that integrate PET/CT and SPECT/CT, are further strengthening adoption. Healthcare providers are prioritizing early detection and preventive care, making nuclear diagnostics a critical part of patient management. With emerging economies now expanding their access to advanced imaging infrastructure, the global adoption of diagnostic nuclear medicine is expected to accelerate steadily over the next decade.
In contrast, the therapeutics segment—including alpha emitters, beta emitters, and brachytherapy—is gaining momentum as targeted radionuclide therapies become more mainstream. These treatments deliver radiation directly to diseased cells while sparing healthy tissues, making them a key driver of precision oncology. Growing clinical evidence and regulatory approvals for targeted radiopharmaceuticals are anticipated to expand this segment’s role significantly through 2034.
By Application Analysis
Urology leads the nuclear medicine market by application, representing more than one-third of global revenues in 2025. This dominance is largely driven by the rising prevalence of prostate cancer and the rapid adoption of prostate-specific membrane antigen (PSMA)-based imaging and therapy. Nuclear medicine techniques are increasingly being used for both diagnosis and therapy in urological conditions, including kidney and bladder cancers, as they enable accurate disease staging and monitoring of treatment efficacy.
Oncology more broadly remains one of the fastest-growing application areas, as theranostic approaches allow for tailored treatment plans based on individual tumor profiles. Cardiology and neurology also represent important use cases, with nuclear imaging widely applied in the assessment of heart perfusion and neurological disorders such as Alzheimer’s disease. The diversification of radiopharmaceutical pipelines toward endocrine tumors, lymphoma, and pulmonary conditions demonstrates the widening scope of nuclear medicine beyond its traditional strongholds.
End-User Analysis
Hospitals remain the largest end-user segment, accounting for more than 60% of global demand in 2025. These facilities are the primary centers for both diagnostic imaging and therapeutic nuclear medicine due to their access to advanced infrastructure, specialist expertise, and patient volumes. With cancer and cardiovascular cases increasing globally, hospitals continue to be the frontline for adopting PET and SPECT technologies, as well as for administering radionuclide therapies.
The integration of nuclear medicine into treatment pathways—such as disease staging, therapy planning, and monitoring outcomes—has further cemented hospitals’ dominance. Investment in cutting-edge equipment and the expansion of outpatient imaging departments are expected to sustain this leadership. Meanwhile, diagnostic centers are emerging as strong secondary players, offering specialized services with faster turnaround times, particularly in urban markets. As accessibility improves, smaller treatment centers and private diagnostic labs are expected to play a growing role in extending nuclear medicine to wider populations.
Regional Analysis
North America remains the global leader in nuclear medicine, holding over 42% of total market share in 2025. The region benefits from advanced healthcare infrastructure, early adoption of novel radiopharmaceuticals, and substantial R&D investments. The U.S. Food and Drug Administration (FDA) continues to accelerate market access through approvals of next-generation radiopharmaceuticals, supporting rapid integration into clinical practice. The significant cancer burden in the U.S., with over 2 million new cases estimated in 2025, ensures sustained demand for both diagnostic and therapeutic nuclear medicine.
Asia Pacific is projected to record the fastest CAGR during the forecast period. Countries such as China and India are witnessing surging cancer incidence rates, coupled with expanding healthcare spending and government-backed initiatives to improve access to advanced medical technologies. For example, India’s rising public health budget allocations are enhancing imaging infrastructure and radiotherapy facilities across major cities. The large, aging population in the region is also fueling demand for both diagnostic imaging and therapeutic solutions.
Europe continues to demonstrate strong adoption, supported by a growing focus on personalized medicine and stringent clinical guidelines that promote advanced imaging in oncology and cardiology. Meanwhile, the Middle East & Africa and Latin America are emerging markets, where rising investments in healthcare infrastructure and partnerships with global radiopharmaceutical companies are expanding access to nuclear medicine. These regions represent untapped potential as demand for cancer care and non-invasive diagnostics continues to rise.
By Product Type (Diagnostics, Therapeutics), By Application (Cardiology, Oncology, Neurology, Thyroid, Lymphoma, Bone Metastasis, Urology, Pulmonary Scans, Endocrine Tumor, Other), By End-user (Hospitals, Diagnostic Centers)
Research Methodology
Primary Research- 100 Interviews of Stakeholders
Secondary Research
Desk Research
Regional scope
North America (United States, Canada, Mexico)
Latin America (Brazil, Argentina, Columbia)
East Asia And Pacific (China, Japan, South Korea, Australia, Cambodia, Fiji, Indonesia)
Sea And South Asia (India, Singapore, Thailand, Taiwan, Malaysia)
Eastern Europe (Poland, Russia, Czech Republic, Romania)
Western Europe (Germany, U.K., France, Spain, Itlay)
Middle East & Africa (GCC Countries, Egypt, Nigeria, South Africa, Israel)
Competitive Landscape
The institute for radioelements, The Australian Nuclear Science and Technology Organization, NTP Radioisotopes SOC Ltd, Nordion (Canada), Inc, Mallinckrodt, Lantheus Medical Imaging, Inc, Jubilant Life Sciences Ltd, GE Healthcare, Eczacıbaşı-Monrol, Eckert & Ziegler, Cardinal Health, Bracco Imaging S.P.A
Customization Scope
Customization for segments, region/country-level will be provided. Moreover, additional customization can be done based on the requirements.
Pricing and Purchase Options
Avail customized purchase options to meet your exact research needs. We have three licenses to opt for: Single User License, Multi-User License (Up to 5 Users), Corporate Use License (Unlimited User and Printable PDF).
TABLE OF CONTENTS
1. EXECUTIVE SUMMARY
1.1. MARKET SNAPSHOT
1.2. KEY FINDINGS & INSIGHTS
1.3. ANALYST RECOMMENDATIONS
1.4. FUTURE OUTLOOK
2. RESEARCH METHODOLOGY
2.1. MARKET DEFINITION & SCOPE
2.2. RESEARCH OBJECTIVES: PRIMARY & SECONDARY DATA SOURCES
2.3. DATA COLLECTION SOURCES
2.3.1. COVERAGE OF 100+ PRIMARY RESEARCH/CONSULTATION CALLS WITH INDUSTRY STAKEHOLDERS
FIGURE 17 NORTH AMERICA NUCLEAR MEDICINE CURRENT AND FUTURE TYPE ANALYSIS, 2025–2034, (USD MILLION)
FIGURE 18 NORTH AMERICA NUCLEAR MEDICINE CURRENT AND FUTURE END USER ANALYSIS, 2025–2034, (USD MILLION)
FIGURE 19 MARKET SHARE BY COUNTRY
FIGURE 20 LATIN AMERICA NUCLEAR MEDICINE CURRENT AND FUTURE TYPE ANALYSIS, 2025–2034, (USD MILLION)
FIGURE 21 LATIN AMERICA NUCLEAR MEDICINE CURRENT AND FUTURE END USER ANALYSIS, 2025–2034, (USD MILLION)
FIGURE 22 MARKET SHARE BY COUNTRY
FIGURE 23 EASTERN EUROPE NUCLEAR MEDICINE CURRENT AND FUTURE TYPE ANALYSIS, 2025–2034, (USD MILLION)
FIGURE 24 EASTERN EUROPE NUCLEAR MEDICINE CURRENT AND FUTURE END USER ANALYSIS, 2025–2034, (USD MILLION)
FIGURE 25 MARKET SHARE BY COUNTRY
FIGURE 26 WESTERN EUROPE NUCLEAR MEDICINE CURRENT AND FUTURE TYPE ANALYSIS, 2025–2034, (USD MILLION)
FIGURE 27 WESTERN EUROPE NUCLEAR MEDICINE CURRENT AND FUTURE END USER ANALYSIS, 2025–2034, (USD MILLION)
FIGURE 28 MARKET SHARE BY COUNTRY
FIGURE 29 EAST ASIA AND PACIFIC NUCLEAR MEDICINE CURRENT AND FUTURE TYPE ANALYSIS, 2025–2034, (USD MILLION)
FIGURE 30 EAST ASIA AND PACIFIC NUCLEAR MEDICINE CURRENT AND FUTURE END USER ANALYSIS, 2025–2034, (USD MILLION)
FIGURE 31 MARKET SHARE BY COUNTRY
FIGURE 32 SEA AND SOUTH ASIA NUCLEAR MEDICINE CURRENT AND FUTURE TYPE ANALYSIS, 2025–2034, (USD MILLION)
FIGURE 33 SEA AND SOUTH ASIA NUCLEAR MEDICINE CURRENT AND FUTURE END USER ANALYSIS, 2025–2034, (USD MILLION)
FIGURE 34 MARKET SHARE BY COUNTRY
FIGURE 35 MIDDLE EAST AND AFRICA NUCLEAR MEDICINE CURRENT AND FUTURE TYPE ANALYSIS, 2025–2034, (USD MILLION)
FIGURE 36 MIDDLE EAST AND AFRICA NUCLEAR MEDICINE CURRENT AND FUTURE END USER ANALYSIS, 2025–2034, (USD MILLION)
FIGURE 37 NORTH AMERICA NUCLEAR MEDICINE CURRENT AND FUTURE MARKET VOLUME SHARE REGIONAL ANALYSIS, 2025–2034, (USD MILLION)
FIGURE 38 U.S. NUCLEAR MEDICINE CURRENT AND FUTURE TYPE ANALYSIS, 2025–2034, (USD MILLION)
FIGURE 39 U.S. NUCLEAR MEDICINE CURRENT AND FUTURE END USER ANALYSIS, 2025–2034, (USD MILLION)
FIGURE 40 CANADA NUCLEAR MEDICINE CURRENT AND FUTURE TYPE ANALYSIS, 2025–2034, (USD MILLION)
FIGURE 41 CANADA NUCLEAR MEDICINE CURRENT AND FUTURE END USER ANALYSIS, 2025–2034, (USD MILLION)
FIGURE 42 LATIN AMERICA NUCLEAR MEDICINE CURRENT AND FUTURE MARKET VOLUME SHARE REGIONAL ANALYSIS, 2025–2034, (USD MILLION)
FIGURE 43 MEXICO NUCLEAR MEDICINE CURRENT AND FUTURE TYPE ANALYSIS, 2025–2034, (USD MILLION)
FIGURE 44 MEXICO NUCLEAR MEDICINE CURRENT AND FUTURE END USER ANALYSIS, 2025–2034, (USD MILLION)
FIGURE 45 BRAZIL NUCLEAR MEDICINE CURRENT AND FUTURE TYPE ANALYSIS, 2025–2034, (USD MILLION)
FIGURE 46 BRAZIL NUCLEAR MEDICINE CURRENT AND FUTURE END USER ANALYSIS, 2025–2034, (USD MILLION)
FIGURE 47 ARGENTINA NUCLEAR MEDICINE CURRENT AND FUTURE TYPE ANALYSIS, 2025–2034, (USD MILLION)
FIGURE 48 ARGENTINA NUCLEAR MEDICINE CURRENT AND FUTURE END USER ANALYSIS, 2025–2034, (USD MILLION)
FIGURE 49 COLUMBIA NUCLEAR MEDICINE CURRENT AND FUTURE TYPE ANALYSIS, 2025–2034, (USD MILLION)
FIGURE 50 COLUMBIA NUCLEAR MEDICINE CURRENT AND FUTURE END USER ANALYSIS, 2025–2034, (USD MILLION)
FIGURE 51 REST OF LATIN AMERICA NUCLEAR MEDICINE CURRENT AND FUTURE TYPE ANALYSIS, 2025–2034, (USD MILLION)
FIGURE 52 REST OF LATIN AMERICA NUCLEAR MEDICINE CURRENT AND FUTURE END USER ANALYSIS, 2025–2034, (USD MILLION)
FIGURE 53 EASTERN EUROPE NUCLEAR MEDICINE CURRENT AND FUTURE MARKET VOLUME SHARE REGIONAL ANALYSIS, 2025–2034, (USD MILLION)
FIGURE 54 POLAND NUCLEAR MEDICINE CURRENT AND FUTURE TYPE ANALYSIS, 2025–2034, (USD MILLION)
FIGURE 55 POLAND NUCLEAR MEDICINE CURRENT AND FUTURE END USER ANALYSIS, 2025–2034, (USD MILLION)
FIGURE 56 RUSSIA NUCLEAR MEDICINE CURRENT AND FUTURE TYPE ANALYSIS, 2025–2034, (USD MILLION)
FIGURE 57 RUSSIA NUCLEAR MEDICINE CURRENT AND FUTURE END USER ANALYSIS, 2025–2034, (USD MILLION)
FIGURE 58 CZECH REPUBLIC NUCLEAR MEDICINE CURRENT AND FUTURE TYPE ANALYSIS, 2025–2034, (USD MILLION)
FIGURE 59 CZECH REPUBLIC NUCLEAR MEDICINE CURRENT AND FUTURE END USER ANALYSIS, 2025–2034, (USD MILLION)
FIGURE 60 ROMANIA NUCLEAR MEDICINE CURRENT AND FUTURE TYPE ANALYSIS, 2025–2034, (USD MILLION)
FIGURE 61 ROMANIA NUCLEAR MEDICINE CURRENT AND FUTURE END USER ANALYSIS, 2025–2034, (USD MILLION)
FIGURE 62 REST OF EASTERN EUROPE NUCLEAR MEDICINE CURRENT AND FUTURE TYPE ANALYSIS, 2025–2034, (USD MILLION)
FIGURE 63 REST OF EASTERN EUROPE NUCLEAR MEDICINE CURRENT AND FUTURE END USER ANALYSIS, 2025–2034, (USD MILLION)
FIGURE 64 WESTERN EUROPE NUCLEAR MEDICINE CURRENT AND FUTURE MARKET VOLUME SHARE REGIONAL ANALYSIS, 2025–2034, (USD MILLION)
FIGURE 65 GERMANY NUCLEAR MEDICINE CURRENT AND FUTURE TYPE ANALYSIS, 2025–2034, (USD MILLION)
FIGURE 66 GERMANY NUCLEAR MEDICINE CURRENT AND FUTURE END USER ANALYSIS, 2025–2034, (USD MILLION)
FIGURE 67 FRANCE NUCLEAR MEDICINE CURRENT AND FUTURE TYPE ANALYSIS, 2025–2034, (USD MILLION)
FIGURE 68 FRANCE NUCLEAR MEDICINE CURRENT AND FUTURE END USER ANALYSIS, 2025–2034, (USD MILLION)
FIGURE 69 UK NUCLEAR MEDICINE CURRENT AND FUTURE TYPE ANALYSIS, 2025–2034, (USD MILLION)
FIGURE 70 UK NUCLEAR MEDICINE CURRENT AND FUTURE END USER ANALYSIS, 2025–2034, (USD MILLION)
FIGURE 71 SPAIN NUCLEAR MEDICINE CURRENT AND FUTURE TYPE ANALYSIS, 2025–2034, (USD MILLION)
FIGURE 72 SPAIN NUCLEAR MEDICINE CURRENT AND FUTURE END USER ANALYSIS, 2025–2034, (USD MILLION)
FIGURE 73 ITALY NUCLEAR MEDICINE CURRENT AND FUTURE TYPE ANALYSIS, 2025–2034, (USD MILLION)
FIGURE 74 ITALY NUCLEAR MEDICINE CURRENT AND FUTURE END USER ANALYSIS, 2025–2034, (USD MILLION)
FIGURE 75 REST OF WESTERN EUROPE NUCLEAR MEDICINE CURRENT AND FUTURE TYPE ANALYSIS, 2025–2034, (USD MILLION)
FIGURE 76 REST OF WESTERN EUROPE NUCLEAR MEDICINE CURRENT AND FUTURE END USER ANALYSIS, 2025–2034, (USD MILLION)
FIGURE 77 EAST ASIA AND PACIFIC NUCLEAR MEDICINE CURRENT AND FUTURE MARKET VOLUME SHARE REGIONAL ANALYSIS, 2025–2034, (USD MILLION)
FIGURE 78 CHINA NUCLEAR MEDICINE CURRENT AND FUTURE TYPE ANALYSIS, 2025–2034, (USD MILLION)
FIGURE 79 CHINA NUCLEAR MEDICINE CURRENT AND FUTURE END USER ANALYSIS, 2025–2034, (USD MILLION)
FIGURE 80 JAPAN NUCLEAR MEDICINE CURRENT AND FUTURE TYPE ANALYSIS, 2025–2034, (USD MILLION)
FIGURE 81 JAPAN NUCLEAR MEDICINE CURRENT AND FUTURE END USER ANALYSIS, 2025–2034, (USD MILLION)
FIGURE 82 AUSTRALIA NUCLEAR MEDICINE CURRENT AND FUTURE TYPE ANALYSIS, 2025–2034, (USD MILLION)
FIGURE 83 AUSTRALIA NUCLEAR MEDICINE CURRENT AND FUTURE END USER ANALYSIS, 2025–2034, (USD MILLION)
FIGURE 84 CAMBODIA NUCLEAR MEDICINE CURRENT AND FUTURE TYPE ANALYSIS, 2025–2034, (USD MILLION)
FIGURE 85 CAMBODIA NUCLEAR MEDICINE CURRENT AND FUTURE END USER ANALYSIS, 2025–2034, (USD MILLION)
FIGURE 86 FIJI NUCLEAR MEDICINE CURRENT AND FUTURE TYPE ANALYSIS, 2025–2034, (USD MILLION)
FIGURE 87 FIJI NUCLEAR MEDICINE CURRENT AND FUTURE END USER ANALYSIS, 2025–2034, (USD MILLION)
FIGURE 88 INDONESIA NUCLEAR MEDICINE CURRENT AND FUTURE TYPE ANALYSIS, 2025–2034, (USD MILLION)
FIGURE 89 INDONESIA NUCLEAR MEDICINE CURRENT AND FUTURE END USER ANALYSIS, 2025–2034, (USD MILLION)
FIGURE 90 SOUTH KOREA NUCLEAR MEDICINE CURRENT AND FUTURE TYPE ANALYSIS, 2025–2034, (USD MILLION)
FIGURE 91 SOUTH KOREA NUCLEAR MEDICINE CURRENT AND FUTURE END USER ANALYSIS, 2025–2034, (USD MILLION)
FIGURE 92 REST OF EAST ASIA AND PACIFIC NUCLEAR MEDICINE CURRENT AND FUTURE TYPE ANALYSIS, 2025–2034, (USD MILLION)
FIGURE 93 REST OF EAST ASIA AND PACIFIC NUCLEAR MEDICINE CURRENT AND FUTURE END USER ANALYSIS, 2025–2034, (USD MILLION)
FIGURE 94 SEA AND SOUTH ASIA NUCLEAR MEDICINE CURRENT AND FUTURE MARKET VOLUME SHARE REGIONAL ANALYSIS, 2025–2034, (USD MILLION)
FIGURE 95 BANGLADESH NUCLEAR MEDICINE CURRENT AND FUTURE TYPE ANALYSIS, 2025–2034, (USD MILLION)
FIGURE 96 BANGLADESH NUCLEAR MEDICINE CURRENT AND FUTURE END USER ANALYSIS, 2025–2034, (USD MILLION)
FIGURE 97 NEW ZEALAND NUCLEAR MEDICINE CURRENT AND FUTURE TYPE ANALYSIS, 2025–2034, (USD MILLION)
FIGURE 98 NEW ZEALAND NUCLEAR MEDICINE CURRENT AND FUTURE END USER ANALYSIS, 2025–2034, (USD MILLION)
FIGURE 99 INDIA NUCLEAR MEDICINE CURRENT AND FUTURE TYPE ANALYSIS, 2025–2034, (USD MILLION)
FIGURE 100 INDIA NUCLEAR MEDICINE CURRENT AND FUTURE END USER ANALYSIS, 2025–2034, (USD MILLION)
FIGURE 101 SINGAPORE NUCLEAR MEDICINE CURRENT AND FUTURE TYPE ANALYSIS, 2025–2034, (USD MILLION)
FIGURE 102 SINGAPORE NUCLEAR MEDICINE CURRENT AND FUTURE END USER ANALYSIS, 2025–2034, (USD MILLION)
FIGURE 103 THAILAND NUCLEAR MEDICINE CURRENT AND FUTURE TYPE ANALYSIS, 2025–2034, (USD MILLION)
FIGURE 104 THAILAND NUCLEAR MEDICINE CURRENT AND FUTURE END USER ANALYSIS, 2025–2034, (USD MILLION)
FIGURE 105 TAIWAN NUCLEAR MEDICINE CURRENT AND FUTURE TYPE ANALYSIS, 2025–2034, (USD MILLION)
FIGURE 106 TAIWAN NUCLEAR MEDICINE CURRENT AND FUTURE END USER ANALYSIS, 2025–2034, (USD MILLION)
FIGURE 107 MALAYSIA NUCLEAR MEDICINE CURRENT AND FUTURE TYPE ANALYSIS, 2025–2034, (USD MILLION)
FIGURE 108 MALAYSIA NUCLEAR MEDICINE CURRENT AND FUTURE END USER ANALYSIS, 2025–2034, (USD MILLION)
FIGURE 109 REST OF SEA AND SOUTH ASIA NUCLEAR MEDICINE CURRENT AND FUTURE TYPE ANALYSIS, 2025–2034, (USD MILLION)
FIGURE 110 REST OF SEA AND SOUTH ASIA NUCLEAR MEDICINE CURRENT AND FUTURE END USER ANALYSIS, 2025–2034, (USD MILLION)
FIGURE 111 MIDDLE EAST AND AFRICA NUCLEAR MEDICINE CURRENT AND FUTURE MARKET VOLUME SHARE REGIONAL ANALYSIS, 2025–2034, (USD MILLION)
FIGURE 112 GCC COUNTRIES NUCLEAR MEDICINE CURRENT AND FUTURE TYPE ANALYSIS, 2025–2034, (USD MILLION)
FIGURE 113 GCC COUNTRIES NUCLEAR MEDICINE CURRENT AND FUTURE END USER ANALYSIS, 2025–2034, (USD MILLION)
FIGURE 114 SAUDI ARABIA NUCLEAR MEDICINE CURRENT AND FUTURE TYPE ANALYSIS, 2025–2034, (USD MILLION)
FIGURE 115 SAUDI ARABIA NUCLEAR MEDICINE CURRENT AND FUTURE END USER ANALYSIS, 2025–2034, (USD MILLION)
FIGURE 116 UAE NUCLEAR MEDICINE CURRENT AND FUTURE TYPE ANALYSIS, 2025–2034, (USD MILLION)
FIGURE 117 UAE NUCLEAR MEDICINE CURRENT AND FUTURE END USER ANALYSIS, 2025–2034, (USD MILLION)
FIGURE 118 BAHRAIN NUCLEAR MEDICINE CURRENT AND FUTURE TYPE ANALYSIS, 2025–2034, (USD MILLION)
FIGURE 119 BAHRAIN NUCLEAR MEDICINE CURRENT AND FUTURE END USER ANALYSIS, 2025–2034, (USD MILLION)
FIGURE 120 KUWAIT NUCLEAR MEDICINE CURRENT AND FUTURE TYPE ANALYSIS, 2025–2034, (USD MILLION)
FIGURE 121 KUWAIT NUCLEAR MEDICINE CURRENT AND FUTURE END USER ANALYSIS, 2025–2034, (USD MILLION)
FIGURE 122 OMAN NUCLEAR MEDICINE CURRENT AND FUTURE TYPE ANALYSIS, 2025–2034, (USD MILLION)
FIGURE 123 OMAN NUCLEAR MEDICINE CURRENT AND FUTURE END USER ANALYSIS, 2025–2034, (USD MILLION)
FIGURE 124 QATAR NUCLEAR MEDICINE CURRENT AND FUTURE TYPE ANALYSIS, 2025–2034, (USD MILLION)
FIGURE 125 QATAR NUCLEAR MEDICINE CURRENT AND FUTURE END USER ANALYSIS, 2025–2034, (USD MILLION)
FIGURE 126 EGYPT NUCLEAR MEDICINE CURRENT AND FUTURE TYPE ANALYSIS, 2025–2034, (USD MILLION)
FIGURE 127 EGYPT NUCLEAR MEDICINE CURRENT AND FUTURE END USER ANALYSIS, 2025–2034, (USD MILLION)
FIGURE 128 NIGERIA NUCLEAR MEDICINE CURRENT AND FUTURE TYPE ANALYSIS, 2025–2034, (USD MILLION)
FIGURE 129 NIGERIA NUCLEAR MEDICINE CURRENT AND FUTURE END USER ANALYSIS, 2025–2034, (USD MILLION)
FIGURE 130 SOUTH AFRICA NUCLEAR MEDICINE CURRENT AND FUTURE TYPE ANALYSIS, 2025–2034, (USD MILLION)
FIGURE 131 SOUTH AFRICA NUCLEAR MEDICINE CURRENT AND FUTURE END USER ANALYSIS, 2025–2034, (USD MILLION)
FIGURE 132 ISRAEL NUCLEAR MEDICINE CURRENT AND FUTURE TYPE ANALYSIS, 2025–2034, (USD MILLION)
FIGURE 133 ISRAEL NUCLEAR MEDICINE CURRENT AND FUTURE END USER ANALYSIS, 2025–2034, (USD MILLION)
FIGURE 134 REST OF MEA NUCLEAR MEDICINE CURRENT AND FUTURE TYPE ANALYSIS, 2025–2034, (USD MILLION)
FIGURE 135 REST OF MEA NUCLEAR MEDICINE CURRENT AND FUTURE END USER ANALYSIS, 2025–2034, (USD MILLION)
FIGURE 136 U. S. MARKET SHARE ANALYSIS BY TYPE (2024)
FIGURE 137 U. S. MARKET SHARE ANALYSIS BY END USER (2024)
FIGURE 138 CANADA MARKET SHARE ANALYSIS BY TYPE (2024)
FIGURE 139 CANADA MARKET SHARE ANALYSIS BY END USER (2024)
FIGURE 140 MEXICO MARKET SHARE ANALYSIS BY TYPE (2024)
FIGURE 141 MEXICO MARKET SHARE ANALYSIS BY END USER (2024)
FIGURE 142 CHINA MARKET SHARE ANALYSIS BY TYPE (2024)
FIGURE 143 CHINA MARKET SHARE ANALYSIS BY END USER (2024)
FIGURE 144 JAPAN MARKET SHARE ANALYSIS BY TYPE (2024)
FIGURE 145 JAPAN MARKET SHARE ANALYSIS BY END USER (2024)
FIGURE 146 INDIA MARKET SHARE ANALYSIS BY TYPE (2024)
FIGURE 147 INDIA MARKET SHARE ANALYSIS BY END USER (2024)
FIGURE 148 SOUTH KOREA MARKET SHARE ANALYSIS BY TYPE (2024)
FIGURE 149 SOUTH KOREA MARKET SHARE ANALYSIS BY END USER (2024)
FIGURE 150 SAUDI ARABIA MARKET SHARE ANALYSIS BY TYPE (2024)
FIGURE 151 SAUDI ARABIA MARKET SHARE ANALYSIS BY END USER (2024)
FIGURE 152 UAE MARKET SHARE ANALYSIS BY TYPE (2024)
FIGURE 153 UAE MARKET SHARE ANALYSIS BY END USER (2024)
FIGURE 154 EGYPT MARKET SHARE ANALYSIS BY TYPE (2024)
FIGURE 155 EGYPT MARKET SHARE ANALYSIS BY END USER (2024)
FIGURE 156 NIGERIA MARKET SHARE ANALYSIS BY TYPE (2024)
FIGURE 157 NIGERIA MARKET SHARE ANALYSIS BY END USER (2024)
FIGURE 158 SOUTH AFRICA MARKET SHARE ANALYSIS BY TYPE (2024)
FIGURE 159 SOUTH AFRICA MARKET SHARE ANALYSIS BY END USER (2024)
FIGURE 160 GERMANY MARKET SHARE ANALYSIS BY TYPE (2024)
FIGURE 161 GERMANY MARKET SHARE ANALYSIS BY END USER (2024)
FIGURE 162 FRANCE MARKET SHARE ANALYSIS BY TYPE (2024)
FIGURE 163 FRANCE MARKET SHARE ANALYSIS BY END USER (2024)
FIGURE 164 UK MARKET SHARE ANALYSIS BY TYPE (2024)
FIGURE 165 UK MARKET SHARE ANALYSIS BY END USER (2024)
FIGURE 166 SPAIN MARKET SHARE ANALYSIS BY TYPE (2024)
FIGURE 167 SPAIN MARKET SHARE ANALYSIS BY END USER (2024)
FIGURE 168 ITALY MARKET SHARE ANALYSIS BY TYPE (2024)
FIGURE 169 ITALY MARKET SHARE ANALYSIS BY END USER (2024)
FIGURE 170 BRAZIL MARKET SHARE ANALYSIS BY TYPE (2024)
FIGURE 171 BRAZIL MARKET SHARE ANALYSIS BY END USER (2024)
FIGURE 172 ARGENTINA MARKET SHARE ANALYSIS BY TYPE (2024)
FIGURE 173 ARGENTINA MARKET SHARE ANALYSIS BY END USER (2024)
FIGURE 174 COLUMBIA MARKET SHARE ANALYSIS BY TYPE (2024)
FIGURE 175 COLUMBIA MARKET SHARE ANALYSIS BY END USER (2024)
FIGURE 176 GLOBAL NUCLEAR MEDICINE CURRENT AND FUTURE MARKET KEY COUNTRY LEVEL ANALYSIS, 2024–2034, (USD MILLION)
FIGURE 177 FINANCIAL OVERVIEW:
Key Player Analysis
The Institute for Radioelements (IRE): The Institute for Radioelements (IRE) continues to play a central role in the global supply of Molybdenum-99, a critical isotope used in diagnostic imaging. As of 2025, IRE has strengthened its market positioning through investments in sustainable isotope production methods, including low-enriched uranium technologies, to ensure long-term supply stability amid rising regulatory scrutiny. The organization is also diversifying its portfolio toward emerging therapeutic isotopes, aligning with the growing demand for theranostics in oncology. By modernizing its production infrastructure and expanding strategic partnerships with pharmaceutical companies, IRE is consolidating its role as a dependable global supplier in an otherwise fragile supply chain.
The Australian Nuclear Science and Technology Organization (ANSTO): ANSTO remains one of the leading producers of nuclear medicine isotopes in the Asia-Pacific region, supplying key markets across Australia and neighboring countries. In 2025, ANSTO’s Lucas Heights facility continues to be a cornerstone of global isotope supply, particularly for Molybdenum-99 and other short-lived isotopes used in PET and SPECT imaging. The organization has also prioritized R&D, expanding its focus on therapeutic isotopes such as Lutetium-177, which is increasingly being used in targeted cancer therapies. With strong government support and an emphasis on securing regional supply chains, ANSTO is positioned as both a stabilizer in the global market and an innovation driver in isotope development.
NTP Radioisotopes SOC Ltd: South Africa-based NTP Radioisotopes SOC Ltd is one of the few organizations globally capable of producing large-scale volumes of medical isotopes, making it a key player in ensuring supply chain resilience. In 2025, the company is actively investing in facility upgrades and process optimization to meet the rising demand for diagnostic and therapeutic isotopes. NTP has also pursued collaborations with international pharmaceutical firms to expand its footprint in theranostics and radionuclide therapy markets. By leveraging its geographic advantage and production capacity, NTP is reinforcing its status as a crucial supplier in addressing both regional and global shortages of vital radiopharmaceuticals.
Nordion (Canada) Inc.: Nordion continues to be a pivotal supplier of cobalt-60 and other isotopes for both medical and industrial applications. Within nuclear medicine, the company’s focus on supplying isotopes for sterilization and therapeutic use remains a differentiating strength. In 2025, Nordion is investing in advanced production technologies and expanding partnerships with reactor operators to secure long-term isotope availability. Its strategic collaborations with global healthcare firms have enabled the company to move deeper into targeted therapies, particularly in oncology. By combining robust production capacity with a diversified isotope portfolio, Nordion maintains its reputation as a leader in reliability and innovation in the radiopharmaceutical supply chain.
Mallinckrodt: Mallinckrodt has established itself as one of the most prominent pharmaceutical companies in the radiopharmaceutical space, particularly through its extensive portfolio of diagnostic imaging agents. In 2025, the company is emphasizing innovation in SPECT and PET tracers to expand clinical applications beyond oncology, targeting neurology and cardiology. Mallinckrodt is also investing in theranostics, developing targeted radioligand therapies that complement its existing diagnostic capabilities. Despite facing competitive pressures, the firm’s global distribution network, regulatory expertise, and history of product reliability ensure that it remains a key force shaping the direction of the nuclear medicine market.
Market Key Players
The institute for radioelements
The Australian Nuclear Science and Technology Organization
NTP Radioisotopes SOC Ltd
Nordion (Canada), Inc
Mallinckrodt
Lantheus Medical Imaging, Inc
Jubilant Life Sciences Ltd
GE Healthcare
Eczacıbaşı-Monrol
Eckert & Ziegler
Cardinal Health
Bracco Imaging S.P.A
Driver:
Rising Disease Burden Fuels Demand for Precision Imaging and Therapy
As of 2025, the rapid increase in chronic illnesses, particularly cancer and cardiovascular disorders, remains the most powerful force driving the nuclear medicine market. These conditions represent the largest share of global mortality and require advanced diagnostic and therapeutic solutions. Nuclear medicine techniques—such as PET and SPECT imaging—enable early detection and precise monitoring by providing molecular-level insights into disease processes. On the therapeutic side, targeted radiopharmaceuticals are increasingly being deployed to deliver localized treatment, improving outcomes while minimizing systemic side effects.
The scale of the global health challenge is immense. Projections from international health agencies indicate continued growth in cancer incidence and cardiovascular complications well into the next two decades. This expanding patient population is fueling strong adoption of nuclear medicine as healthcare systems prioritize earlier intervention and personalized therapies, ensuring sustained market growth throughout the forecast horizon.
Restraint:
Infrastructure Costs and Isotope Supply Challenges
A key barrier to broader adoption of nuclear medicine in 2025 lies in the high cost of infrastructure and the fragile logistics of isotope supply. Advanced imaging systems, such as PET-CT scanners, require significant capital investment and ongoing maintenance, often placing them out of reach for smaller hospitals and facilities in emerging markets. This limits accessibility and slows penetration outside well-funded healthcare systems.
Equally pressing is the reliance on short half-life isotopes such as Fluorine-18 and Molybdenum-99, which must be produced and delivered within tightly constrained timeframes. Supply chain disruptions—whether from reactor maintenance shutdowns or geopolitical constraints—pose substantial risks to patient care. Workforce shortages of nuclear medicine technologists further amplify the challenge, constraining the ability of providers to expand services even where demand is rising.
Opportunity:
Expanding Role of Theranostics in Personalized Care
One of the most significant opportunities for the sector in 2025 is the rapid acceleration of theranostics—the integration of diagnostic imaging with targeted therapy. This approach leverages a single molecular agent to both locate disease sites and deliver therapeutic radiation directly to affected tissues. Already gaining momentum in oncology, theranostics is being used for prostate cancer and neuroendocrine tumors, with a growing pipeline of clinical trials expanding into other cancer types and beyond.
The dual ability to diagnose and treat using the same molecular pathway is reshaping patient care by reducing treatment cycles and improving precision. Regulatory approvals in recent years, alongside strong interest from global pharmaceutical firms, signal a market poised for expansion. As healthcare systems move toward value-based and personalized medicine models, theranostics offers a transformative pathway for both improved outcomes and more efficient use of healthcare resources.
Trend:
Diversification into Neurology and Cardiology Applications
While oncology continues to dominate nuclear medicine, 2025 is witnessing a strong trend toward the development of radiotracers for neurological and cardiovascular conditions. Innovative PET tracers are being designed to visualize proteins associated with Alzheimer’s and Parkinson’s disease, offering the potential for earlier and more accurate diagnosis. Similarly, new agents for cardiac imaging are improving detection of ischemic heart disease and assessing myocardial viability, areas of growing clinical importance given rising global heart disease prevalence.
This diversification broadens the scope of nuclear medicine beyond oncology, positioning it as a central technology across multiple therapeutic domains. By expanding into neurology and cardiology, companies are not only opening new revenue streams but also aligning nuclear medicine with broader healthcare priorities such as early diagnosis, aging population care, and chronic disease management. These advancements are expected to reshape the clinical landscape and accelerate adoption in new markets over the next decade.
Recent Developments
December 2024 – Institute for Radioelements (IRE): IRE received a new 30 MeV IBA cyclotron at its Fleurus facility to enhance in-house production of Germanium‑68. This investment expands isotopic production capacity and reduces reliance on external suppliers, improving scalability for diagnostic imaging agents.
March 2025 – Nusano Production Platform (launching in 2025 in Utah): Nusano unveiled plans for a cutting-edge facility capable of producing over 40 distinct radioisotopes. By establishing a broad isotope production base, Nusano positions itself to serve diverse diagnostic and therapeutic needs, accelerating market access and innovation.
June 2025 – GE Healthcare: At SNMMI 2025, GE Healthcare introduced LesionID™ Pro, featuring automated “zero-click” preprocessing for nuclear imaging workflows. This launch enhances clinical efficiency and promotes adoption of AI-powered diagnostic tools, strengthening GE’s competitive edge in imaging technology.
June 2025 – Telix Pharmaceuticals: Telix presented its updated theranostics programs and led satellite symposia spotlighting innovations in PSMA and CAIX imaging at SNMMI 2025.By emphasizing advancements in prostate and kidney cancer imaging, Telix underscores its leadership in the theranostics arena and raises the profile of its pipeline.
June 2025 – Mirion Medical: Mirion unveiled its expanded radiopharma and theranostics support portfolio at SNMMI 2025, showcasing solutions aimed at enabling the therapeutic nuclear medicine ecosystem. The comprehensive offering cements Mirion’s role as a critical infrastructure provider for radiopharmaceutical operations.
Frequently Asked Questions
How big is the Nuclear Medicine Market?
The Nuclear Medicine Market will reach USD 54.3 Bn by 2034 from USD 20.8 Bn in 2024, driven by rising cancer cases, cardiac disorders & advanced imaging demand.
Who are the major players in the Nuclear Medicine Market?
The institute for radioelements, The Australian Nuclear Science and Technology Organization, NTP Radioisotopes SOC Ltd, Nordion (Canada), Inc, Mallinckrodt, Lantheus Medical Imaging, Inc, Jubilant Life Sciences Ltd, GE Healthcare, Eczacıbaşı-Monrol, Eckert & Ziegler, Cardinal Health, Bracco Imaging S.P.A
Which segments covered the Nuclear Medicine Market?
By Product Type (Diagnostics, Therapeutics), By Application (Cardiology, Oncology, Neurology, Thyroid, Lymphoma, Bone Metastasis, Urology, Pulmonary Scans, Endocrine Tumor, Other), By End-user (Hospitals, Diagnostic Centers)
How can this market research report help my business make strategic decisions?
Our market research reports provide actionable intelligence, including verified market size data, CAGR projections, competitive benchmarking, and segment-level opportunity analysis. These insights support strategic planning, investment decisions, product development, and market entry strategies for enterprises and startups alike.
How frequently is the data updated?
We continuously monitor industry developments and update our reports to reflect regulatory changes, technological advancements, and macroeconomic shifts. Updated editions ensure you receive the latest market intelligence.