Oceanic Plastic Waste Recycling Market Hit $46.98B by 2034 | CAGR 7.8%
Global Oceanic Plastic Waste Recycling Market Size, Share, Analysis Report By Plastic Type (Polyethylene, Polypropylene, Polyvinyl Chloride, Polystyrene, Other Types), Recycling Method (Mechanical Recycling, Chemical Recycling), Application (Packaging, Textiles, Automotive, Construction, Other Applications), Region and Key Players - Industry Segment Overview, Market Dynamics, Competitive Strategies, Trends and Forecast 2025-2034
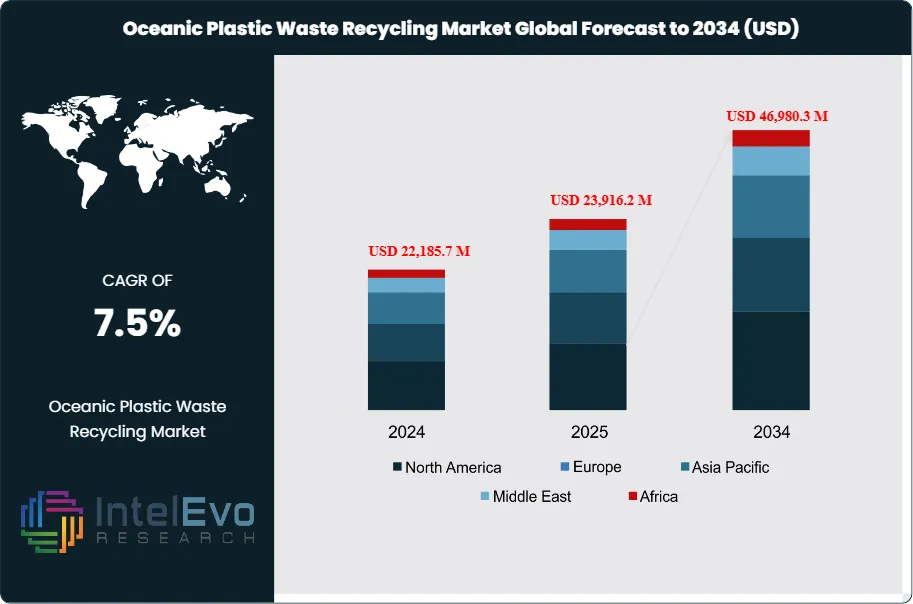
The Oceanic Plastic Waste Recycling Market size is projected to be worth around USD 46,980.3 Million by 2034, up from USD 22,185.7 Million in 2024, growing at a CAGR of 7.8% during the forecast period from 2025 to 2034. Rising awareness of marine pollution, stricter government regulations, and the growing shift toward a circular economy are driving the market’s momentum. The integration of advanced recycling technologies, such as chemical and enzymatic recycling, is expected to accelerate adoption. With strong investments from both public and private sectors, the market is positioned as a key enabler in global sustainability efforts, making it one of the most impactful industries to watch over the next decade.
The Global Oceanic Plastic Waste Recycling Market focuses on converting plastic waste collected from oceans into reusable materials. This market is driven by increasing environmental concerns regarding plastic pollution and a growing demand for sustainable practices across various industries. As the global population continues to rise, the accumulation of plastic waste in marine environments has become a critical issue, prompting initiatives from governments, NGOs, and businesses. Currently, the market is witnessing robust growth, supported by innovations in recycling technologies and a rising awareness of the economic benefits of waste management and resource recovery.
Several factors contribute to the growth dynamics of the oceanic plastic waste recycling market. Key growth drivers include stringent regulations imposed by governments to mitigate plastic waste and enhance recycling efforts. Additionally, advancements in recycling technologies, such as chemical recycling and waste-to-energy solutions, are increasing the efficiency and cost-effectiveness of recycling processes. Consumer demand for sustainable products is also on the rise, encouraging companies to adopt eco-friendly practices and invest in recycling initiatives. Collaborative efforts between public and private sectors are further stimulating market growth, leading to the establishment of partnerships aimed at cleaning up oceans and promoting circular economy practices.
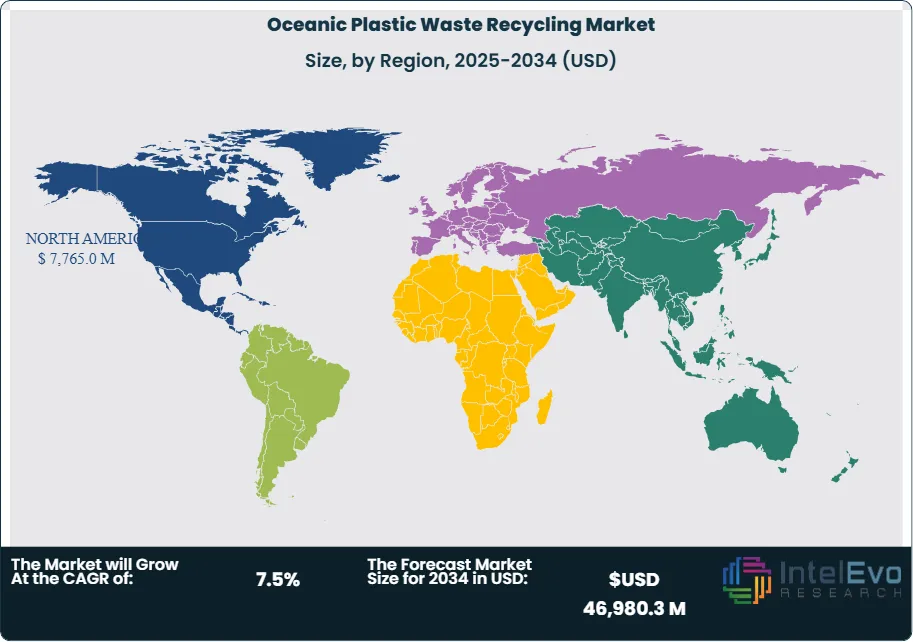
North America and Europe are currently leading the market due to established recycling infrastructures and stringent environmental policies. The United States has implemented various programs to tackle ocean plastic waste, while the European Union is promoting circular economy strategies. In Asia-Pacific, countries like Japan and India are gaining momentum in recycling initiatives, driven by increasing awareness of marine pollution. Latin America and the Middle East are also emerging markets, although they face challenges related to infrastructure and regulatory frameworks. Overall, the global distribution of recycling efforts is uneven, with developed regions outpacing developing regions in implementing effective solutions.
The COVID-19 pandemic had a significant impact on the oceanic plastic waste recycling market. Initially, lockdowns and restrictions led to a temporary decline in recycling activities due to reduced waste collection and processing capabilities. However, the pandemic also heightened awareness of plastic waste, particularly from single-use plastics used in personal protective equipment (PPE). This dual effect prompted a reevaluation of waste management practices and encouraged investment in recycling technologies. As economies recover, there is an increasing emphasis on sustainability, which is expected to drive growth in the oceanic plastic waste recycling market in the post-COVID era.
Key Takeaways:
Market Growth: The oceanic plastic waste recycling market is expected to reach USD $46,980.3 million by 2034, growing at a robust CAGR of 7.8%, reflecting a strong trend towards sustainability and effective waste management.
Plastic Type Analysis: Polyethylene (PE) dominates the market due to its widespread use in packaging applications. The high recyclability and versatility of PE make it a primary target for recycling initiatives, driving significant market demand.
Recycling Method Analysis: Mechanical recycling is the preferred method in the oceanic plastic waste recycling market, accounting for a substantial share. Its cost-effectiveness and established processes contribute to its popularity among recyclers and manufacturers.
Driver: Stringent government regulations aimed at reducing plastic waste and enhancing recycling efforts are driving market growth. These regulations are pushing industries to adopt sustainable practices, increasing the demand for recycled materials.
Restraint: Challenges related to the collection, sorting, and processing of oceanic plastic waste hinder market growth. Inefficient recycling infrastructures in some regions pose significant obstacles, limiting the overall recycling capacity and effectiveness.
Opportunity: The increasing focus on circular economy practices presents significant growth opportunities for the oceanic plastic waste recycling market. Companies can leverage innovations in recycling technologies to enhance efficiency and meet growing consumer demand for sustainable products.
Trend: Rising consumer awareness regarding ocean pollution is shaping market dynamics, driving companies to invest in sustainable practices and eco-friendly products.
Regional Analysis: North America and Europe are leading regions in the oceanic plastic waste recycling market, supported by robust regulatory frameworks and advanced recycling technologies. Asia-Pacific is emerging as a growth region due to increasing initiatives aimed at reducing marine plastic pollution.
Material Type:
The oceanic plastic waste recycling market is primarily segmented by plastic type, with polyethylene (PE) being the dominant material due to its widespread use in packaging and consumer products. PE's versatility and recyclability make it a key target for recycling initiatives aimed at reducing oceanic plastic pollution. Other significant plastic types include polypropylene (PP), which is often used in packaging and textiles, and polyvinyl chloride (PVC), commonly found in construction materials. The recycling processes for these plastics vary, with mechanical and chemical methods being employed to reclaim valuable raw materials. As consumer awareness of environmental issues increases, the demand for recycled materials from these plastic types is expected to rise, driving further growth in the market.
Recycling Technology:
The recycling method segment of the oceanic plastic waste recycling market is categorized into mechanical and chemical recycling. Mechanical recycling is the most prevalent method, where plastic waste is physically processed to produce recycled resin. This method is cost-effective and environmentally friendly but has limitations regarding the types of plastics that can be recycled. Chemical recycling, on the other hand, breaks down plastics into their chemical components, allowing for a broader range of materials to be processed, including those that are difficult to recycle mechanically. As technology advances, chemical recycling is gaining traction, with the potential to complement mechanical methods and enhance overall recycling efficiency. This shift towards diverse recycling methods is essential for improving plastic waste management in oceans.
Application:
The application segment encompasses various industries that utilize recycled oceanic plastics, including packaging, textiles, automotive, and construction. Packaging is the largest application, driven by the increasing demand for sustainable packaging solutions. Companies are increasingly using recycled plastics to meet consumer preferences for eco-friendly products. In textiles, recycled ocean plastics are being transformed into fibers for clothing and accessories, promoting circularity in fashion. The automotive industry is also exploring the use of recycled plastics for components, contributing to lighter and more sustainable vehicles. The construction sector is tapping into recycled plastics for materials like insulation and piping. This diversification of applications illustrates the vast potential of oceanic plastic waste recycling to create value across multiple industries.
Region Analysis:
North America Leads with Significant Market Share in the Oceanic Plastic Waste Recycling Market: North America holds the largest market share in the oceanic plastic waste recycling sector, primarily driven by stringent regulations and strong public awareness regarding plastic pollution. The United States and Canada have implemented comprehensive policies promoting recycling initiatives and reducing single-use plastics, effectively pushing industries toward sustainable practices. The presence of advanced recycling technologies and facilities further enhances the region's recycling capabilities, attracting investments from both public and private sectors. Moreover, numerous non-governmental organizations and community programs actively engage in raising awareness and implementing clean-up projects, contributing to the region's dominance. This commitment to addressing oceanic plastic waste has solidified North America's position as a leader in the global recycling market, accounting for a substantial share of total revenues.
The Asia-Pacific region is the fastest-growing market for oceanic plastic waste recycling, driven by increasing awareness of marine pollution and government initiatives aimed at enhancing recycling infrastructure. Countries such as Japan, India, and Australia are implementing robust policies to combat plastic waste, including bans on single-use plastics and incentives for recycling initiatives. The region's growing population and urbanization are also contributing to the rising demand for sustainable waste management solutions. Innovations in recycling technology, such as chemical recycling processes, are gaining traction, enabling the recycling of a wider variety of plastics. While challenges like inadequate infrastructure and regulatory frameworks persist in some areas, the overall commitment to sustainability and effective waste management positions Asia-Pacific as a key player in the future growth of the oceanic plastic waste recycling market. Other regions, including Europe and Latin America, continue to develop their recycling capabilities, reflecting a global shift toward sustainability.
By Material Type Polyethylene Terephthalate (PET), High-Density Polyethylene (HDPE), Polypropylene (PP), Polystyrene (PS), Polyvinyl Chloride (PVC), Others), By Source of Collection(Shoreline & Coastal Cleanup, Ocean Surface Collection, Seabed & Deep-Sea Collection), By Recycling Technology Mechanical Recycling, Chemical Recycling (Pyrolysis, Depolymerization, Gasification), Advanced Biodegradable Solutions), By End-Use Industry Packaging, Textiles & Fashion, Construction Materials, Automotive & Transportation, Consumer Goods, Others)
Research Methodology
Primary Research- 100 Interviews of Stakeholders
Secondary Research
Desk Research
Regional scope
North America (United States, Canada, Mexico)
Latin America (Brazil, Argentina, Columbia)
East Asia And Pacific (China, Japan, South Korea, Australia, Cambodia, Fiji, Indonesia)
Sea And South Asia (India, Singapore, Thailand, Taiwan, Malaysia)
Eastern Europe (Poland, Russia, Czech Republic, Romania)
Western Europe (Germany, U.K., France, Spain, Itlay)
Middle East & Africa (GCC Countries, Egypt, Nigeria, South Africa, Israel)
Competitive Landscape
Plastic Energy, BASF SE, Veolia Environment S.A., Dow Inc., Recipro, Covestro AG, Suez S.A., Closed Loop Partners, Greenback Recycling Technologies, Ocean Conservancy, Kreider Farms, Trex Company Inc., Alpla-Werke Alwin Lehner GmbH & Co KG, Indorama Ventures Public Company Limited, Waste Management Inc., PureCycle Technologies, LyondellBasell Industries Holdings B.V., Unilever, SC Johnson Professional, EarthGuardians
Customization Scope
Customization for segments, region/country-level will be provided. Moreover, additional customization can be done based on the requirements.
Pricing and Purchase Options
Avail customized purchase options to meet your exact research needs. We have three licenses to opt for: Single User License, Multi-User License (Up to 5 Users), Corporate Use License (Unlimited User and Printable PDF).
TABLE OF CONTENTS
1. EXECUTIVE SUMMARY
1.1. MARKET SNAPSHOT
1.2. KEY FINDINGS & INSIGHTS
1.3. ANALYST RECOMMENDATIONS
1.4. FUTURE OUTLOOK
2. RESEARCH METHODOLOGY
2.1. MARKET DEFINITION & SCOPE
2.2. RESEARCH OBJECTIVES: PRIMARY & SECONDARY DATA SOURCES
2.3. DATA COLLECTION SOURCES
2.3.1. COVERAGE OF 100+ PRIMARY RESEARCH/CONSULTATION CALLS WITH INDUSTRY STAKEHOLDERS
FIGURE 17 NORTH AMERICA OCEANIC PLASTIC WASTE RECYCLING CURRENT AND FUTURE TYPE ANALYSIS, 2025–2034, (USD MILLION)
FIGURE 18 NORTH AMERICA OCEANIC PLASTIC WASTE RECYCLING CURRENT AND FUTURE END USER ANALYSIS, 2025–2034, (USD MILLION)
FIGURE 19 MARKET SHARE BY COUNTRY
FIGURE 20 LATIN AMERICA OCEANIC PLASTIC WASTE RECYCLING CURRENT AND FUTURE TYPE ANALYSIS, 2025–2034, (USD MILLION)
FIGURE 21 LATIN AMERICA OCEANIC PLASTIC WASTE RECYCLING CURRENT AND FUTURE END USER ANALYSIS, 2025–2034, (USD MILLION)
FIGURE 22 MARKET SHARE BY COUNTRY
FIGURE 23 EASTERN EUROPE OCEANIC PLASTIC WASTE RECYCLING CURRENT AND FUTURE TYPE ANALYSIS, 2025–2034, (USD MILLION)
FIGURE 24 EASTERN EUROPE OCEANIC PLASTIC WASTE RECYCLING CURRENT AND FUTURE END USER ANALYSIS, 2025–2034, (USD MILLION)
FIGURE 25 MARKET SHARE BY COUNTRY
FIGURE 26 WESTERN EUROPE OCEANIC PLASTIC WASTE RECYCLING CURRENT AND FUTURE TYPE ANALYSIS, 2025–2034, (USD MILLION)
FIGURE 27 WESTERN EUROPE OCEANIC PLASTIC WASTE RECYCLING CURRENT AND FUTURE END USER ANALYSIS, 2025–2034, (USD MILLION)
FIGURE 28 MARKET SHARE BY COUNTRY
FIGURE 29 EAST ASIA AND PACIFIC OCEANIC PLASTIC WASTE RECYCLING CURRENT AND FUTURE TYPE ANALYSIS, 2025–2034, (USD MILLION)
FIGURE 30 EAST ASIA AND PACIFIC OCEANIC PLASTIC WASTE RECYCLING CURRENT AND FUTURE END USER ANALYSIS, 2025–2034, (USD MILLION)
FIGURE 31 MARKET SHARE BY COUNTRY
FIGURE 32 SEA AND SOUTH ASIA OCEANIC PLASTIC WASTE RECYCLING CURRENT AND FUTURE TYPE ANALYSIS, 2025–2034, (USD MILLION)
FIGURE 33 SEA AND SOUTH ASIA OCEANIC PLASTIC WASTE RECYCLING CURRENT AND FUTURE END USER ANALYSIS, 2025–2034, (USD MILLION)
FIGURE 34 MARKET SHARE BY COUNTRY
FIGURE 35 MIDDLE EAST AND AFRICA OCEANIC PLASTIC WASTE RECYCLING CURRENT AND FUTURE TYPE ANALYSIS, 2025–2034, (USD MILLION)
FIGURE 36 MIDDLE EAST AND AFRICA OCEANIC PLASTIC WASTE RECYCLING CURRENT AND FUTURE END USER ANALYSIS, 2025–2034, (USD MILLION)
FIGURE 37 NORTH AMERICA OCEANIC PLASTIC WASTE RECYCLING CURRENT AND FUTURE MARKET VOLUME SHARE REGIONAL ANALYSIS, 2025–2034, (USD MILLION)
FIGURE 38 U.S. OCEANIC PLASTIC WASTE RECYCLING CURRENT AND FUTURE TYPE ANALYSIS, 2025–2034, (USD MILLION)
FIGURE 39 U.S. OCEANIC PLASTIC WASTE RECYCLING CURRENT AND FUTURE END USER ANALYSIS, 2025–2034, (USD MILLION)
FIGURE 40 CANADA OCEANIC PLASTIC WASTE RECYCLING CURRENT AND FUTURE TYPE ANALYSIS, 2025–2034, (USD MILLION)
FIGURE 41 CANADA OCEANIC PLASTIC WASTE RECYCLING CURRENT AND FUTURE END USER ANALYSIS, 2025–2034, (USD MILLION)
FIGURE 42 LATIN AMERICA OCEANIC PLASTIC WASTE RECYCLING CURRENT AND FUTURE MARKET VOLUME SHARE REGIONAL ANALYSIS, 2025–2034, (USD MILLION)
FIGURE 43 MEXICO OCEANIC PLASTIC WASTE RECYCLING CURRENT AND FUTURE TYPE ANALYSIS, 2025–2034, (USD MILLION)
FIGURE 44 MEXICO OCEANIC PLASTIC WASTE RECYCLING CURRENT AND FUTURE END USER ANALYSIS, 2025–2034, (USD MILLION)
FIGURE 45 BRAZIL OCEANIC PLASTIC WASTE RECYCLING CURRENT AND FUTURE TYPE ANALYSIS, 2025–2034, (USD MILLION)
FIGURE 46 BRAZIL OCEANIC PLASTIC WASTE RECYCLING CURRENT AND FUTURE END USER ANALYSIS, 2025–2034, (USD MILLION)
FIGURE 47 ARGENTINA OCEANIC PLASTIC WASTE RECYCLING CURRENT AND FUTURE TYPE ANALYSIS, 2025–2034, (USD MILLION)
FIGURE 48 ARGENTINA OCEANIC PLASTIC WASTE RECYCLING CURRENT AND FUTURE END USER ANALYSIS, 2025–2034, (USD MILLION)
FIGURE 49 COLUMBIA OCEANIC PLASTIC WASTE RECYCLING CURRENT AND FUTURE TYPE ANALYSIS, 2025–2034, (USD MILLION)
FIGURE 50 COLUMBIA OCEANIC PLASTIC WASTE RECYCLING CURRENT AND FUTURE END USER ANALYSIS, 2025–2034, (USD MILLION)
FIGURE 51 REST OF LATIN AMERICA OCEANIC PLASTIC WASTE RECYCLING CURRENT AND FUTURE TYPE ANALYSIS, 2025–2034, (USD MILLION)
FIGURE 52 REST OF LATIN AMERICA OCEANIC PLASTIC WASTE RECYCLING CURRENT AND FUTURE END USER ANALYSIS, 2025–2034, (USD MILLION)
FIGURE 53 EASTERN EUROPE OCEANIC PLASTIC WASTE RECYCLING CURRENT AND FUTURE MARKET VOLUME SHARE REGIONAL ANALYSIS, 2025–2034, (USD MILLION)
FIGURE 54 POLAND OCEANIC PLASTIC WASTE RECYCLING CURRENT AND FUTURE TYPE ANALYSIS, 2025–2034, (USD MILLION)
FIGURE 55 POLAND OCEANIC PLASTIC WASTE RECYCLING CURRENT AND FUTURE END USER ANALYSIS, 2025–2034, (USD MILLION)
FIGURE 56 RUSSIA OCEANIC PLASTIC WASTE RECYCLING CURRENT AND FUTURE TYPE ANALYSIS, 2025–2034, (USD MILLION)
FIGURE 57 RUSSIA OCEANIC PLASTIC WASTE RECYCLING CURRENT AND FUTURE END USER ANALYSIS, 2025–2034, (USD MILLION)
FIGURE 58 CZECH REPUBLIC OCEANIC PLASTIC WASTE RECYCLING CURRENT AND FUTURE TYPE ANALYSIS, 2025–2034, (USD MILLION)
FIGURE 59 CZECH REPUBLIC OCEANIC PLASTIC WASTE RECYCLING CURRENT AND FUTURE END USER ANALYSIS, 2025–2034, (USD MILLION)
FIGURE 60 ROMANIA OCEANIC PLASTIC WASTE RECYCLING CURRENT AND FUTURE TYPE ANALYSIS, 2025–2034, (USD MILLION)
FIGURE 61 ROMANIA OCEANIC PLASTIC WASTE RECYCLING CURRENT AND FUTURE END USER ANALYSIS, 2025–2034, (USD MILLION)
FIGURE 62 REST OF EASTERN EUROPE OCEANIC PLASTIC WASTE RECYCLING CURRENT AND FUTURE TYPE ANALYSIS, 2025–2034, (USD MILLION)
FIGURE 63 REST OF EASTERN EUROPE OCEANIC PLASTIC WASTE RECYCLING CURRENT AND FUTURE END USER ANALYSIS, 2025–2034, (USD MILLION)
FIGURE 64 WESTERN EUROPE OCEANIC PLASTIC WASTE RECYCLING CURRENT AND FUTURE MARKET VOLUME SHARE REGIONAL ANALYSIS, 2025–2034, (USD MILLION)
FIGURE 65 GERMANY OCEANIC PLASTIC WASTE RECYCLING CURRENT AND FUTURE TYPE ANALYSIS, 2025–2034, (USD MILLION)
FIGURE 66 GERMANY OCEANIC PLASTIC WASTE RECYCLING CURRENT AND FUTURE END USER ANALYSIS, 2025–2034, (USD MILLION)
FIGURE 67 FRANCE OCEANIC PLASTIC WASTE RECYCLING CURRENT AND FUTURE TYPE ANALYSIS, 2025–2034, (USD MILLION)
FIGURE 68 FRANCE OCEANIC PLASTIC WASTE RECYCLING CURRENT AND FUTURE END USER ANALYSIS, 2025–2034, (USD MILLION)
FIGURE 69 UK OCEANIC PLASTIC WASTE RECYCLING CURRENT AND FUTURE TYPE ANALYSIS, 2025–2034, (USD MILLION)
FIGURE 70 UK OCEANIC PLASTIC WASTE RECYCLING CURRENT AND FUTURE END USER ANALYSIS, 2025–2034, (USD MILLION)
FIGURE 71 SPAIN OCEANIC PLASTIC WASTE RECYCLING CURRENT AND FUTURE TYPE ANALYSIS, 2025–2034, (USD MILLION)
FIGURE 72 SPAIN OCEANIC PLASTIC WASTE RECYCLING CURRENT AND FUTURE END USER ANALYSIS, 2025–2034, (USD MILLION)
FIGURE 73 ITALY OCEANIC PLASTIC WASTE RECYCLING CURRENT AND FUTURE TYPE ANALYSIS, 2025–2034, (USD MILLION)
FIGURE 74 ITALY OCEANIC PLASTIC WASTE RECYCLING CURRENT AND FUTURE END USER ANALYSIS, 2025–2034, (USD MILLION)
FIGURE 75 REST OF WESTERN EUROPE OCEANIC PLASTIC WASTE RECYCLING CURRENT AND FUTURE TYPE ANALYSIS, 2025–2034, (USD MILLION)
FIGURE 76 REST OF WESTERN EUROPE OCEANIC PLASTIC WASTE RECYCLING CURRENT AND FUTURE END USER ANALYSIS, 2025–2034, (USD MILLION)
FIGURE 77 EAST ASIA AND PACIFIC OCEANIC PLASTIC WASTE RECYCLING CURRENT AND FUTURE MARKET VOLUME SHARE REGIONAL ANALYSIS, 2025–2034, (USD MILLION)
FIGURE 78 CHINA OCEANIC PLASTIC WASTE RECYCLING CURRENT AND FUTURE TYPE ANALYSIS, 2025–2034, (USD MILLION)
FIGURE 79 CHINA OCEANIC PLASTIC WASTE RECYCLING CURRENT AND FUTURE END USER ANALYSIS, 2025–2034, (USD MILLION)
FIGURE 80 JAPAN OCEANIC PLASTIC WASTE RECYCLING CURRENT AND FUTURE TYPE ANALYSIS, 2025–2034, (USD MILLION)
FIGURE 81 JAPAN OCEANIC PLASTIC WASTE RECYCLING CURRENT AND FUTURE END USER ANALYSIS, 2025–2034, (USD MILLION)
FIGURE 82 AUSTRALIA OCEANIC PLASTIC WASTE RECYCLING CURRENT AND FUTURE TYPE ANALYSIS, 2025–2034, (USD MILLION)
FIGURE 83 AUSTRALIA OCEANIC PLASTIC WASTE RECYCLING CURRENT AND FUTURE END USER ANALYSIS, 2025–2034, (USD MILLION)
FIGURE 84 CAMBODIA OCEANIC PLASTIC WASTE RECYCLING CURRENT AND FUTURE TYPE ANALYSIS, 2025–2034, (USD MILLION)
FIGURE 85 CAMBODIA OCEANIC PLASTIC WASTE RECYCLING CURRENT AND FUTURE END USER ANALYSIS, 2025–2034, (USD MILLION)
FIGURE 86 FIJI OCEANIC PLASTIC WASTE RECYCLING CURRENT AND FUTURE TYPE ANALYSIS, 2025–2034, (USD MILLION)
FIGURE 87 FIJI OCEANIC PLASTIC WASTE RECYCLING CURRENT AND FUTURE END USER ANALYSIS, 2025–2034, (USD MILLION)
FIGURE 88 INDONESIA OCEANIC PLASTIC WASTE RECYCLING CURRENT AND FUTURE TYPE ANALYSIS, 2025–2034, (USD MILLION)
FIGURE 89 INDONESIA OCEANIC PLASTIC WASTE RECYCLING CURRENT AND FUTURE END USER ANALYSIS, 2025–2034, (USD MILLION)
FIGURE 90 SOUTH KOREA OCEANIC PLASTIC WASTE RECYCLING CURRENT AND FUTURE TYPE ANALYSIS, 2025–2034, (USD MILLION)
FIGURE 91 SOUTH KOREA OCEANIC PLASTIC WASTE RECYCLING CURRENT AND FUTURE END USER ANALYSIS, 2025–2034, (USD MILLION)
FIGURE 92 REST OF EAST ASIA AND PACIFIC OCEANIC PLASTIC WASTE RECYCLING CURRENT AND FUTURE TYPE ANALYSIS, 2025–2034, (USD MILLION)
FIGURE 93 REST OF EAST ASIA AND PACIFIC OCEANIC PLASTIC WASTE RECYCLING CURRENT AND FUTURE END USER ANALYSIS, 2025–2034, (USD MILLION)
FIGURE 94 SEA AND SOUTH ASIA OCEANIC PLASTIC WASTE RECYCLING CURRENT AND FUTURE MARKET VOLUME SHARE REGIONAL ANALYSIS, 2025–2034, (USD MILLION)
FIGURE 95 BANGLADESH OCEANIC PLASTIC WASTE RECYCLING CURRENT AND FUTURE TYPE ANALYSIS, 2025–2034, (USD MILLION)
FIGURE 96 BANGLADESH OCEANIC PLASTIC WASTE RECYCLING CURRENT AND FUTURE END USER ANALYSIS, 2025–2034, (USD MILLION)
FIGURE 97 NEW ZEALAND OCEANIC PLASTIC WASTE RECYCLING CURRENT AND FUTURE TYPE ANALYSIS, 2025–2034, (USD MILLION)
FIGURE 98 NEW ZEALAND OCEANIC PLASTIC WASTE RECYCLING CURRENT AND FUTURE END USER ANALYSIS, 2025–2034, (USD MILLION)
FIGURE 99 INDIA OCEANIC PLASTIC WASTE RECYCLING CURRENT AND FUTURE TYPE ANALYSIS, 2025–2034, (USD MILLION)
FIGURE 100 INDIA OCEANIC PLASTIC WASTE RECYCLING CURRENT AND FUTURE END USER ANALYSIS, 2025–2034, (USD MILLION)
FIGURE 101 SINGAPORE OCEANIC PLASTIC WASTE RECYCLING CURRENT AND FUTURE TYPE ANALYSIS, 2025–2034, (USD MILLION)
FIGURE 102 SINGAPORE OCEANIC PLASTIC WASTE RECYCLING CURRENT AND FUTURE END USER ANALYSIS, 2025–2034, (USD MILLION)
FIGURE 103 THAILAND OCEANIC PLASTIC WASTE RECYCLING CURRENT AND FUTURE TYPE ANALYSIS, 2025–2034, (USD MILLION)
FIGURE 104 THAILAND OCEANIC PLASTIC WASTE RECYCLING CURRENT AND FUTURE END USER ANALYSIS, 2025–2034, (USD MILLION)
FIGURE 105 TAIWAN OCEANIC PLASTIC WASTE RECYCLING CURRENT AND FUTURE TYPE ANALYSIS, 2025–2034, (USD MILLION)
FIGURE 106 TAIWAN OCEANIC PLASTIC WASTE RECYCLING CURRENT AND FUTURE END USER ANALYSIS, 2025–2034, (USD MILLION)
FIGURE 107 MALAYSIA OCEANIC PLASTIC WASTE RECYCLING CURRENT AND FUTURE TYPE ANALYSIS, 2025–2034, (USD MILLION)
FIGURE 108 MALAYSIA OCEANIC PLASTIC WASTE RECYCLING CURRENT AND FUTURE END USER ANALYSIS, 2025–2034, (USD MILLION)
FIGURE 109 REST OF SEA AND SOUTH ASIA OCEANIC PLASTIC WASTE RECYCLING CURRENT AND FUTURE TYPE ANALYSIS, 2025–2034, (USD MILLION)
FIGURE 110 REST OF SEA AND SOUTH ASIA OCEANIC PLASTIC WASTE RECYCLING CURRENT AND FUTURE END USER ANALYSIS, 2025–2034, (USD MILLION)
FIGURE 111 MIDDLE EAST AND AFRICA OCEANIC PLASTIC WASTE RECYCLING CURRENT AND FUTURE MARKET VOLUME SHARE REGIONAL ANALYSIS, 2025–2034, (USD MILLION)
FIGURE 112 GCC COUNTRIES OCEANIC PLASTIC WASTE RECYCLING CURRENT AND FUTURE TYPE ANALYSIS, 2025–2034, (USD MILLION)
FIGURE 113 GCC COUNTRIES OCEANIC PLASTIC WASTE RECYCLING CURRENT AND FUTURE END USER ANALYSIS, 2025–2034, (USD MILLION)
FIGURE 114 SAUDI ARABIA OCEANIC PLASTIC WASTE RECYCLING CURRENT AND FUTURE TYPE ANALYSIS, 2025–2034, (USD MILLION)
FIGURE 115 SAUDI ARABIA OCEANIC PLASTIC WASTE RECYCLING CURRENT AND FUTURE END USER ANALYSIS, 2025–2034, (USD MILLION)
FIGURE 116 UAE OCEANIC PLASTIC WASTE RECYCLING CURRENT AND FUTURE TYPE ANALYSIS, 2025–2034, (USD MILLION)
FIGURE 117 UAE OCEANIC PLASTIC WASTE RECYCLING CURRENT AND FUTURE END USER ANALYSIS, 2025–2034, (USD MILLION)
FIGURE 118 BAHRAIN OCEANIC PLASTIC WASTE RECYCLING CURRENT AND FUTURE TYPE ANALYSIS, 2025–2034, (USD MILLION)
FIGURE 119 BAHRAIN OCEANIC PLASTIC WASTE RECYCLING CURRENT AND FUTURE END USER ANALYSIS, 2025–2034, (USD MILLION)
FIGURE 120 KUWAIT OCEANIC PLASTIC WASTE RECYCLING CURRENT AND FUTURE TYPE ANALYSIS, 2025–2034, (USD MILLION)
FIGURE 121 KUWAIT OCEANIC PLASTIC WASTE RECYCLING CURRENT AND FUTURE END USER ANALYSIS, 2025–2034, (USD MILLION)
FIGURE 122 OMAN OCEANIC PLASTIC WASTE RECYCLING CURRENT AND FUTURE TYPE ANALYSIS, 2025–2034, (USD MILLION)
FIGURE 123 OMAN OCEANIC PLASTIC WASTE RECYCLING CURRENT AND FUTURE END USER ANALYSIS, 2025–2034, (USD MILLION)
FIGURE 124 QATAR OCEANIC PLASTIC WASTE RECYCLING CURRENT AND FUTURE TYPE ANALYSIS, 2025–2034, (USD MILLION)
FIGURE 125 QATAR OCEANIC PLASTIC WASTE RECYCLING CURRENT AND FUTURE END USER ANALYSIS, 2025–2034, (USD MILLION)
FIGURE 126 EGYPT OCEANIC PLASTIC WASTE RECYCLING CURRENT AND FUTURE TYPE ANALYSIS, 2025–2034, (USD MILLION)
FIGURE 127 EGYPT OCEANIC PLASTIC WASTE RECYCLING CURRENT AND FUTURE END USER ANALYSIS, 2025–2034, (USD MILLION)
FIGURE 128 NIGERIA OCEANIC PLASTIC WASTE RECYCLING CURRENT AND FUTURE TYPE ANALYSIS, 2025–2034, (USD MILLION)
FIGURE 129 NIGERIA OCEANIC PLASTIC WASTE RECYCLING CURRENT AND FUTURE END USER ANALYSIS, 2025–2034, (USD MILLION)
FIGURE 130 SOUTH AFRICA OCEANIC PLASTIC WASTE RECYCLING CURRENT AND FUTURE TYPE ANALYSIS, 2025–2034, (USD MILLION)
FIGURE 131 SOUTH AFRICA OCEANIC PLASTIC WASTE RECYCLING CURRENT AND FUTURE END USER ANALYSIS, 2025–2034, (USD MILLION)
FIGURE 132 ISRAEL OCEANIC PLASTIC WASTE RECYCLING CURRENT AND FUTURE TYPE ANALYSIS, 2025–2034, (USD MILLION)
FIGURE 133 ISRAEL OCEANIC PLASTIC WASTE RECYCLING CURRENT AND FUTURE END USER ANALYSIS, 2025–2034, (USD MILLION)
FIGURE 134 REST OF MEA OCEANIC PLASTIC WASTE RECYCLING CURRENT AND FUTURE TYPE ANALYSIS, 2025–2034, (USD MILLION)
FIGURE 135 REST OF MEA OCEANIC PLASTIC WASTE RECYCLING CURRENT AND FUTURE END USER ANALYSIS, 2025–2034, (USD MILLION)
FIGURE 136 U. S. MARKET SHARE ANALYSIS BY TYPE (2024)
FIGURE 137 U. S. MARKET SHARE ANALYSIS BY END USER (2024)
FIGURE 138 CANADA MARKET SHARE ANALYSIS BY TYPE (2024)
FIGURE 139 CANADA MARKET SHARE ANALYSIS BY END USER (2024)
FIGURE 140 MEXICO MARKET SHARE ANALYSIS BY TYPE (2024)
FIGURE 141 MEXICO MARKET SHARE ANALYSIS BY END USER (2024)
FIGURE 142 CHINA MARKET SHARE ANALYSIS BY TYPE (2024)
FIGURE 143 CHINA MARKET SHARE ANALYSIS BY END USER (2024)
FIGURE 144 JAPAN MARKET SHARE ANALYSIS BY TYPE (2024)
FIGURE 145 JAPAN MARKET SHARE ANALYSIS BY END USER (2024)
FIGURE 146 INDIA MARKET SHARE ANALYSIS BY TYPE (2024)
FIGURE 147 INDIA MARKET SHARE ANALYSIS BY END USER (2024)
FIGURE 148 SOUTH KOREA MARKET SHARE ANALYSIS BY TYPE (2024)
FIGURE 149 SOUTH KOREA MARKET SHARE ANALYSIS BY END USER (2024)
FIGURE 150 SAUDI ARABIA MARKET SHARE ANALYSIS BY TYPE (2024)
FIGURE 151 SAUDI ARABIA MARKET SHARE ANALYSIS BY END USER (2024)
FIGURE 152 UAE MARKET SHARE ANALYSIS BY TYPE (2024)
FIGURE 153 UAE MARKET SHARE ANALYSIS BY END USER (2024)
FIGURE 154 EGYPT MARKET SHARE ANALYSIS BY TYPE (2024)
FIGURE 155 EGYPT MARKET SHARE ANALYSIS BY END USER (2024)
FIGURE 156 NIGERIA MARKET SHARE ANALYSIS BY TYPE (2024)
FIGURE 157 NIGERIA MARKET SHARE ANALYSIS BY END USER (2024)
FIGURE 158 SOUTH AFRICA MARKET SHARE ANALYSIS BY TYPE (2024)
FIGURE 159 SOUTH AFRICA MARKET SHARE ANALYSIS BY END USER (2024)
FIGURE 160 GERMANY MARKET SHARE ANALYSIS BY TYPE (2024)
FIGURE 161 GERMANY MARKET SHARE ANALYSIS BY END USER (2024)
FIGURE 162 FRANCE MARKET SHARE ANALYSIS BY TYPE (2024)
FIGURE 163 FRANCE MARKET SHARE ANALYSIS BY END USER (2024)
FIGURE 164 UK MARKET SHARE ANALYSIS BY TYPE (2024)
FIGURE 165 UK MARKET SHARE ANALYSIS BY END USER (2024)
FIGURE 166 SPAIN MARKET SHARE ANALYSIS BY TYPE (2024)
FIGURE 167 SPAIN MARKET SHARE ANALYSIS BY END USER (2024)
FIGURE 168 ITALY MARKET SHARE ANALYSIS BY TYPE (2024)
FIGURE 169 ITALY MARKET SHARE ANALYSIS BY END USER (2024)
FIGURE 170 BRAZIL MARKET SHARE ANALYSIS BY TYPE (2024)
FIGURE 171 BRAZIL MARKET SHARE ANALYSIS BY END USER (2024)
FIGURE 172 ARGENTINA MARKET SHARE ANALYSIS BY TYPE (2024)
FIGURE 173 ARGENTINA MARKET SHARE ANALYSIS BY END USER (2024)
FIGURE 174 COLUMBIA MARKET SHARE ANALYSIS BY TYPE (2024)
FIGURE 175 COLUMBIA MARKET SHARE ANALYSIS BY END USER (2024)
FIGURE 176 GLOBAL OCEANIC PLASTIC WASTE RECYCLING CURRENT AND FUTURE MARKET KEY COUNTRY LEVEL ANALYSIS, 2024–2034, (USD MILLION)
FIGURE 177 FINANCIAL OVERVIEW:
Key Players Analysis:
Plastic Energy: Based in the UK, Plastic Energy focuses on recycling plastic waste through its innovative thermal anaerobic technology. This process converts end-of-life plastics into valuable feedstock for new plastics, enabling a circular economy. Their strategy emphasizes partnerships with chemical companies to promote sustainable materials and reduce ocean plastic pollution.
BASF SE: A global leader in the chemical industry, BASF SE operates in more than 80 countries, including Germany, the U.S., and China. The company offers a range of products derived from recycled plastics. BASF aims to innovate in sustainable materials, focusing on developing solutions that support a circular economy and reduce environmental impact.
Veolia Environment S.A.: Veolia, headquartered in France, provides waste management and recycling services globally. The company specializes in plastic recycling and operates numerous facilities for sorting and processing plastic waste. Veolia's strategy focuses on sustainability and resource recovery, aiming to minimize waste and foster circular economy practices in urban environments.
Dow Inc.: Dow, based in the U.S., is a leading materials science company that emphasizes sustainable innovation. Dow produces advanced materials from recycled plastics, catering to various industries. The company's strategy involves collaborations to enhance recycling technologies and promote sustainable practices, aiming to significantly reduce oceanic plastic waste through its global operations.
Recipro: Based in the Netherlands, Recipro specializes in circular economy solutions for plastic waste. Their service includes collection, sorting, and recycling of plastics, with a focus on creating high-quality recycled materials. Recipro's business strategy revolves around innovation in recycling processes and forming partnerships to enhance sustainability across the supply chain.
Covestro AG: A global leader in polymer production, Covestro AG, headquartered in Germany, produces materials using recycled plastics for various applications, including automotive and construction. The company prioritizes sustainability and aims to create a circular economy through innovative recycling technologies and collaboration with industry partners to reduce plastic waste.
Suez S.A.: Suez, based in France, provides water and waste management services worldwide. The company specializes in recycling and recovery of plastic waste, operating multiple recycling facilities. Suez's strategy focuses on innovation and efficiency, aiming to improve recycling rates and contribute to environmental sustainability, particularly in oceanic plastic waste reduction.
Closed Loop Partners: Located in the U.S., Closed Loop Partners is an investment firm dedicated to the circular economy. The company focuses on financing and supporting innovative recycling technologies and sustainable business models. Their strategy emphasizes collaboration with brands and municipalities to improve plastic waste management systems and drive investment in recycling infrastructure.
Greenback Recycling Technologies: Based in Canada, Greenback specializes in the recycling of ocean-bound plastics. The company uses proprietary technology to convert plastic waste into high-quality recycled resin. Their business strategy focuses on sustainable sourcing and collaboration with brands looking to enhance their circular economy initiatives, addressing the critical issue of ocean plastic pollution.
Ocean Conservancy: As a nonprofit organization based in the U.S., Ocean Conservancy focuses on ocean health and sustainability. While not a recycling company per se, it collaborates with various stakeholders to promote recycling initiatives and reduce plastic waste in oceans. Its strategy emphasizes advocacy, education, and community engagement to foster sustainable practices globally.
Market Key Players
Plastic Energy
BASF SE
Veolia Environment S.A.
Dow Inc.
Recipro
Covestro AG
Suez S.A.
Closed Loop Partners
Greenback Recycling Technologies
Ocean Conservancy
Kreider Farms
Trex Company, Inc.
Alpla-Werke Alwin Lehner GmbH & Co KG
Indorama Ventures Public Company Limited
Waste Management, Inc.
PureCycle Technologies
LyondellBasell Industries Holdings B.V.
Unilever
SC Johnson Professional
EarthGuardians
Driver:
Government Regulations and Policies
Governments worldwide are increasingly implementing stringent regulations and policies to combat plastic pollution, significantly driving the oceanic plastic waste recycling market. Initiatives such as the European Union's directive on single-use plastics and various national bans on plastic bags and straws are pushing industries toward sustainable practices. These regulations encourage companies to invest in recycling technologies and develop eco-friendly alternatives, resulting in a notable increase in recycled plastic demand. As a consequence, municipalities are also enhancing their recycling facilities to meet these regulatory requirements, creating a favorable environment for the growth of the recycling market. The heightened focus on sustainability and responsible waste management directly correlates with the rising demand for recycling solutions.
Consumer Awareness and Demand for Sustainable Products
Rising consumer awareness regarding environmental issues, particularly plastic pollution in oceans, is a significant driver of the oceanic plastic waste recycling market. As consumers become more informed about the impact of plastic waste on marine life and ecosystems, they increasingly prefer products made from recycled materials. This shift in consumer behavior prompts manufacturers to adopt sustainable practices and incorporate recycled plastics into their products. Brands that emphasize sustainability in their messaging are gaining a competitive edge in the market, further fueling the demand for recycled ocean plastics. Companies are also actively promoting their recycling efforts as part of corporate social responsibility (CSR) initiatives, which resonates well with eco-conscious consumers and boosts market growth.
Technological Advancements in Recycling Processes
Innovations in recycling technology are transforming the oceanic plastic waste recycling landscape, acting as a key driver for market growth. Advanced methods, such as chemical recycling, enable the processing of a wider variety of plastics, including those that are typically difficult to recycle through traditional mechanical methods. These technologies not only improve recycling efficiency but also enhance the quality of recycled materials, making them more attractive to manufacturers. Additionally, the development of automated sorting technologies facilitates the effective separation of different plastic types, streamlining the recycling process. As these technologies become more accessible and affordable, they contribute significantly to increasing recycling rates, addressing oceanic plastic pollution more effectively.
Restraints:
Inefficient Collection and Sorting Infrastructure
One of the primary restraints hindering the growth of the oceanic plastic waste recycling market is the inefficient collection and sorting infrastructure. Many regions, particularly in developing countries, lack the necessary systems to effectively collect, transport, and sort plastic waste for recycling. This inefficiency results in a significant amount of plastic waste ending up in landfills or oceans, undermining recycling efforts. The absence of adequate sorting facilities means that recyclable plastics are often mixed with non-recyclable materials, further complicating the recycling process. Addressing these infrastructural challenges requires substantial investment and coordination among governments, waste management companies, and communities, which can be difficult to achieve in resource-constrained settings.
High Costs of Recycling Technologies
The high costs associated with advanced recycling technologies present another significant restraint in the oceanic plastic waste recycling market. Although innovations such as chemical recycling and automated sorting systems have the potential to improve recycling rates and efficiency, the initial investment for implementing these technologies can be prohibitively expensive for many recycling facilities. Smaller operators may struggle to access the funding needed to upgrade their processes or invest in new technologies, limiting their capacity to recycle effectively. Furthermore, the fluctuating prices of oil and virgin plastics can make recycled materials less economically viable, discouraging investments in recycling operations. This cost barrier can hinder the overall growth of the market.
Opportunities:
Emerging Market for Sustainable Materials:
The growing trend towards sustainability presents a significant opportunity for the oceanic plastic waste recycling market. As more industries, including fashion, automotive, and packaging, seek to incorporate sustainable materials into their products, the demand for recycled plastics is set to rise. Companies can capitalize on this opportunity by developing innovative products that utilize recycled materials, catering to eco-conscious consumers. This shift towards circular economy practices not only fosters brand loyalty but also meets regulatory requirements aimed at reducing plastic waste. By tapping into this emerging market for sustainable materials, businesses can differentiate themselves and create new revenue streams, contributing to the overall growth of the recycling market.
Collaborations and Partnerships for Innovation:
Collaborations and partnerships among governments, non-governmental organizations, and private companies present another valuable opportunity for the oceanic plastic waste recycling market. By working together, these entities can pool resources, share knowledge, and develop innovative recycling technologies and practices. Public-private partnerships can lead to improved infrastructure, enhanced collection and sorting systems, and increased investment in recycling initiatives. Additionally, collaboration can foster the development of new business models focused on sustainability and circularity, allowing for greater efficiency in recycling processes. As awareness of oceanic plastic pollution grows, these partnerships can drive meaningful change and create a more robust recycling ecosystem.
Trend:
Shift Towards Circular Economy Practices:
A significant trend in the oceanic plastic waste recycling market is the growing shift towards circular economy practices. Businesses are increasingly recognizing the importance of sustainable practices in their operations, aiming to minimize waste and maximize resource efficiency. This trend encourages companies to not only recycle plastic waste but also design products for durability and recyclability from the outset. Many organizations are adopting life-cycle assessments to better understand the environmental impact of their products, driving them to implement circular strategies. This focus on circular economy principles not only contributes to reducing oceanic plastic pollution but also fosters innovation in product design and materials, further strengthening the market for oceanic plastic waste recycling.
Recent Development:
In August 2024: Unilever, in collaboration with USAID and EY, launched the CIRCLE Alliance, a public-private initiative aimed at addressing plastic pollution. This $21 million effort will support entrepreneurs and small businesses in the plastics value chain, focusing on women's economic empowerment and the development of circular economies in countries like India, Indonesia, Vietnam, and the Philippines.
In September 2024: A new study by the Ellen MacArthur Foundation revealed that companies adopting circular economy principles could significantly reduce their plastic footprint. The study highlights the importance of collaboration between businesses and governments to enhance recycling rates and develop innovative solutions for plastic waste management.
Frequently Asked Questions
How big is the Oceanic Plastic Waste Recycling Market?
The Oceanic Plastic Waste Recycling Market is projected to reach USD 46.98 Bn by 2034, driven by advanced recycling tech, circular economy initiatives, and sustainability trends.
Who are the major players in the Oceanic Plastic Waste Recycling Market?
Plastic Energy, BASF SE, Veolia Environment S.A., Dow Inc., Recipro, Covestro AG, Suez S.A., Closed Loop Partners, Greenback Recycling Technologies, Ocean Conservancy, Kreider Farms, Trex Company Inc., Alpla-Werke Alwin Lehner GmbH & Co KG, Indorama Ventures Public Company Limited, Waste Management Inc., PureCycle Technologies, LyondellBasell Industries Holdings B.V., Unilever, SC Johnson Professional, EarthGuardians
Which segments covered the Oceanic Plastic Waste Recycling Market?
By Material Type Polyethylene Terephthalate (PET), High-Density Polyethylene (HDPE), Polypropylene (PP), Polystyrene (PS), Polyvinyl Chloride (PVC), Others), By Source of Collection(Shoreline & Coastal Cleanup, Ocean Surface Collection, Seabed & Deep-Sea Collection), By Recycling Technology Mechanical Recycling, Chemical Recycling (Pyrolysis, Depolymerization, Gasification), Advanced Biodegradable Solutions), By End-Use Industry Packaging, Textiles & Fashion, Construction Materials, Automotive & Transportation, Consumer Goods, Others)
How can this market research report help my business make strategic decisions?
Our market research reports provide actionable intelligence, including verified market size data, CAGR projections, competitive benchmarking, and segment-level opportunity analysis. These insights support strategic planning, investment decisions, product development, and market entry strategies for enterprises and startups alike.
How frequently is the data updated?
We continuously monitor industry developments and update our reports to reflect regulatory changes, technological advancements, and macroeconomic shifts. Updated editions ensure you receive the latest market intelligence.

 Aerospace And Defence
 Agriculture
 Automotive And Transportation
 Banking And Finance
 Business
 Chemicals And Materials
 Consumer And Retail
 Electronics And Semiconductors
 Food And Beverages
 Machinery & Equipments
 Manufacturing And Construction
 Medical Devices
 Others
 Pharmaceuticals And Healthcare
 Power And Energy
 Sports
 Technology

, Recycling Method (Mechanical Recycling, Chemical Recycling), Application (Packaging, Textiles, Automotive, Construction, Other Applications), Region and Key Players - Industry Segment Overview, Market Dynamics, Competitive Strategies, Trends and Forecast 2025-2034")
, Recycling Method (Mechanical Recycling, Chemical Recycling), Application (Packaging, Textiles, Automotive, Construction, Other Applications), Region and Key Players - Industry Segment Overview, Market Dynamics, Competitive Strategies, Trends and Forecast 2025-2034")
, Recycling Method (Mechanical Recycling, Chemical Recycling), Application (Packaging, Textiles, Automotive, Construction, Other Applications), Region and Key Players - Industry Segment Overview, Market Dynamics, Competitive Strategies, Trends and Forecast 2025-2034")
, Recycling Method (Mechanical Recycling, Chemical Recycling), Application (Packaging, Textiles, Automotive, Construction, Other Applications), Region and Key Players - Industry Segment Overview, Market Dynamics, Competitive Strategies, Trends and Forecast 2025-2034")

